
 Download:


-
Influenza, an acute respiratory infectious disease caused by the influenza virus, threatens global public health due to its high incidence, transmissibility, and severe complications (1). Effective surveillance is crucial for timely public health interventions.
Influenza spread is influenced by climatic, human migration, social media, and socioeconomic status (2). Integrating multisource data outbreak prediction remains challenging.
Artificial intelligence (AI) has introduced new scope in disease prediction. Deep learning (DL), a machine learning (ML) subset, enables model optimization through self-supervised learning, showing superior prediction performance (3). These technologies show potential for disease prediction by capturing complex patterns (4).
This study explored the relationship between influenza cases and surveillance systems in a southern Chinese city, using AI techniques to establish prediction models for influenza epidemics, to refine monitoring strategies and inform public health responses.
-
This study was conducted in a major southern Chinese city with 13 million residents in late 2023. Located at 114° 30′ E and 30° 58′ N, it has a subtropical monsoon humid climate with hot summers and cold winters. Influenza occurs more in winter and spring. Several hospitals serve as influenza surveillance sentinel to collect representative data systematically. To build the prediction model, data were collected from multichannel surveillance systems, including influenza cases, hospitals, meteorological and air pollutant surveillance systems, and search engine data (
Supplementary Table S1 ). -
Daily influenza reported cases were obtained from China Information System for Disease Control and Prevention (5). All case details were identified. After tallying daily case counts, missing data for 70 days (70/731, 9%) was identified. Linear interpolation was chosen for its ability to preserve temporal structure and provide reliable estimates for short-term missing values, making it preferable to mean imputation or deletion.
Daily fever clinic attendance and nine related symptoms, including runny nose, cough, sore throat, dyspnea, fever, headache, joint pain, myalgia, and fatigue, were collected from Electronic Medical Records (EMRs) of outpatient visits.
Baidu, a Chinese search engine, provides a search index for tracking keyword trends and user behavior. Baidu Search Index (BSI) data covering desktop and mobile queries were collected using influenza symptoms keywords (https://index.baidu.com/[accessed 2025-01-05]).
Air pollutant surveillance data, including concentrations of particulate matter with aerodynamic diameter ≤2.5 μm (PM2.5), particulate matter with aerodynamic diameter ≤10.0 μm (PM10), nitrogen dioxides (NO2), sulfur dioxide (SO2), carbon monoxide (CO), and ozone (O3), were obtained from the city’s Department of Ecology and Environment website.
Meteorological surveillance data were obtained from China Meteorological Data Sharing Service Center (http://data.cma.cn/en [accessed 2025-01-05]), including daily mean temperature (Tmean), mean relative humidity (RHmean), mean air pressure, mean wind speed, mean precipitation, and mean visibility range. The mean absolute humidity (AHmean) was calculated based on Tmean and RHmean as following formula (6):
$$ \begin{aligned} AHmean= & \{6.112\times exp[\left(17.67\times Tmean\right)/\\ & \left(Tmean\pm 243.5\right)]\times RHmean\times 2.1674 \}/\\ & \left(273.15+Tmean\right) \end{aligned} $$ -
Spearman’s correlation coefficients were calculated for all variables for daily reported cases, as data showed strong non-parametric distributions. Each variable was normalized to 0–1 to facilitate model compatibility.
This study used ML methods to build prediction models: ensemble models (Random Forest and eXtreme Gradient Boosting), linear regression, and instance-based models (K-Nearest Neighbor). Two DL models, the Gated Recurrent Unit and Long Short-Term Memory (LSTM), were used.
In the model construction process, variables with P<0.05 in correlation analysis were selected as model inputs. Lagged correlations evaluated relationships between each variable and reported cases from –7 to 0 days. For prediction on day t, variables with highest correlation coefficients from t–7 to t were selected.
For the DL models, grid search determined optimal hyperparameter combinations. The selected hidden sizes were 32, 64, 128, and 256. The number of layers ranged from one to three in steps by one. Dropout values ranged from 0.3 to 0.5 step by 0.05. The learning rate values selected were 0.01, 0.05, 0.001, and 0.0005. Adam was selected as the optimizer.
The data from January 2023 to January 2025 showed two peaks in influenza cases and an upward trend in late 2024 (
Supplementary Figure S1 ). The dataset was split in an 8∶2 ratio into a training set (January 2023 to August 2024) and testing set (August 2024 to January 2025) for model training and validation. This ensured adequate training data while maintaining a predictive baseline for validation. The model performance was evaluated by comparing predicted and actual data using the coefficient of determination (R2) (values close to 1 indicate better prediction), mean absolute error (MAE), mean absolute percentage error (MAPE), and root mean square error (RMSE) (values close to 0 indicate better prediction). -
To evaluate model validity and robustness of the selected dataset and constructed model, comparative analysis of the performances of the various models was conducted. Prediction models were developed using four surveillance systems: hospital (H), search engine (B), meteorological (M), and air pollutant (P). These models involved individual systems and their combinations: Model H, Model B, Model M, Model P, Model H+B, Model H+M, Model H+P, Model B+M, Model B+P, Model M+P, Model H+B+M, Model H+B+P, Model H+M+P, Model B+M+P, Model All, totaling 15 models.
-
All the time-series data were smoothed. All statistical analyses in this study were performed using Python (version 3.12.0; Python Software Foundation, Wilmington, Delaware, USA) and TensorFlow (version 2.0.0; Google LLC, Mountain View, California, USA).
-
From January 2023 to January 2025, the reported influenza cases showed three distinct peaks (
Supplementary Figure S1 ): the first in early 2023, second from December 2023 to January 2024, and third in late 2024. These peaks highlight the seasonal and fluctuating nature of influenza infections.During monitoring, the number of fever clinic visits and nine symptoms showed trends similar to those of influenza cases but with discrepancies. Fever clinic visits increased in early 2023 and from October 2023 to January 2024, matching the first two peaks, but not the third in late 2024 (
Supplementary Figure S2 ). The daily frequencies of nine influenza-related symptoms showed similar patterns (Supplementary Figure S3 ). Daily BSI trends, climatic factors, and air pollutants are detailed inSupplementary Figures S4–S6 . -
Figure 1 shows the lag correlations between all surveillance data and the reported cases over the monitoring period. Most correlations were statistically significant (P<0.001). Symptoms like sore throat, cough, and myalgia showed strong positive correlations at shorter lags (0–3 days). Myalgia reached a correlation of 0.694 [95% confidence interval (CI): 0.654, 0.730] at Coef-0, sore throat was 0.634 (95% CI: 0.588, 0.675) at Coef-0, and cough was 0.566 (95% CI: 0.514, 0.613) at Coef-1. The meteorological factors and air pollutants were weakly correlated. Tmean had a correlation of −0.456 at Coef-7 and −0.425 at Coef-3, while O3 had −0.337 at Coef-7 and −0.321 at Coef-5.
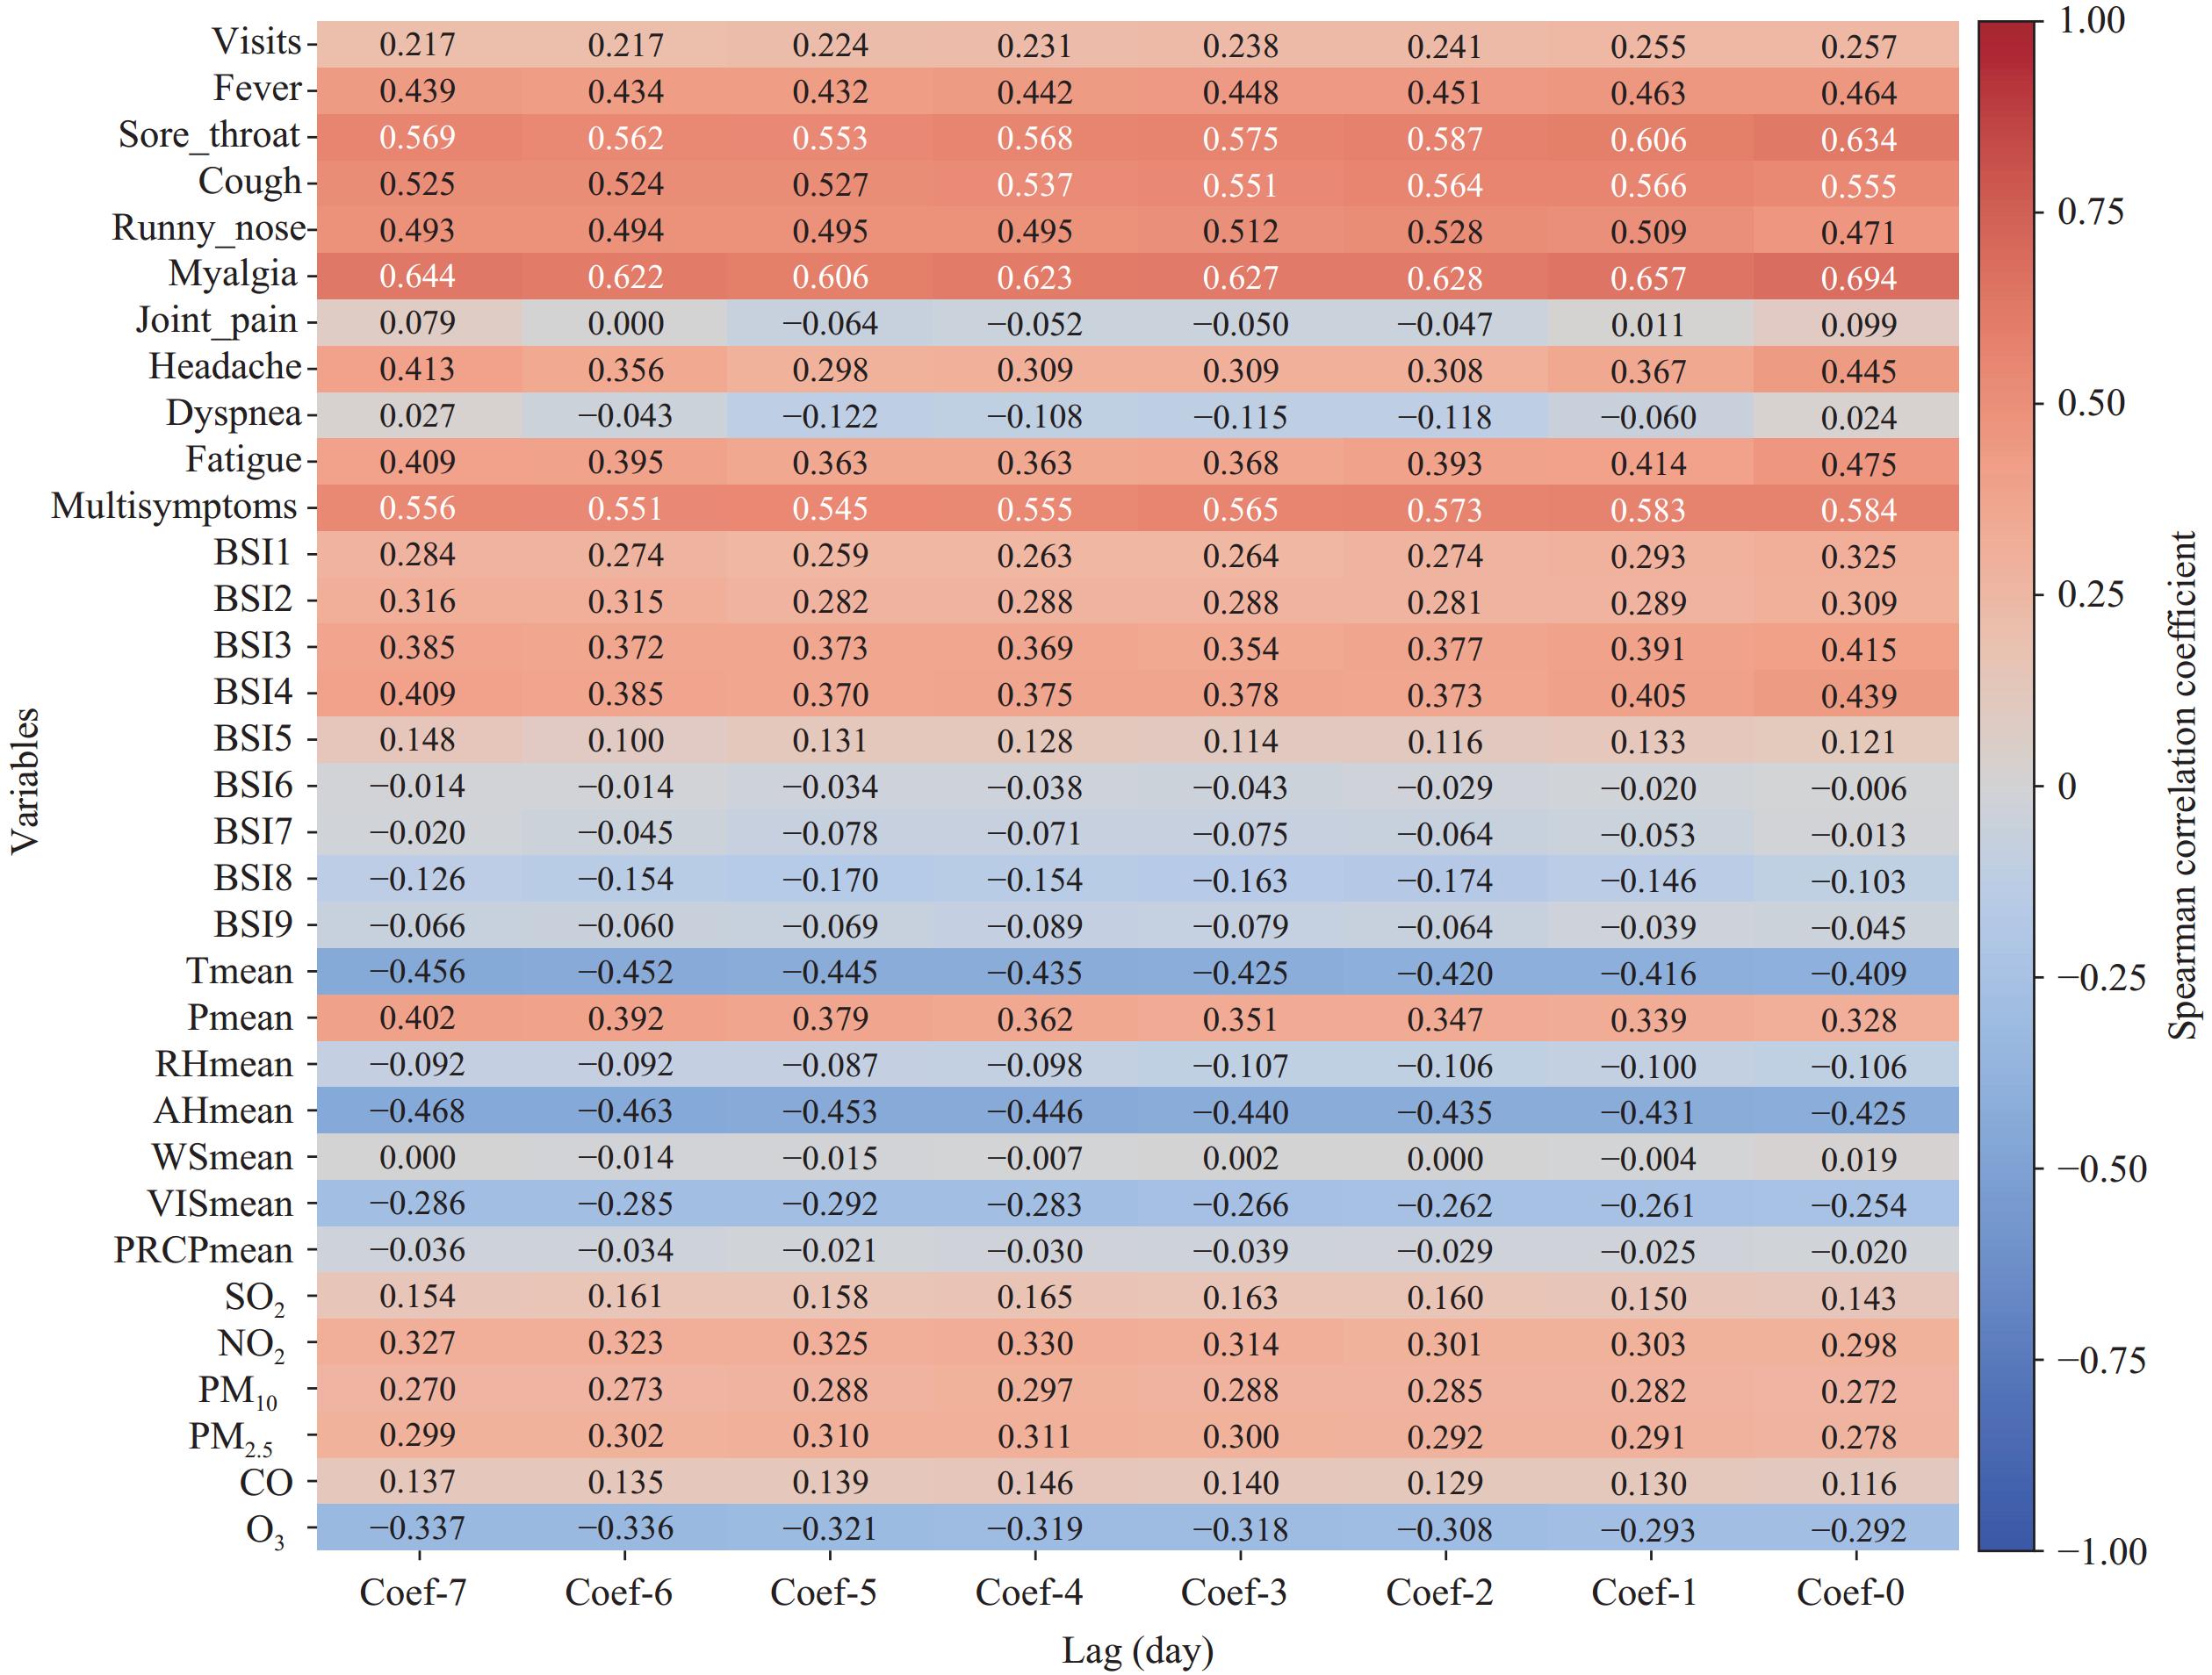 Figure 1.
Spearman correlation analysis between different surveillance systems and reported cases with a 7-day lag before.
Abbreviation: Tmean=daily mean temperature; Pmean=daily mean air pressure; RHmean=daily mean relative humidity; AHmean=daily mean absolute humidity; WSmean=daily mean wind speed; VISmean=daily mean visibility; PRCPmean=daily mean precipitation. -
Prediction models for reported influenza cases were developed using variables from four surveillance systems. For DL models, a temporal window was incorporated, and the LSTM model performed best with a 14-day window (R2=0.81, MAE=170.59, MAPE=60.26%, and RMSE=453.23) (
Supplementary Table S2 ). Prediction models were then built using various ML algorithms for predictions from 0 to 7 days ahead. The LSTM model, using variables with highest lagged correlations (5- to 7-day lag), showed strong prediction performance for 5 days forecasts (R2=0.92; MAE=156.92; MAPE=79.95%; RMSE=292.33) (Table 1).Model performance Lag (day) −7 −6 −5 −4 −3 −2 −1 0 MAE RF 337.87 338.28 341.30 334.08 312.13 300.46 288.00 242.29 XGBoost 287.21 278.68 306.39 296.40 256.80 270.32 262.13 194.60 LR 331.20 345.66 363.05 459.53 463.15 453.79 518.47 520.87 KNN 318.65 322.00 335.00 315.57 310.96 292.79 272.76 249.22 GRU 213.40 201.27 245.67 248.84 222.84 209.87 245.61 235.47 LSTM 200.40 229.21 156.92 238.00 244.77 258.08 214.40 170.59 MAPE (%) RF 123.67 126.36 133.84 134.04 129.53 127.40 124.04 118.06 XGBoost 123.83 113.94 126.43 129.99 106.45 117.50 100.04 91.91 LR 290.16 299.56 290.85 405.42 409.27 396.86 466.83 553.25 KNN 101.26 110.71 112.25 101.42 104.63 95.35 85.36 89.93 GRU 92.66 80.78 99.19 70.50 74.83 73.84 104.70 87.31 LSTM 82.45 114.17 79.95 124.37 132.32 110.60 61.55 60.26 RMSE RF 850.54 847.87 839.32 801.37 734.83 702.84 662.17 522.37 XGBoost 676.90 666.64 740.27 670.44 622.87 619.18 627.01 436.74 LR 563.26 575.52 607.19 665.98 659.59 653.02 699.16 601.48 KNN 835.86 824.83 840.50 789.46 792.10 753.85 721.15 572.74 GRU 416.80 505.86 611.00 646.34 553.33 509.26 574.51 581.57 LSTM 467.92 407.89 292.33 405.50 490.79 574.22 570.83 453.23 R2 RF 0.25 0.26 0.27 0.34 0.44 0.49 0.55 0.72 XGBoost 0.53 0.54 0.44 0.54 0.60 0.61 0.60 0.80 LR 0.67 0.66 0.62 0.54 0.55 0.56 0.50 0.63 KNN 0.28 0.30 0.27 0.36 0.35 0.41 0.46 0.66 GRU 0.84 0.76 0.65 0.61 0.71 0.76 0.69 0.68 LSTM 0.79 0.83 0.92 0.84 0.77 0.69 0.69 0.81 Abbreviation: MAE=mean absolute error; RF=Random Forest; XGBoost=eXtreme Gradient Boosting; SVM=Support Vector Machine; LR=Linear Regression; KNN=K-Nearest Neighbors; GRU=Gated Recurrent Unit; LSTM=Long Short-Term Memory; MAPE=mean absolute percentage error; RMSE=root mean square error; R2=coefficient of determination. Table 1. Comparison of different lag days of data between different models.
The prediction performances of different surveillance systems combinations were compared. The model using all variables performed the best (R2=0.92, MAE=156.92, MAPE=79.95%, and RMSE=292.33) (Figure 2). The models based on a single surveillance system performed poorly, and the best-performing model was Model H (R2=0.25, MAE=428.57, MAPE=221.61%, and RMSE=896.41). Among the two system combinations, Model H+M was best (R2=0.73, MAE=248.17, MAPE=125.64%, RMSE=533.21). For the three-system combinations, Model H+M+P (R2=0.84, MAE=201.06, MAPE=63.64%, RMSE=418.51) showed the highest prediction efficiency (Table 2).
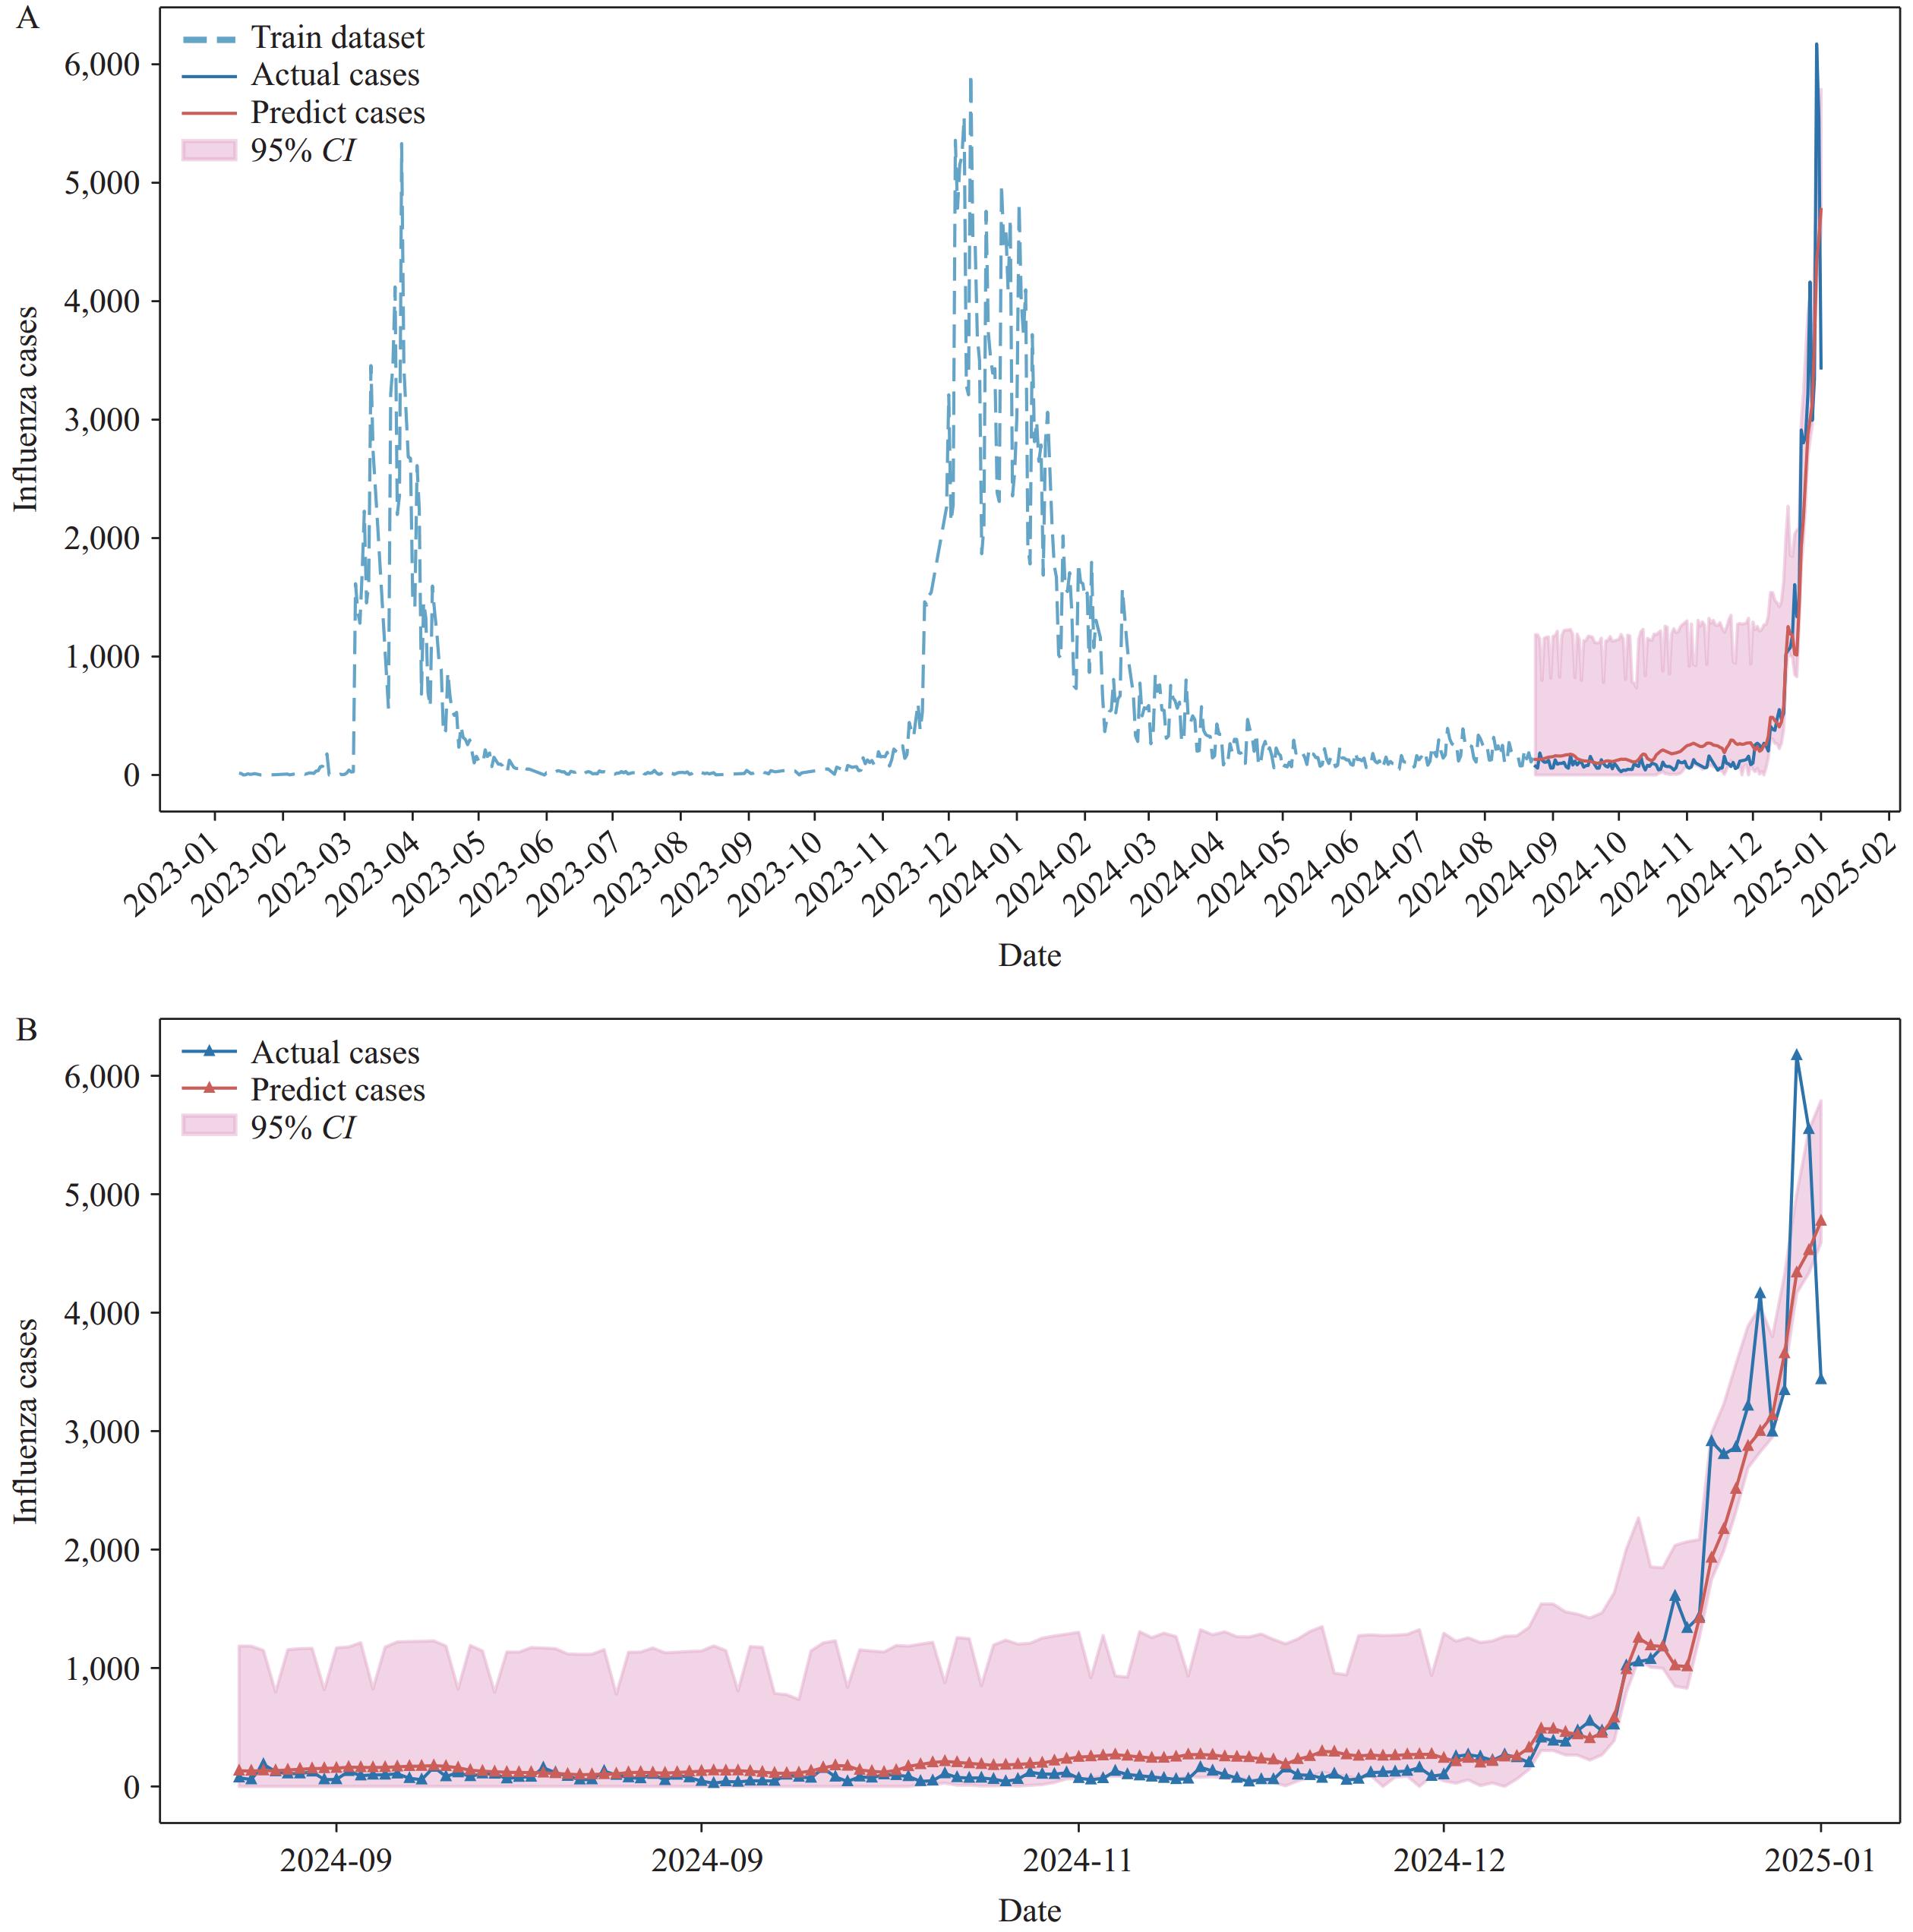 Figure 2.
Prediction diagram for the LSTM model. (A) All monitoring period; (B) Test set period.
Abbreviation: LSTM=Long Short-Term Memory; CI=confidence interval.Model performance of different combinations MAE MAPE (%) RMSE R2 Model H 428.57 221.61 896.41 0.25 Model B 414.27 141.49 971.23 0.11 Model M 456.34 159.50 946.81 0.16 Model P 435.46 131.86 1000.15 0.06 Model H+B 370.35 168.43 793.79 0.41 Model H+M 248.17 125.64 533.21 0.73 Model H+P 286.82 105.25 670.63 0.58 Model B+M 275.89 102.85 651.88 0.60 Model B+P 317.25 109.17 703.38 0.54 Model M+P 254.46 102.41 548.00 0.72 Model H+B+M 215.49 108.40 480.24 0.78 Model H+B+P 197.02 52.24 522.32 0.74 Model H+M+P 201.06 63.64 418.51 0.84 Model B+M+P 267.35 118.07 550.24 0.72 Model All 156.92 79.95 292.33 0.92 Abbreviation: MAE=mean absolute error; MAPE=mean absolute percentage error; RMSE=root mean square error; R2=coefficient of determination. Table 2. Comparison of different combinations of data.
-
Prediction models were developed to track the influenza epidemic in a southern Chinese city by integrating data from multichannel surveillance systems. The LSTM model combining all surveillance data demonstrated high prediction accuracy, with R2=0.92, MAE=156.92, MAPE=79.95%, and RMSE=292.33, outperforming other models.
Compared to existing models, our approach shows improved prediction accuracy by integrating multiple data sources. Previous studies relied mainly on single-source data, such as clinical report (7) or Google Trends (8), limited by reporting delays, definition changes, and data errors (9-10). Our models used EMRs, social media, meteorological, and air pollutant data were designed to mitigate forecasting errors. The combined model performed best, highlighting the value of diverse data in assessing influenza trends. The early phase of the influenza outbreak highlighted the inadequacy of confirmed case data for traditional surveillance (11). A multifaceted monitoring approach is essential to improve epidemic predictions.
Data quality and diversity significantly affect model performance. EMRs provide detailed clinical information. Fever clinic visits exhibited a weaker correlation (r=0.257), as fever clinic patients may have other diseases and some patient with influenza may not visit fever clinics. Symptoms like myalgia, cough, and sore throat showed stronger positive correlations with influenza cases at shorter lags, which underscore the importance of symptom-based surveillance (12). Social media data provide real-time insights into potential outbreaks, with search volumes for symptom keywords correlating with influenza cases (13). Studies indicate that combining Internet-based queries and climate data improves the accuracy and timeliness of infectious disease warning systems (14). Our findings show positive correlations between air pollutants (SO2, NO2, PM10, PM2.5, and CO) and negative correlation between O3 and influenza cases, consistent with previous studies (15–16). This highlights the importance of integrating air pollutant data for accurate influenza forecasting.
The LSTM model demonstrated improved accuracy through multisource data. Hospital surveillance enhanced prediction performance, consistent with correlation results. This approach provides understanding of environmental factors, public health interventions, and disease dynamics. Although a 5–7-day lag generally performed well, some combinations weakened due to flu’s complex spread mechanisms involving virus survival and human behavior. Environmental variables can extend virus survival time, potentially causing delays between changes and observable influenza case increases. Our multisource surveillance data integrated clinical, laboratory, and syndromic monitoring systems, with reporting delays contributing to extended lag period. Despite similarities in respiratory disease spread factors, significant heterogeneity existed. Early prediction improves response strategies, resource allocation, and outbreak management.
This study has certain limitations. The absence of population mobility and vaccination rates may restrict the capacity of the model to capture influenza transmission dynamics. Data quality from less reliable sources may affect performance, and the lack of external validation limits generalizability. Seasonal variations may lead to dispersed data patterns and higher noise levels during non-epidemic seasons. Future research should incorporate vaccination data and explore additional data sources like behavioral patterns and environmental factors. External validation and detailed data preprocessing, such as smoothing or cross-validation, could enhance generalization.
This study demonstrates that multichannel data integration improves respiratory infectious disease prediction accuracy and timeliness, with implications for public health responses. Ongoing research will refine these models for other health threats.
-
The staff members at the Center for Disease Prevention and Control and Health Information Center for data verification.
HTML
Multi-Surveillance systems

Model Construction
Model Comparison
Statistical Analysis
Description of Data from Surveillance Systems
Correlation of Surveillance Systems
Prediction Model of the Influenza Cases
| Citation: |

|