
 Download:


-
Human influenza A/H3N2 has been a predominant seasonal influenza strain globally since its emergence in 1968. The main surface proteins of the influenza virus, hemagglutinin (HA) and neuraminidase (NA), evolve antigenically to escape immune recognition by the human host (1). Vaccination is the most effective intervention against influenza, but the vaccine effectiveness (VE) against H3N2 remains low (2). This low VE is mainly attributable to the rapid antigenic drift of HA and the insufficient induction of a robust NA-mediated immune response by current vaccines (2). Several studies have highlighted the critical role of NA-induced protection (3). Compared to human influenza A/H1N1, the antigenic divergence of NA in A/H3N2 is minimal but antigenic changes still occur (4). However, the antigenic evolution and landscape of NA in human influenza A/H3N2 remain poorly understood. To address this gap, we developed an antigenic classification model for human influenza A/H3N2 NA and identified distinct antigenic clusters to provide a more systematic understanding of the antigenic evolution of NA.
-
NA sequences of human influenza A/H3N2 viruses, available up to October 2024, were downloaded from global initiative on sharing all influenza data (GISAID) (5). To mitigate sampling bias, we implemented an even sampling strategy. Seven representative sequences were randomly selected for each month and each continent; if fewer than seven sequences were available, all sequences were included. Sequences containing more than three ambiguous amino acids or fewer than 400 residues in length were excluded. Subsequently, multiple sequence alignment was conducted, and three sequences with insertion mutations present in fewer than 1% of the sampled sequences were removed. The alignment was then repeated, resulting in a final sequence length of 469 amino acid residues. Sequence alignment and phylogenetic tree construction were performed using methods described in previous studies (6). Finally, 9,054 sequences were analyzed.
A proportional sampling strategy was also implemented to avoid sampling error, selecting 5% of the sequences per month from each continent, or one sequence if the calculated sample size was less than one. After quality control, 7,847 sequences were retained for analysis.
-
A total of 376 pairs of NA inhibition (NAI) data were collected from various sources (4,7-10). For strain pairs tested in multiple experiments, the median result was used as the final value. The antigenic distance between two strains was calculated using the following formula (11):
$$ {H}_{ab}=\sqrt{\frac{{T}_{aa}{T}_{bb}}{{T}_{ab}{T}_{ba}}} $$ (1) where
$H_{ab} $ represents the NA antigenic distance between strain a and strain b,$T_{ab} $ and$T_{bb} $ are the NAI titers of serum b against virulent strains a and b, and$T_{aa} $ and$T_{ba} $ are the NAI titers of serum a against virulent strains a and b. A pair of strains was classified as antigenically similar if the absolute value of their antigenic distance was between 0.25 and 4 (not equal); otherwise, the pair was considered antigenically dissimilar. -
Twelve features were used to construct machine learning (ML) models based on NA sequences, which were categorized into four groups: epitopes, physicochemical properties, N-glycosylation, and catalytic sites.
-
We used 7U4E as a template to identify potential structural epitopes. Sites with a binding probability above 0.1, as determined by ScanNet (12), were identified as potential epitope sites. K-means clustering was performed using spatial coordinates to determine the number of epitopes and composition of each epitope based on the Silhouette score (
Supplementary Figure S1 ). Outliers that were excessively distant from other clusters were excluded, resulting in the identification of five epitopes (N2_A, N2_B, N2_C, N2_D, and N2_E,Supplementary Figure S2 andSupplementary Table S1 ). For each epitope, features were quantified by calculating the number of amino acid changes. -
Five classes of physicochemical properties were considered: hydrophobicity, charge, polarity, volume, and accessible surface area (ASA). A random forest (RF) model was trained on the training dataset to identify the best representative feature for each class. The selected indices were CHAM830107, RADA880108, CIDH920101, CHOC760102, and COHE430101. Features were computed by averaging the absolute differences between sequence pairs based on up to the three most prominent changes.
-
N-Glycosylation sites were identified using NetNGlyc (13), and the numbers of different glycosylation sites were calculated.
-
Eight previously reported NA catalytic sites were included, and the average Euclidean distances to the catalytic sites were calculated for each amino acid position, from which the three shortest distances were selected (14).
-
The antigenically similar or dissimilar label were used to train the model based on the 12-bit features calculated above. Five ML models capable of handling non-linear data were constructed using the Python package scikit-learn and evaluated: logistic regression (LR), support vector machine (SVM), K-nearest neighbors (KNN), RF, and extreme gradient boosting (XGBoost). We randomly split 70% of the NAI pairs for the training set and reserved the remaining 30% for the testing set. Model parameters were optimized using 5-fold cross-validation combined with random search conducted 500 times on the training set. The models were evaluated using five metrics: accuracy, precision, F1-score, recall, and receiver operating characteristic area under the curve (ROC-AUC).
-
The antigenic correlation network (ACNet) was constructed and visualized using Cytoscape (version 3.10.2, developed by Cytoscape Consortium, San Diego, United States). In this network, nodes represent NA strains and edges indicate antigenic similarity relationships as predicted by the model. The Markov cluster algorithm was used to identify clusters of strains based on the logarithmic ratio of the probabilities of antigenic similarity to dissimilarity. Clustering parameters were selected by optimizing mean cluster sizes and modularity (
Supplementary Figure S3 ). -
Five ML models were constructed using cross-validation (
Supplementary Figure S4 ) and evaluated using the testing set (Figure 1A). The RF model outperformed all other models across all metrics, achieving the highest ROC-AUC value of 0.849 and the highest accuracy of 0.867 on the test set. Therefore, the RF model was selected for subsequent analyses. Analysis of feature contributions revealed varying importance among different features (Figure 1B and C). Physicochemical properties contributed the most (39.1%), followed by epitopes (32.7%), catalytic sites (21.7%), and N-glycosylation sites (6.5%). The catalytic sites feature had the greatest individual impact, contributing approximately 21.7%. Among epitope-related features, Epitopes N2_D, N2_B, and N2_C, which are located near catalytic sites (Supplementary Figure S2 ), were identified as the most significant, indicating their critical role in both viral function and prediction (Figure 1C). The epitope located at the junction of different chains (N2_A) was less important, contributing only 1% to the overall feature importance. Figure 1.
Model performance and feature contributions. (A) Model performance on the independent testing set; (B) Feature contributions at the sample level, where color indicates the magnitude and position reflects the absolute contribution of each feature; (C) Feature contributions at the population level.
Note: Different groups were color-coded, and size represents the magnitude of individual features. Abbreviation: RF=random forest; XGBoost=extreme gradient boosting; KNN=K-nearest neighbors; LR=logistic regression; SVM=support vector machine; AUC=receiver operating characteristic area under the curve; ASA=access surface area; SHAP=SHapley Additive exPlanation. -
Based on the RF model, we predicted antigenic relationships between all representative strains for NA of human influenza A/H3N2 and constructed an ACNet for evenly sampled sequences. We identified eight major antigenic clusters that aligned with the traditional phylogenetic tree (Figure 2A). These clusters, which included vaccine strains, were named after the earliest vaccine strain within each cluster: PC73, TE77, BJ89, WH95, MS99, CA04, PE09, and SI16 (
Supplementary Table S2 ). We validated the clustering by demonstrating that strains within the same cluster were more antigenically similar than those from different clusters (Supplementary Figure S5 ). A clear spatiotemporal pattern emerged: new clusters appeared and gradually replaced older ones, a trend observed consistently across different continents (Figure 2B andSupplementary Figure S6 ). Furthermore, NA antigenic clusters exhibited greater persistence over time (approximately 8 years) compared with HA (approximately 2 or 3 years) (Figure 2C) (15). The clustering and prevalence analyses from proportional sampling were largely consistent with these findings (Supplementary Figure S7 ).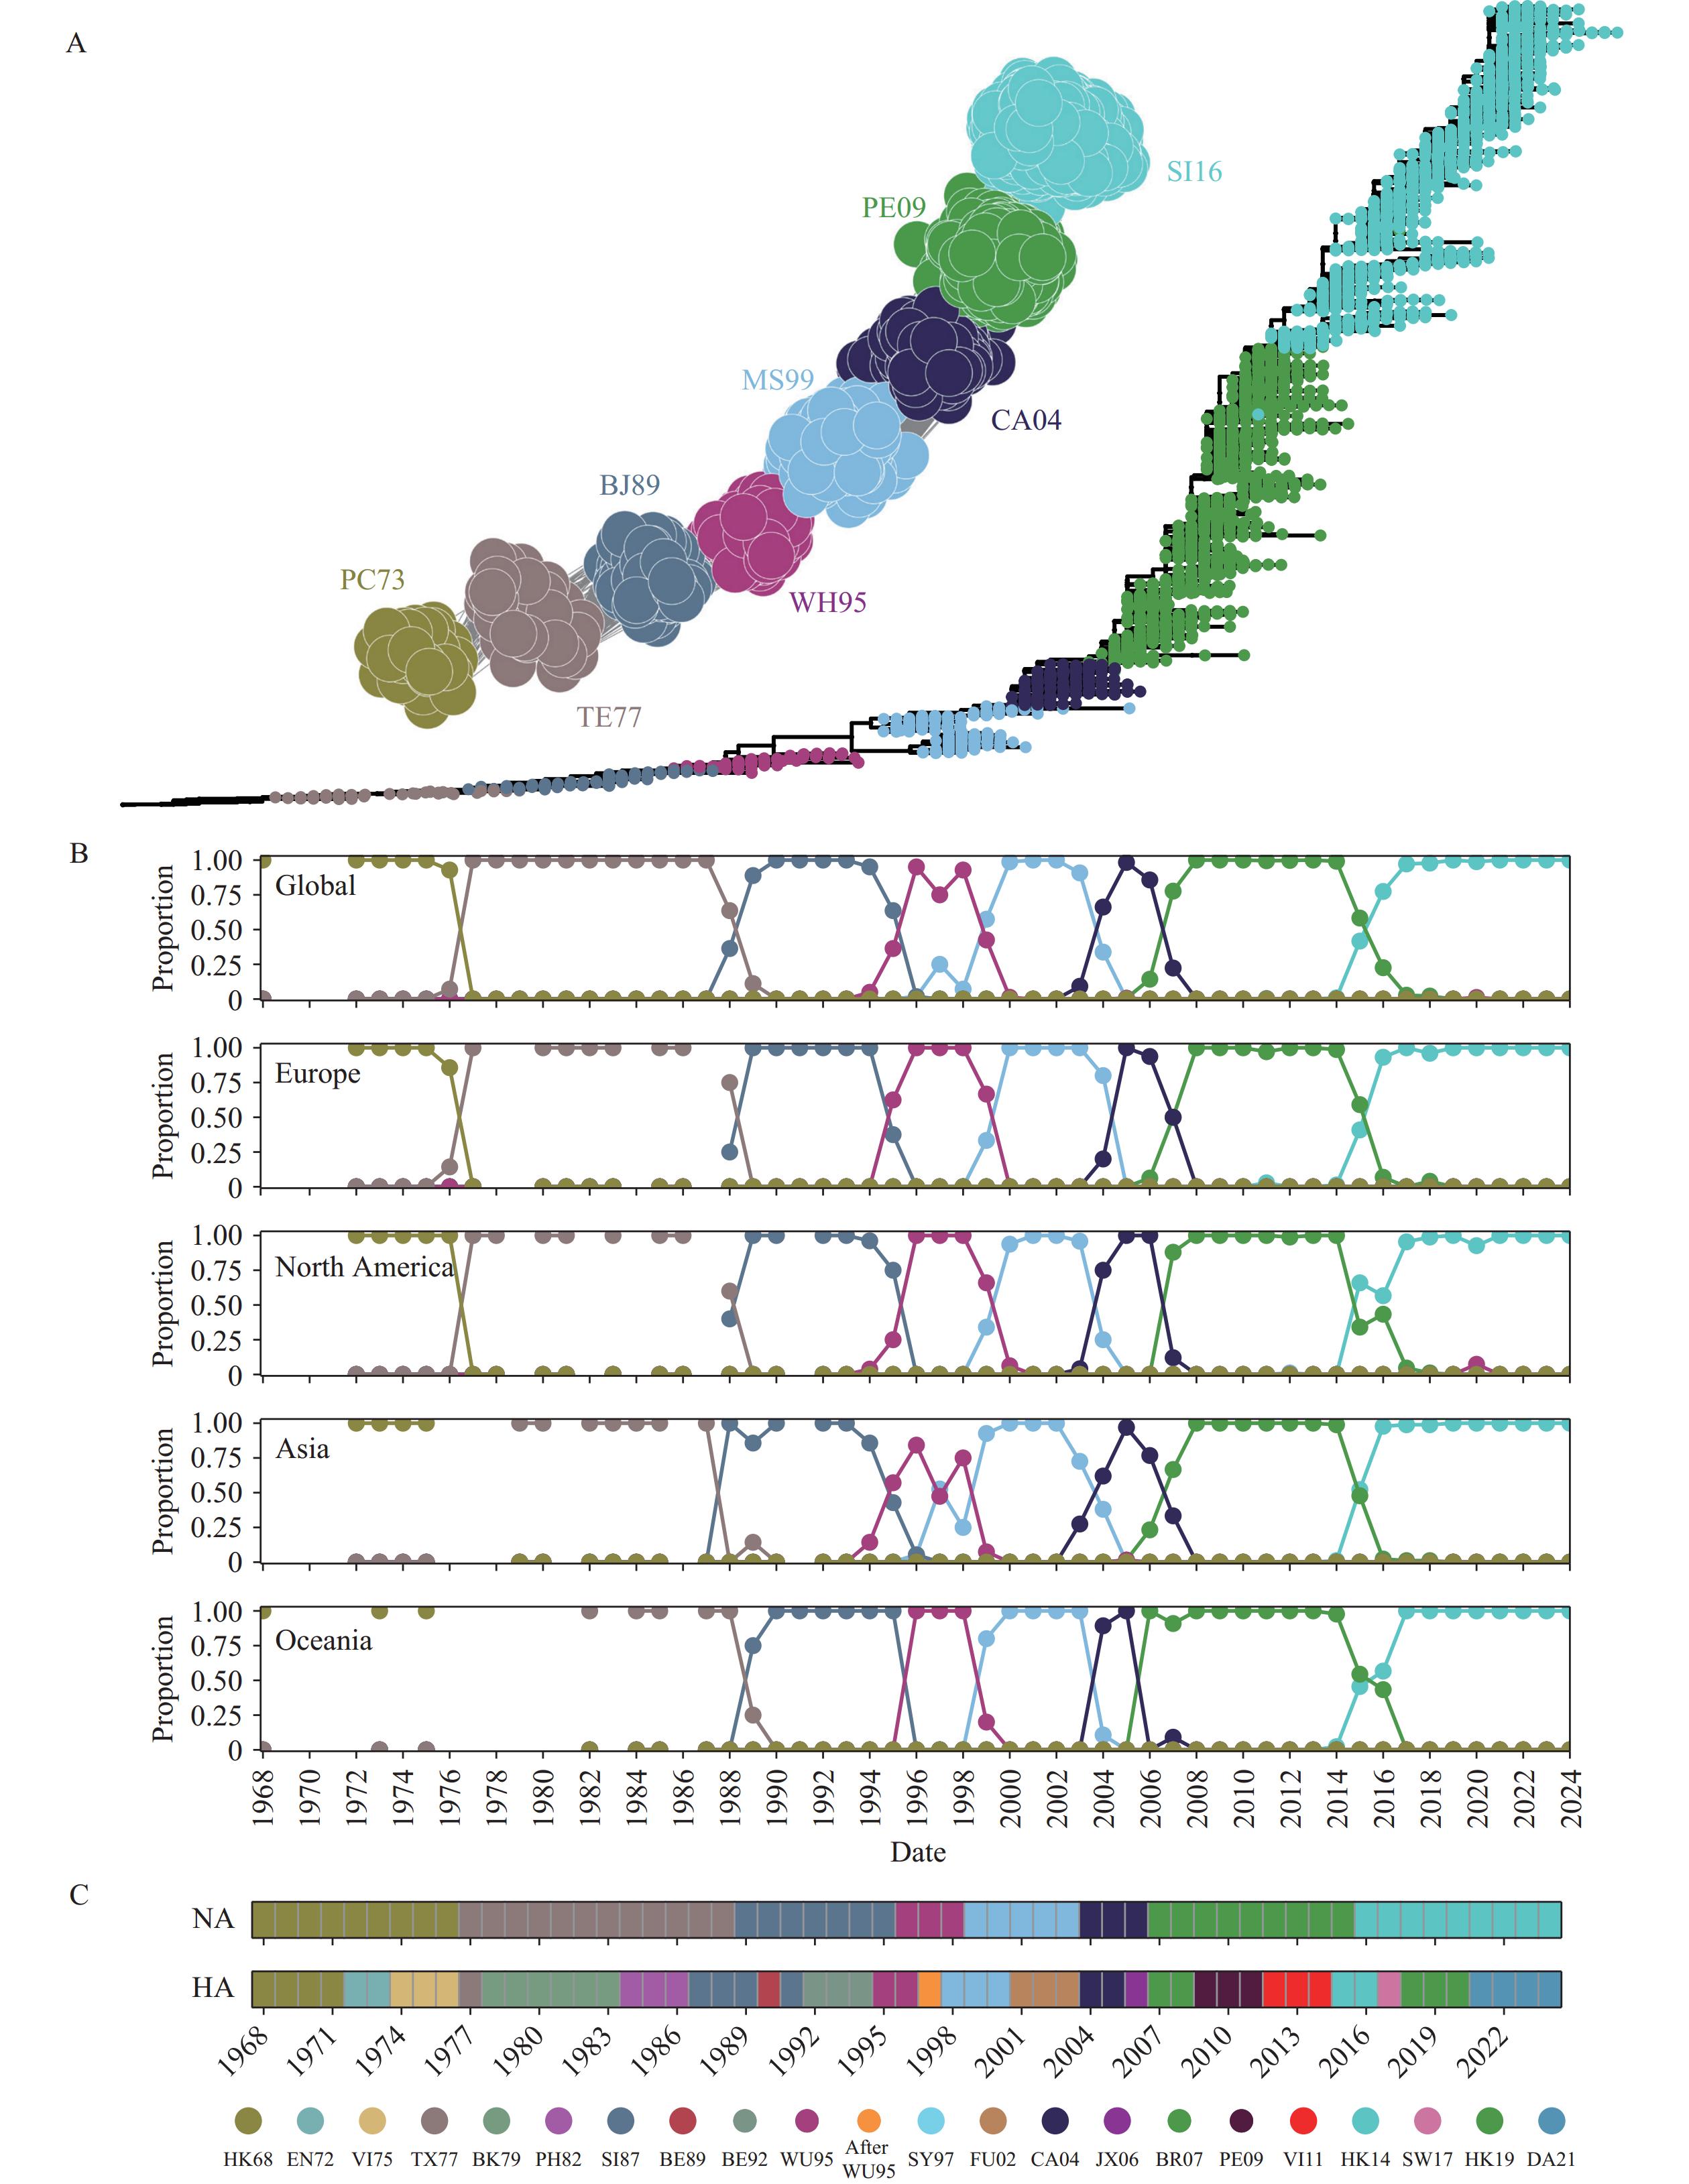 Figure 2.
Antigenic landscape of A/H3N2 NA. (A) The ACNet and phylogenetic tree for representative sequences from eight major antigenic clusters; (B) Yearly spatiotemporal distribution of eight antigenic clusters; (C) Replacement patterns of dominant antigenic clusters.
Note: The legend displays colors for HA while the color of NA antigenic clusters correspond to those used in the ACNet. For (C), color changes indicating that a new antigenic cluster is dominant or becoming dominant.
Abbreviation: NA=neuraminidase; HA=hemagglutinin; ACNet=antigenic correlation network.
-
In the present study, we developed a novel machine learning model for timely and effective prediction of antigenic relationships in the neuraminidase of human influenza A/H3N2. We identified eight main antigenic clusters between 1968 and 2024. Spatiotemporal analysis revealed continuous global replacement and rapid spread of new antigenic clusters. Our findings were robust across different sampling approaches. Among forty-eight vaccine strains, only one (A/Wellington/01/2004) during the cluster transition period was classified differently, likely due to significant differences in sequence distribution.
The antigenic prediction model for NA was developed using an approach similar to that for HA. A key adjustment was replacing the receptor-binding features of HA with catalytic sites, which are more pertinent to NA function. Additionally, we identified NA epitopes de novo for feature calculation. While these adjustments did not represent significant innovations, the framework has proven effective with only minor modifications across different contexts (16). This suggests that with appropriate adjustments, our model can provide accurate predictions for NA antigenic correlations.
Both antigenic clusters and phylogenetic clades reflect evolutionary relationships between viral strains, representing phenotype and genotype, respectively. Unlike the continuous branching of phylogeny, antigenic clusters represent important discrete phenotypes for HA and NA, with nonlinear relationships to genetic changes (4). Variations at different sites have inconsistent effects on antigenicity. The phylogenetic tree for NA displayed a single-trunk structure, indicating minimal selection pressure. Furthermore, spatiotemporal analysis confirmed the continuous global replacement of older antigenic clusters by newer ones. Only eight major antigenic clusters were identified for NA over the past 60 years (approximately one cluster every 8 years), significantly fewer than for HA (approximately every 2 or 3 years). This phenomenon might be explained by the relatively lower mean rate of nucleotide substitution in NA, which could be partly attributed to stronger structural constraints on this enzyme compared to the receptor-binding protein, as well as the stronger selection pressure and greater immune pressure on HA, likely due to its role as the primary vaccine target and its higher distribution on the virus surface (17–18).
This study has several limitations that warrant consideration. First, while our dataset was sufficient for model development, a larger dataset would enable the construction of more sophisticated models with improved prediction performance. Second, although we developed the first ML antigenic classification model for NA, integration with HA and other important viral components is necessary for a comprehensive understanding of antigenic evolution and its implications for seasonal influenza. Third, due to variations in sequencing coverage, some regions had insufficient sequence data, leading to incomplete characterization of their antigenic landscapes. Similarly, the analysis of early antigenic clusters may be subject to sequencing bias. Finally, while our model demonstrated high predictive accuracy, validation with experimental data or real-world outcomes would further strengthen its applicability.
The findings of this study highlight the crucial role of NA in the antigenic evolution of human influenza A/H3N2 and its contribution to viral circulation and spread. Although NA currently receives less consideration in vaccine strain recommendation and antigenic surveillance, the tools developed in this study can facilitate improved antigenic monitoring, inform vaccine selection, and ultimately aid in the prevention and control of influenza epidemics as knowledge deepens and relevant technologies advance.
-
We gratefully acknowledge all the authors from the original laboratories who submitted and shared data on which this study is based. This work was supported by the BrightWing High-performance Computing Platform, School of Public Health (Shenzhen), and High-performance Computing Public Platform (Shenzhen Campus), Sun Yat-sen University.
HTML
Sequence Data
NAI Data


Feature Selection
Epitopes
Physicochemical Properties
N-Glycosylation sites (N-Glycosylation)
Catalytic sites (Catalyze)
Model Construction
Construction of Antigenic Network
Antigenic Prediction Model for NA of Human Influenza A/H3N2
The Antigenic Landscape for NA of Human Influenza A/H3N2
| Citation: |

|