


 Download:


-
Seasonal influenza remains a significant global public health threat, with the World Health Organization (WHO) estimating 3 to 5 million severe cases and 290,000 to 650,000 deaths annually (1). The predominant circulating strains — influenza A virus subtype H1N1 [A(H1N1)], A(H3N2), and B(Victoria) — undergo antigenic drift due to amino acid substitutions in the hemagglutinin (HA) protein. These molecular changes enable the virus to evade host immunity, resulting in seasonal outbreaks (2-3). Traditional serologic assays, such as hemagglutination inhibition (HI), are employed to monitor antigenic changes but are labor-intensive, costly, and require live virus isolation (4). Consequently, a sequence-based strategy to predict antigenic variants would represent a more efficient alternative (5).
Several machine learning models have been developed for HA sequence-based antigenicity prediction, including support vector machines (SVM), multi-task learning sparse group lasso (MTL-SGL), iterative filtering models, and ridge regression. These approaches demonstrate robust performance in high-dimensional data classification, integrating multiple features with numerical weighting (6-8). However, these models exhibit limitations in handling dynamic data and nonlinear relationships, rendering predictions susceptible to noise, missing values, and feature correlation.
In this article, we introduce a matching pursuit model based on adaptive Fourier decomposition (AFD) theory for predicting influenza antigenic variation, using H1N1 as an exemplar. Inspired by (9) and (10), our model offers three distinct advantages: Adaptivity and efficiency via an AFD maximum selection that mitigates overfitting on small datasets; Nonlinearity and interpretability through capturing epistatic effects between amino acid changes and spatial positions; Robustness via feature screening, bootstrapping, and orthogonal projection for dual-site interactions.
-
This section develops a quantitative model to predict antigenic distances from HA protein sequences. We denote A as the independent features and Y as the target variable. Details on the matching pursuit model and prediction procedure are provided in the
Supplementary Material .In this section, we outline the specific steps of the model algorithm, which are divided into two main phases: training and predicting, which are shown in Table 1 and Table 2, respectively.
Step Process Input sequence data Aq×p=(a1,...,aq) and antigenic data Yq×1 Output the parameter set X, the index set I and the result Ỹq×1 0 Initialize ε>0, j=1 bk ← ak/||ak||, k = 1,$ \cdots $,p I1 ← argmaxk |<Y,bk>|2 $ \stackrel{~}{b} $1 ← aI1 / ||aI1|| x1 ← <Y,$ \stackrel{~}{b} $1> Ỹ ← <Y,$ \stackrel{~}{b} $1>$ \stackrel{~}{b} $1 energy ← |x1|2 1 While energy≥ε && j<p do 2 j ← j + 1 3 bk ← $ {Q}_{\stackrel{~}{b}\mathrm{j}-1} $(bk)/||$ {Q}_{\stackrel{~}{b}\mathrm{j}-1} $(bk)||, k = 1,$ \cdots $,p 4 Ij ← argmaxk |<Y,bk>|2 5 $ \stackrel{~}{b} $j ← bIj 6 xj ← <Y,$ \stackrel{~}{b} $j> 7 Ỹ ← Ỹ + <Y,$ \stackrel{~}{b} $j>$ \stackrel{~}{b} $j 8 energy ← |xj|2 9 End while Table 1. Matching pursuit algorithm — training model.
Step Process Input X, I, W, and new sequence data, denoted by Aq1×p Output prediction result, denoted by Ỹq1×1 0 extract and rearrange a subset of Aq1×p according to I; then obtain Ã1with size q1× pε 1 compute $ \stackrel{~}{W} $ = W $ \stackrel{~}{A} $ᵗ 2 compute Ỹq1×1= Ã$ \stackrel{~}{W} $ Table 2. Matching pursuit algorithm — predicting model.
Assuming the execution of the above algorithm stops at step
$ j=p_{\mathrm{\epsilon}}\left(\le p\right) $ , and we obtain the parameter set$ X=({x}_{1},\cdots ,{a}_{{I}_{{p}_{\mathrm{\epsilon }}}}) $ for the training model and the index set$ I=({I}_{1},\cdots ,{I}_{{p}_{\mathrm{\epsilon }}}) $ . Let$ \stackrel{~}{B}=({\stackrel{~}{b}}_{1},\cdots ,{\stackrel{~}{b}}_{{p}_{\mathrm{\epsilon }}}) $ represent the orthonormal matrix, and$ \stackrel{~}{A}=({a}_{{I}_{1}},\cdots ,{a}_{{I}_{{p}_{\mathrm{\epsilon }}}}) $ represent the rearranged matrix of A according to I. We can compute$ {W}_{{p}_{\mathrm{\epsilon }}\times {p}_{\mathrm{\epsilon }}} $ using$ \stackrel{~}{B}=\stackrel{~}{A}W $ , which gives us the parameter set$ \stackrel{~}{W}={W\stackrel{~}{X}}^{t} $ for prediction model. The subsequent algorithm will help us derive the parameter set for the prediction model and present the prediction results.Both algorithms generate sequence data through feature expansion, which can lead to a high-dimensional space and increased overfitting risk — especially when higher-order terms are included. However, our model mitigates this via a maximum selection principle and by applying expansion to both training and testing sets. To balance enhanced prediction accuracy with the increased computational cost of higher dimensions, we randomly select a small subset of features, choose an appropriate expansion degree (e.g., 2nd or 3rd), and then perform random feature sampling with replacement. The final prediction is obtained by averaging across all iterations, leveraging ensemble methods similar to those used in random forests.
-
The dataset description is provided in the Supplementary Materials. In this section, we first present the model’s training and prediction results, followed by an evaluation using multiple performance metrics. We then discuss the reliability of key sites identified by the model, particularly in the context of antigenic variation. We employ two primary evaluation metrics to assess model effectiveness: root mean square error (RMSE) and F1-score, defined as follows.
$$ RMSE=\sqrt{\frac{1}{n}\sum _{i=1}^{n}{({Y}_{i}-{\widetilde { Y}}_{i})}^{2}} $$ where
$ Y $ represents the true value and$ {\widetilde { Y}} $ represents the predicted resultFor each analytical task, we employ Algorithm 1 for training and Algorithm 2 for prediction. We benchmark our approach against five classical methods: Random Forest (RF), Support Vector Regression (SVR), Lasso, Gradient Boosting (GB), and Elastic Net (EN). Our proposed model is Matching Pursuit Method (MP).
-
We established epsilon values of 0.1, 0.01, 0.01, 0.001, and 0.01, with bootstrap samples of 30, 5, 5, 2, and 15 across the five tasks, respectively. Each task incorporated 70, 80, 70, 80, and 80 observations drawn with replacement from the original dataset. Subsequently, we calculated the mean for each of these samples. From a theoretical perspective, as the number of selected observations decreases, the number of bootstrap samples should increase proportionally. The evaluation metrics for the training model are presented in Table 3.
Methods Task 1 Task 2 Task 3 Task 4 Task 5 RMSE F1-score RMSE F1-score RMSE F1-score RMSE F1-score RMSE F1-score RF 0.624 0.730 0.380 0.899 0.453 0.909 0.326 0.984 0.366 0.816 SVR 0.203 0.955 0.343 0.956 0.506 0.890 0.323 0.968 0.335 0.883 Lasso 1.317 0.543 1.322 0.867 1.635 0.113 0.905 0.878 1.340 0.520 GBR 0.763 0.730 0.708 0.867 0.790 0.808 0.561 0.878 0.433 0.768 ENG 0.519 0.909 0.597 0.932 0.627 0.863 0.371 0.984 0.341 0.816 MP 0.149 0.978 0.296 0.963 0.312 0.939 0.195 1.000 0.261 0.930 Note: The bolded values highlight the best performance scores across different models for each H1N1 prediction task.
Abbreviation: RF=random forest; SVR=support vector regression; GBR=gradient boosting regression; ENG=elastic net; MP=matching pursuit method; RMSE=root mean square error.Table 3. Comparison of training performance between classical models and AFD-based predictive methods on five H1N1 prediction tasks.
The five tasks above demonstrate that our method performs robustly across these datasets. The approach proves effective both in capturing positive events, such as site variations, and in optimizing the balance between accuracy and recall rate.
Figure 1 displays the MP model’s training results for antigenic distance prediction, where blue dots closer to the red line indicate superior performance. We subsequently applied Kernel Density Estimation (KDE) with a bandwidth of 0.5 to generate smooth density curves for both predicted and actual data. The substantial overlap between these curves reveals similar distributions and minimal bias. As illustrated in Figure 2, this alignment across datasets confirms the model’s strong generalization capabilities, consistency, and robustness.
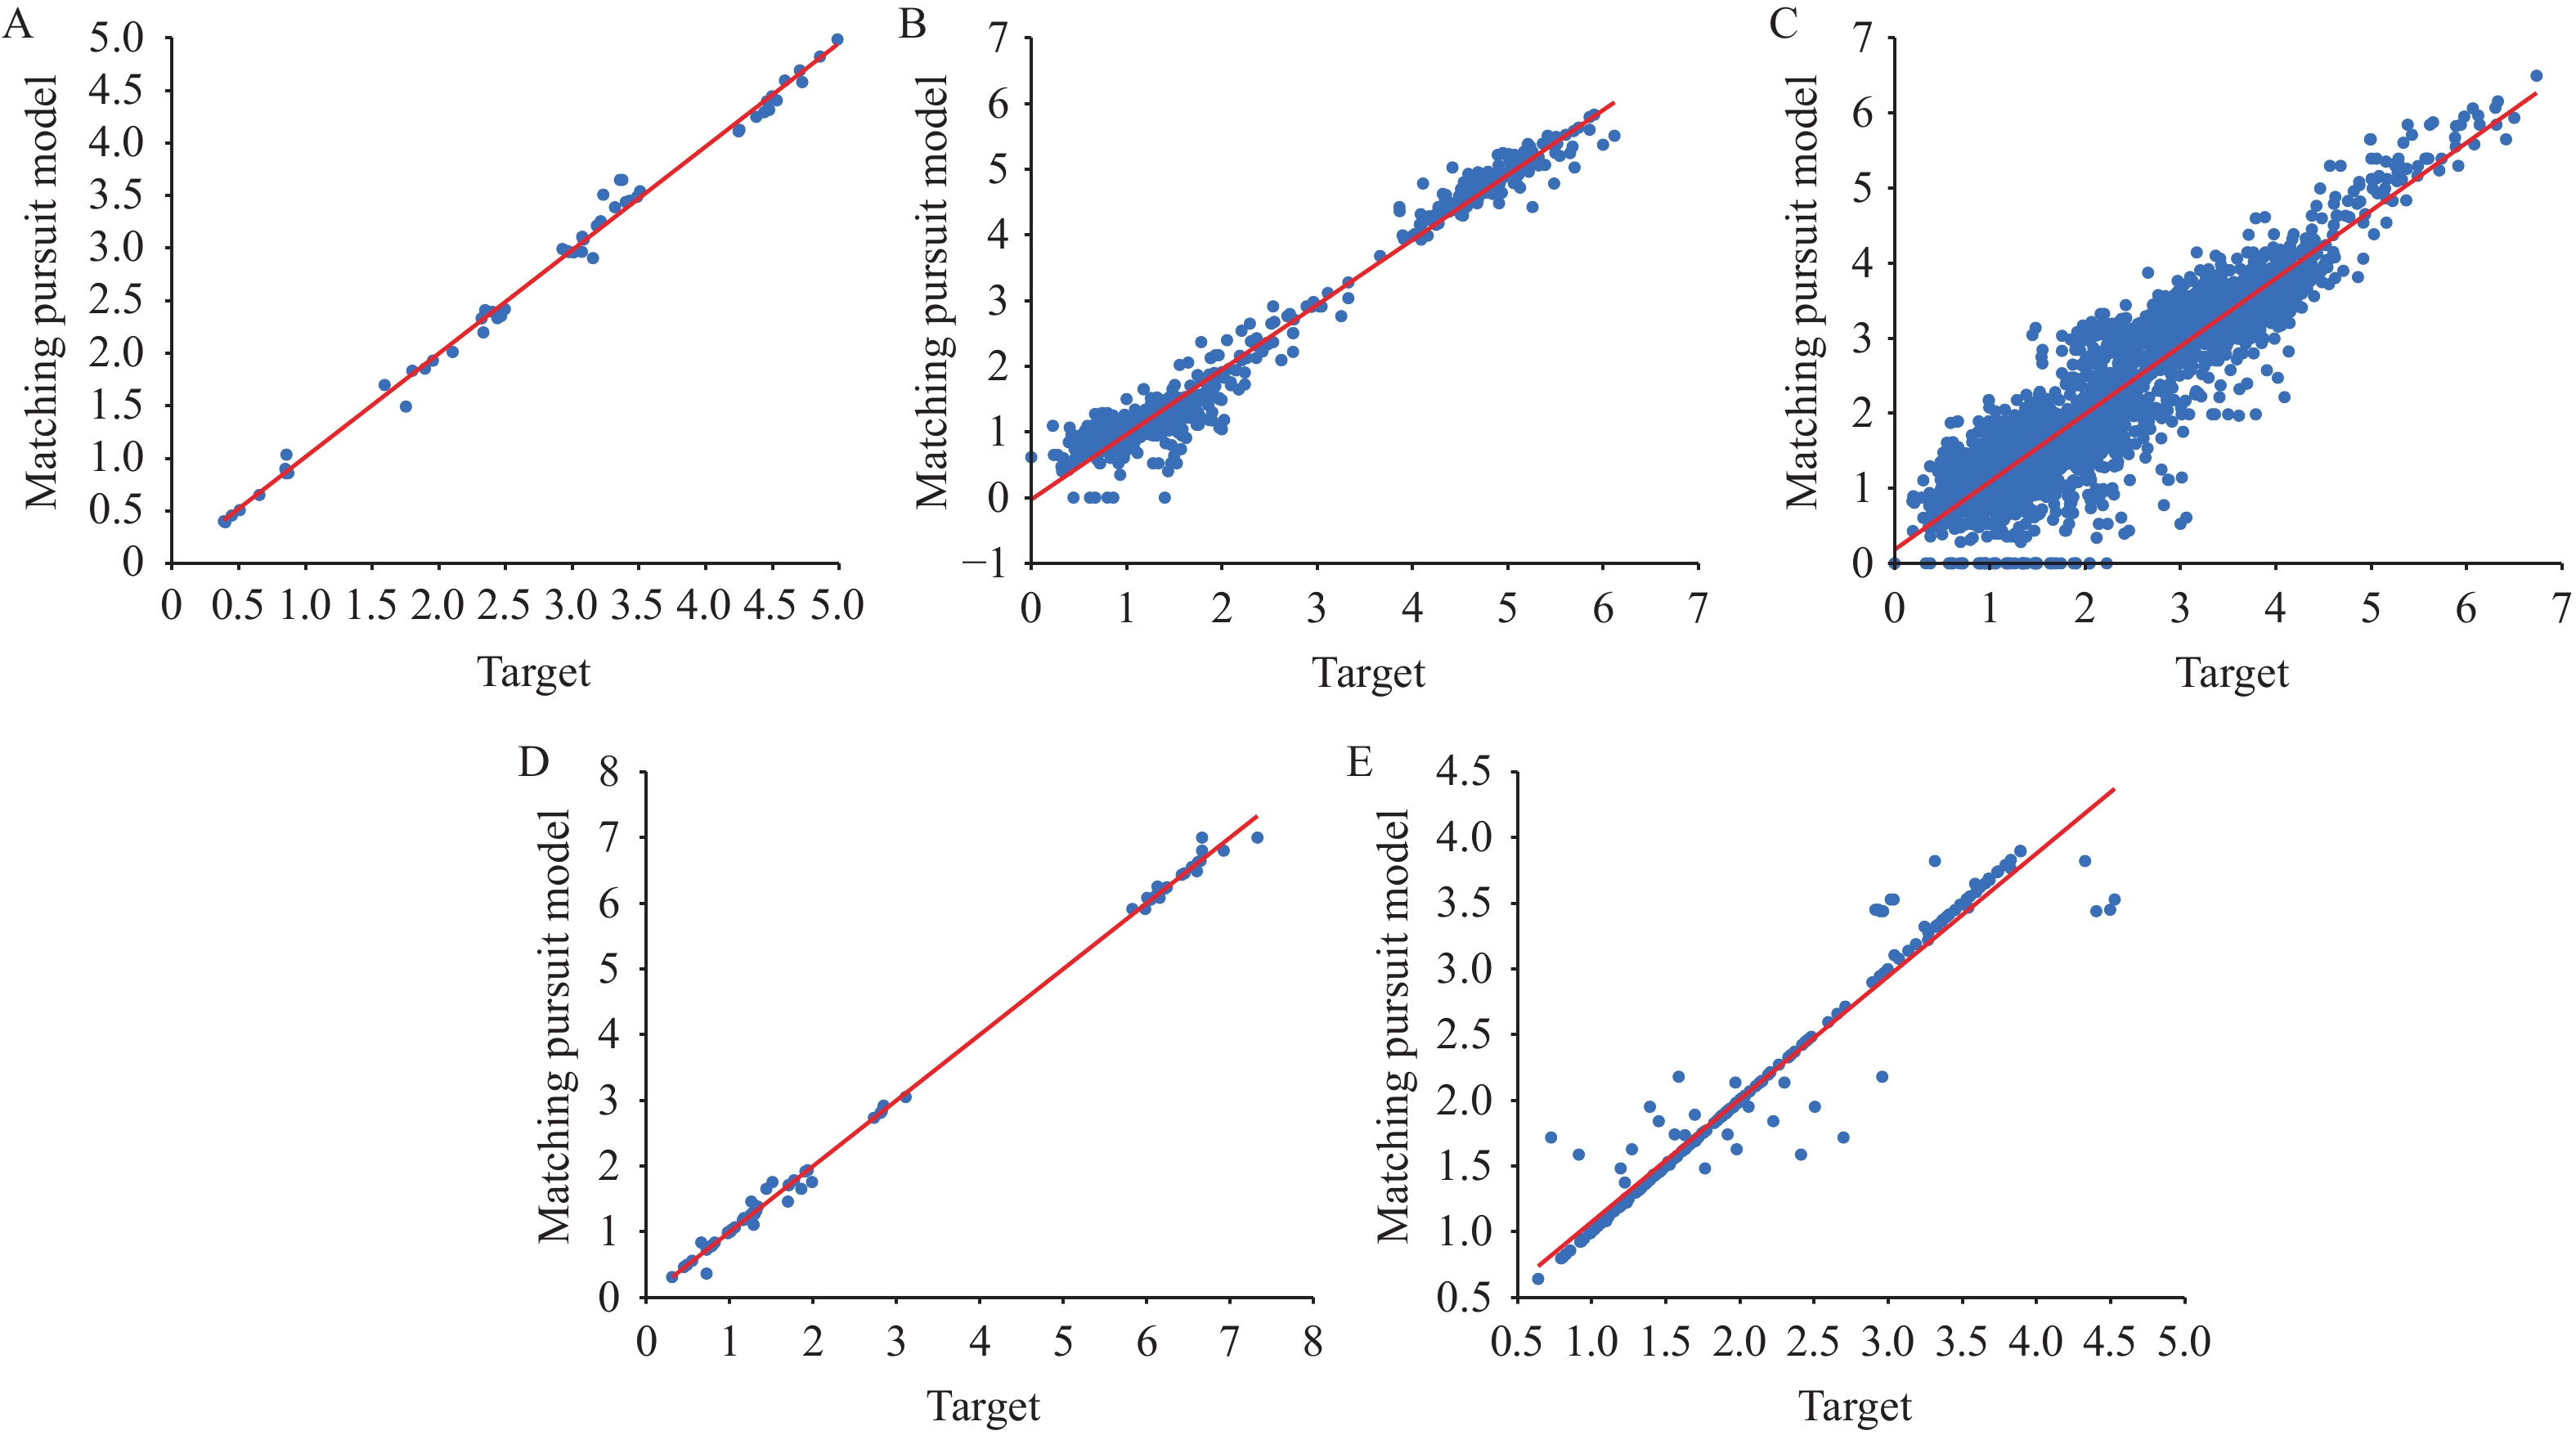 Figure 1.
Training results of the MP model for antigenic distance prediction across (A–E) Tasks 1–5.
Note: The X-axis represents the ground truth antigenic distance, and the Y-axis shows the predicted values. The red diagonal line is the correlation line.
Abbreviation: MP=matching pursuit method.
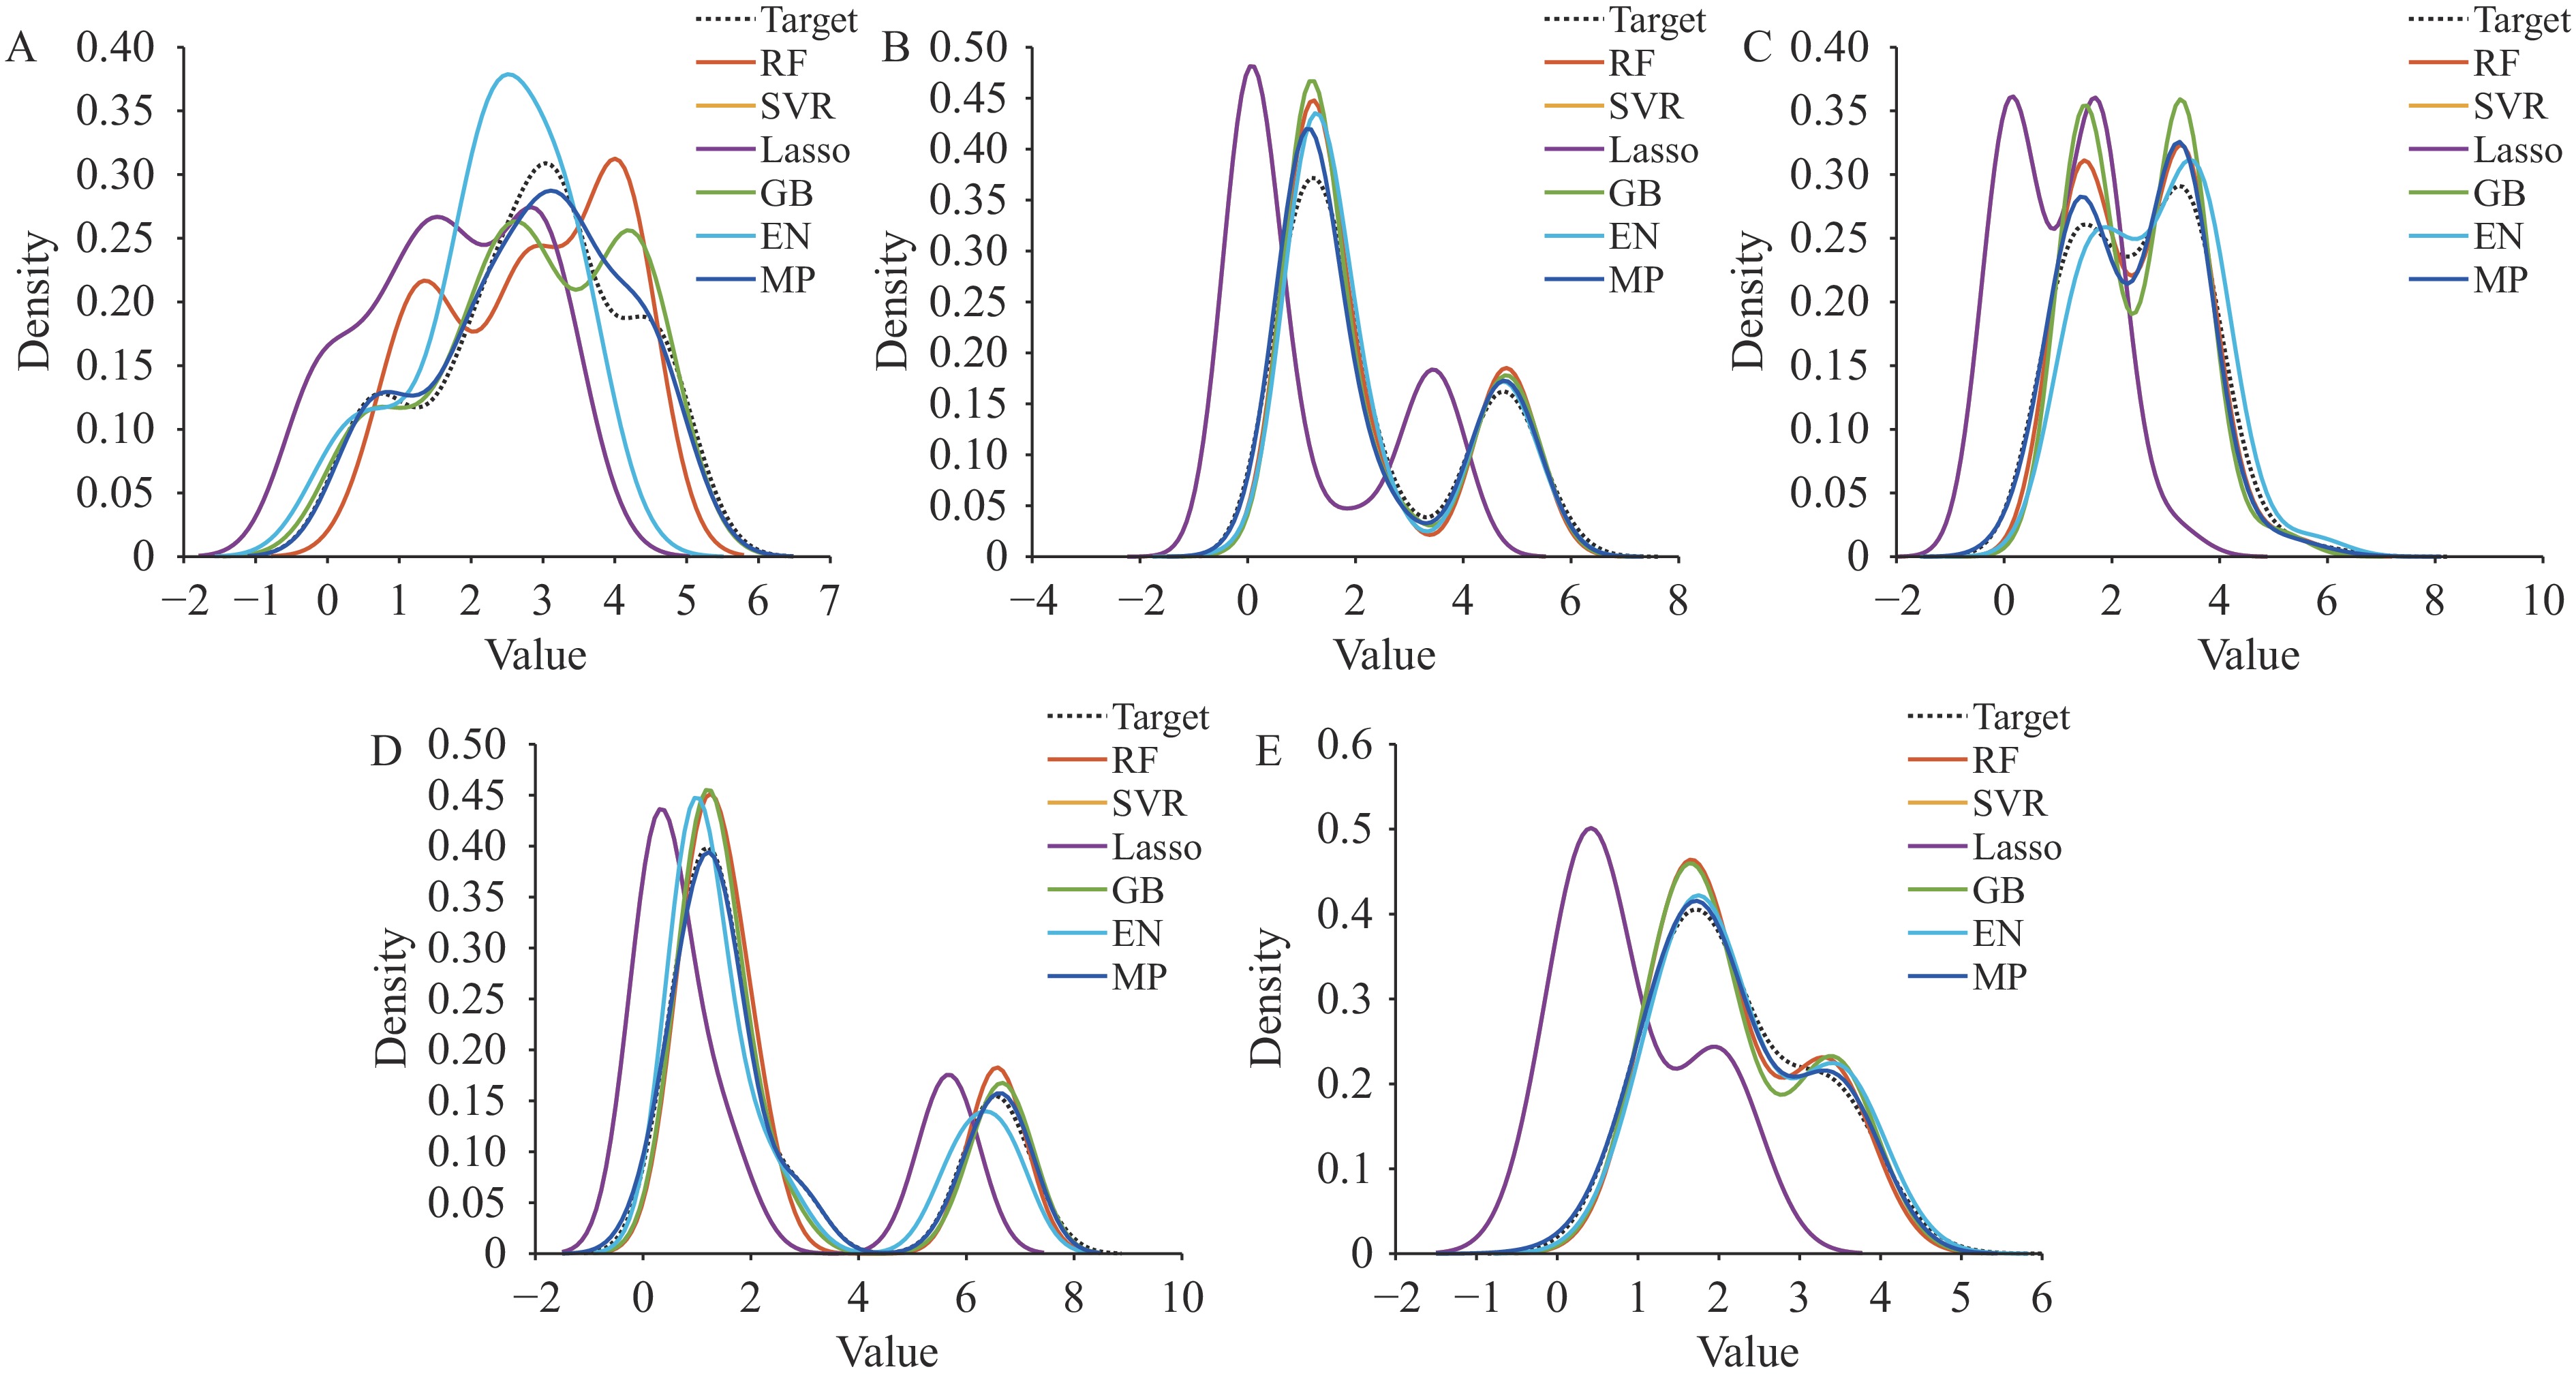 Figure 2.
Training results of the classical and MP model represented through Kernel Density Estimation (KDE) distributions of predicted and actual antigenic distance values across (A–E) Task 1–5.
Note: The X-axis denotes the antigenic distance, and the Y-axis indicates the density. Each line corresponds to a different model.
Abbreviation: MP=matching pursuit method.
The evaluation metrics for the prediction model are presented in Table 4.
Methods Task 1 Task 2 Task 3 Task 4 Task 5 RMSE F1-score RMSE F1-score RMSE F1-score RMSE F1-score RMSE F1-score RF 0.678 0.942 0.573 0.891 0.523 0.905 0.405 0.941 0.556 0.817 SVR 1.065 0.821 0.757 0.913 0.570 0.889 0.799 0.898 0.526 0.871 Lasso 1.315 0.517 1.301 0.891 1.617 0.111 1.334 0.806 1.414 0.164 GBR 0.942 0.826 0.747 0.891 0.786 0.827 1.582 0.570 0.661 0.796 ENG 0.653 0.921 0.780 0.927 0.610 0.877 0.456 0.962 0.546 0.844 MP 0.582 0.942 0.478 0.944 0.513 0.914 0.403 0.941 0.416 0.915 Note: The bolded values highlight the best performance scores across different models for each H1N1 prediction task.
Abbreviation: RF=random forest; SVR=support vector regression; GBR=gradient boosting regression; ENG=elastic net; MP=matching pursuit method; RMSE=root mean square error.Table 4. Comparison of predicting performance between classical models and AFD-based predictive methods on five H1N1 prediction tasks.
The prediction results across the five tasks above reveal that, while our model demonstrates strong performance during training, the prediction outcomes still present opportunities for improvement. Despite systematic efforts to optimize parameters and refine the input dataset during model development, certain aspects remain suboptimal. Nevertheless, these numerical results provide valuable reference points for subsequent research endeavors.
Figure 3 illustrates the prediction results for antigenic distance using the MP model. The proximity of blue dots to the red line indicates prediction accuracy. Figure 4 displays the KDE results for all six methods, demonstrating that our approach yields superior testing outcomes. The degree of overlap with the target curve directly corresponds to prediction performance quality.
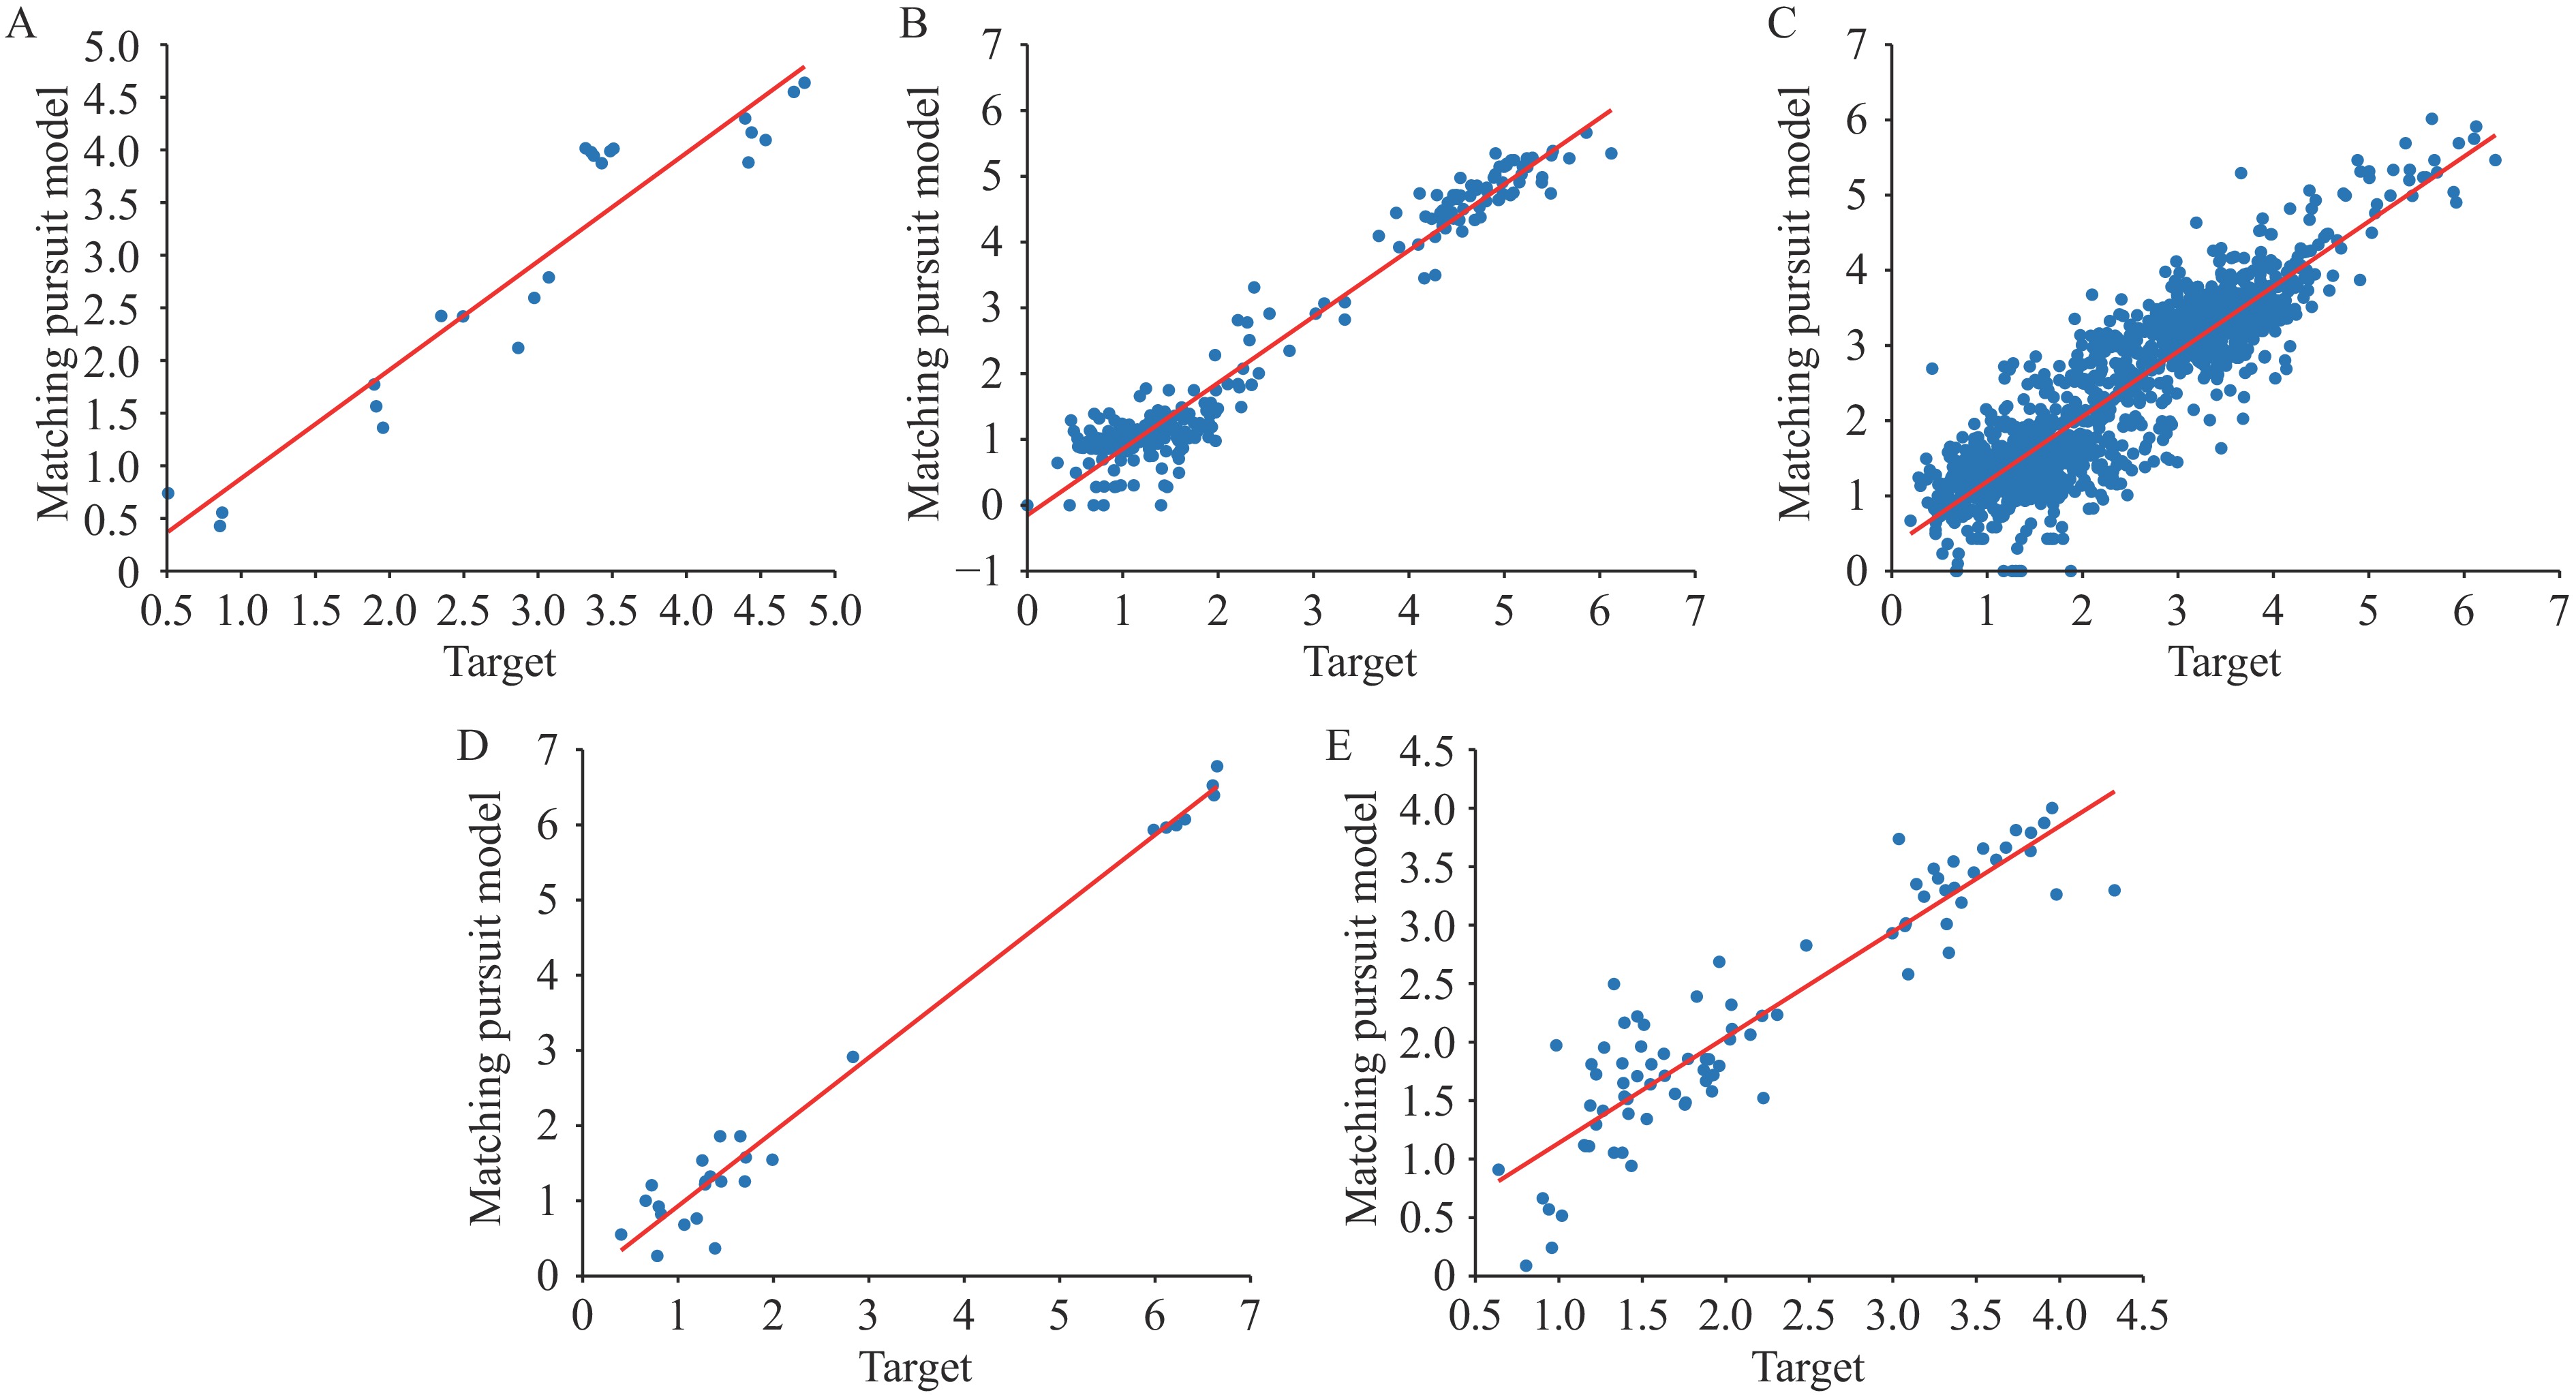 Figure 3.
Predicting results of the MP model for antigenic distance prediction across (A–E) Task 1–5.
Note: The X-axis represents the ground truth antigenic distance, and the Y-axis shows the predicted values. The red diagonal line is the correlation line.
Abbreviation: MP=matching pursuit method.
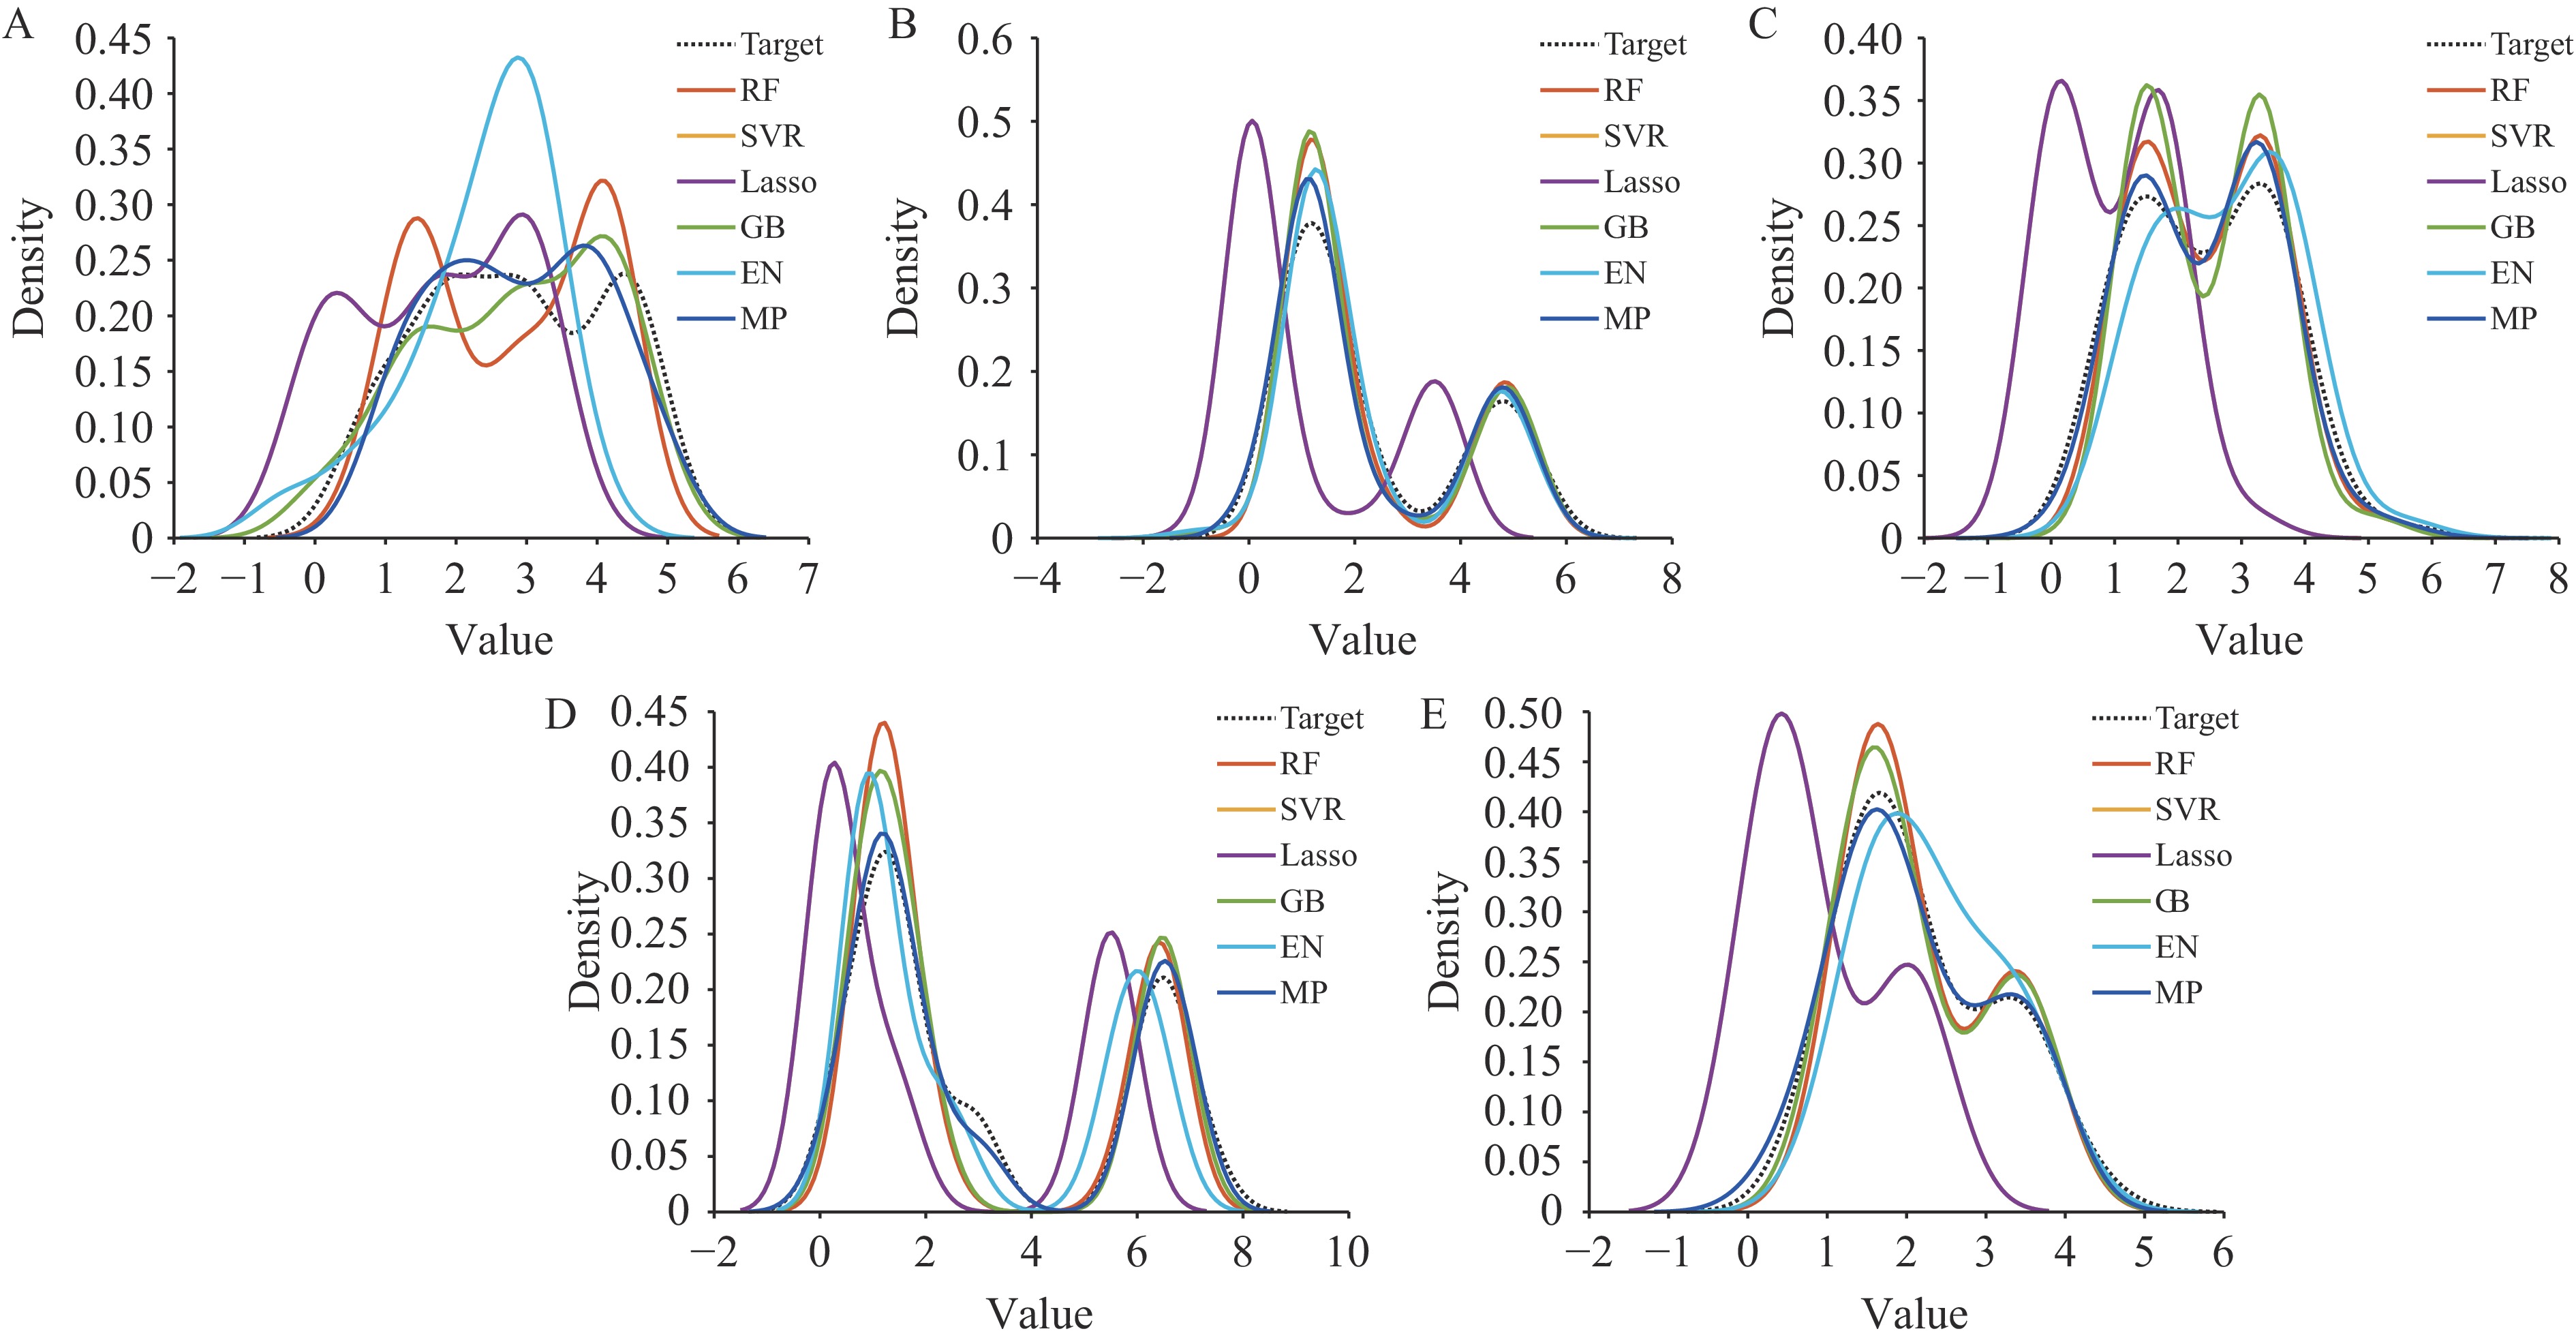 Figure 4.
Predicting results of the classical and MP model represented through KDE distributions of predicted and actual antigenic distance values across (A–E) Task 1–5.
Note: The X-axis denotes the antigenic distance, and the Y-axis indicates the density. Each line corresponds to a different model.
Abbreviation: KDE=kernel density estimation; MP=matching pursuit method.
-
In this section, we conducted a systematic screening and evaluation of critical amino acid sites within the model. The top 50 amino acid sites with the highest contribution were selected for model fitting in each task. Task 1 comprised 8 single sites and 34 coupled sites, task 2 included 13 single sites and 37 coupled sites, task 3 contained 12 single sites and 38 coupled sites, task 4 had 8 single sites and 32 coupled sites, and task 5 consisted of 7 single sites and 43 coupled sites. Notably, coupled sites consistently represented a higher proportion in feature selection across all tasks, ranging from 74–86 percent (Table 5 and Table 6).
Task 1 (8) Task 2 (13) Task 3 (12) Task 4 (8) Task 5 (7) 54 43 43 51 9 56 66 57 120 34 71 74 82 155 49 121 84 132 186 77 128 89 141 211 81 135 125 186 216 93 186 141 187 260 95 187 153 189 272 163 190 187 222 215 252 222 315 253 Note: The number after Task No. is the important feature number.
Abbreviation: MP=matching pursuit method.Table 5. Top single amino acid sites identified for their high contribution to antigenic changes within each task based on the MP model (Single Site).
Task No. Two Site Task 1 (34) 187–222
56–193
141–157
135–160135–186
54–56
135–141
160–216121–216
56–216
186–253
157–27256–253
36–186
128–253
135–222186–216
153–160
71–13571–130
128–186
74–13571–186
128–193
160–324193–216
193–253
36–15754–272
74–141
36–216121–187
36–193
56–130Task 2 (37) 69–125
2–315
89–153
125–253187–253
84–187
273–324
3–82153–187
252–253
2–163
43–18743–125
74–222
2–72
43–73153–253
43–183
2–84
69–190187–215
69–175
84–253
2–43222–273
153–209
166–253
43–25374–141
72–315
153–163125–183
163–187
175–2533–253
208–253
66–215Task 3 (38) 187–189
186–187
170–194
35–194183–253
82–187
141–193
35–7369–269
267–273
160–193
146–187186–189
194–209
120–141
267–31573–128
141–194
141
187–252189–271
183–186
132–153
166–209267–290
82–190
68–141
187–215132–141
187–190
73–189
187–31574–183
194–208
112–20974–189
84–141
73–82Task 4 (32) 71–162
17–260
72–134
129–22245–211
162–260
84–215
94–1120–272
84–228
3–22856–112
155–228
32–4738–47
271–283
43–7247–71
168–170
211–26038–211
211–250
72–25047–250
17–47
32–276211–298
94–129
161–27132–43
38–250
61–168Task 5 (43) 43–130
74–156
127–239
83–262
96–12735–186
138–183
19–187
197–227
209–29836–130
120–128
61–178
3–197
183–19089–129
83–109
85–161
36–209207–260
43–129
19–69
161–19109–209
71–129
35–205
89–239129–166
179–239
179–209
73–17836–129
71–179
51–179
166–17935–178
183–187
128–197
128–18638–45
84–262
191–274
35–170Note: The number after Task No. is the important feature number.
Abbreviation: MP=matching pursuit method.Table 6. Top coupled amino acid sites identified for their high contribution to antigenic changes within each task based on the MP model.
We identified 21, 29, 39, 37, and 53 amino acid mutations in tasks 1–5, with 16, 20, 29, 22, and 28 sites respectively associated with antigenic epitopes (Table 7 and Figure 5). These findings suggest that mutations at these positions may significantly alter antigenicity and contribute to antigenic drift. Notably, certain amino acid positions appeared repeatedly in coupled-site mutations, such as positions 216 and 186 in task 1, 253 in task 2, 187 and 141 in task 3, 211 in task 4, and 209 and 35 in task 5. The recurrence of these mutations in both single-site and coupled-site analyses indicates their substantial impact on antigenic properties (Table 6 and Figure 6).
Antigenic sites Task 1-aa Task 2-aa Task 3-aa Task 4-aa Task 5-aa Sa 121, 153, 157,160 125, 153, 163 120, 153, 160 120, 155, 161, 162 120, 156, 161 Sb 186, 187, 193 187, 190, 208, 209 186, 187, 189, 190, 193, 194, 208, 209 186, 211 186, 187, 190, 191, 197, 207, 209 Ca 141, 216, 222 141, 166, 215, 222 141, 146, 166, 170, 215, 222 142, 168, 170, 215, 216, 222 138, 166, 170, 205, 239 Cb 54, 71, 74, 253 72, 73, 74, 82, 84, 89, 253 68, 73, 74, 82, 84, 253 71, 72, 84, 260 71, 73, 74, 84, 85, 89, 260, 262 Pa 272 43, 273 43, 269, 271, 273 43, 271, 276, 283 43, 274 Pb 36 35, 290 38 35, 36, 38 Abbreviation: MP=matching pursuit method; HA=hemagglutinin. Table 7. Antigenic sites and corresponding amino acid positions within the HA1 epitope identified as critical for antigenic changes across tasks based on the MP model.
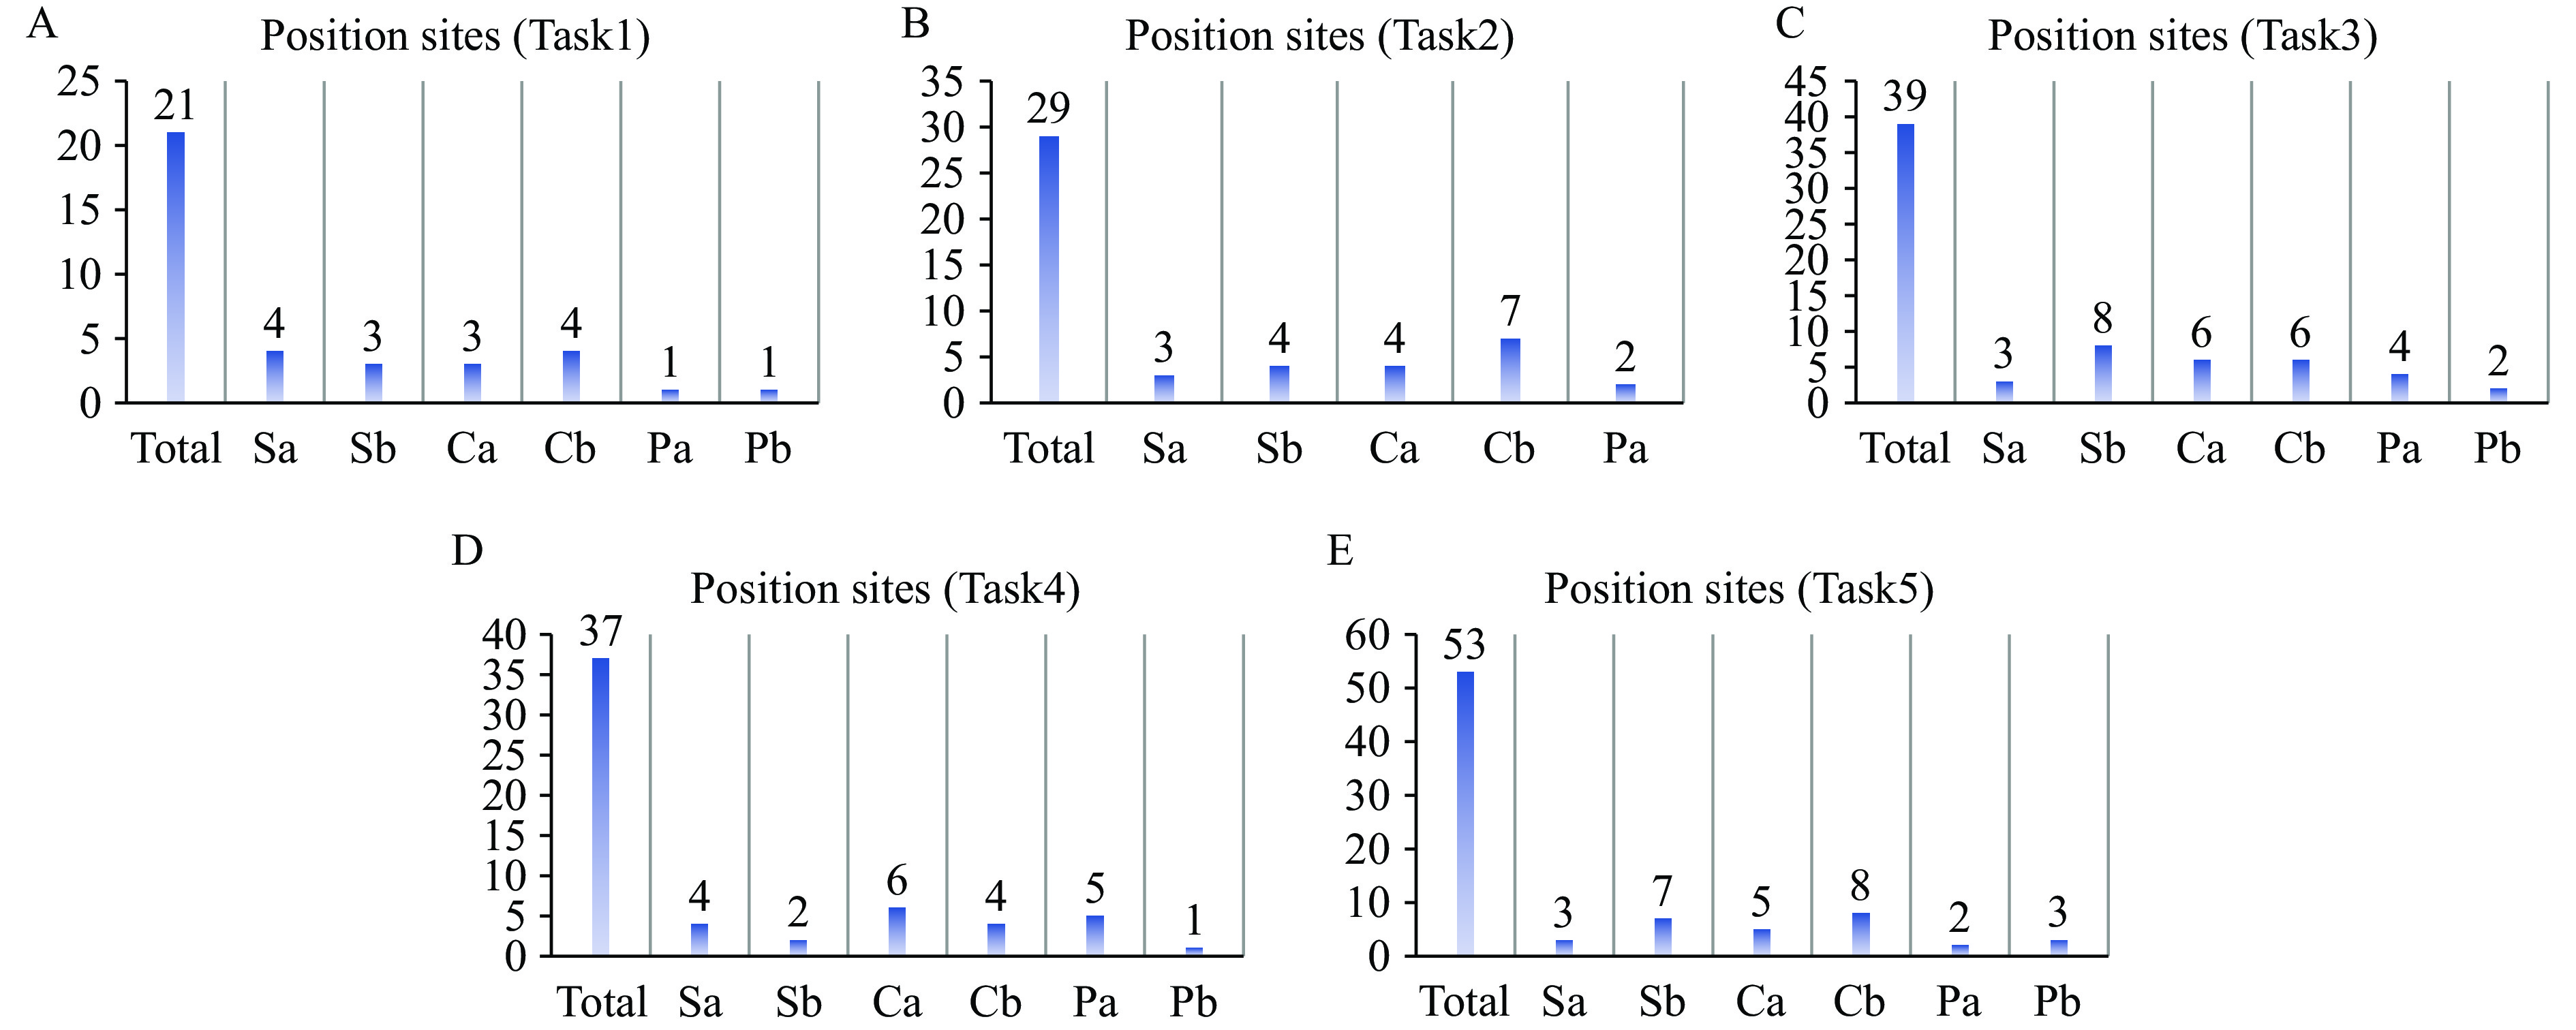 Figure 5.
Bar charts illustrating the distribution of identified amino acid mutations across antigenic sites (Sa, Sb, Ca, Cb, Pa, and Pb) for (A–E) Tasks 1–5.
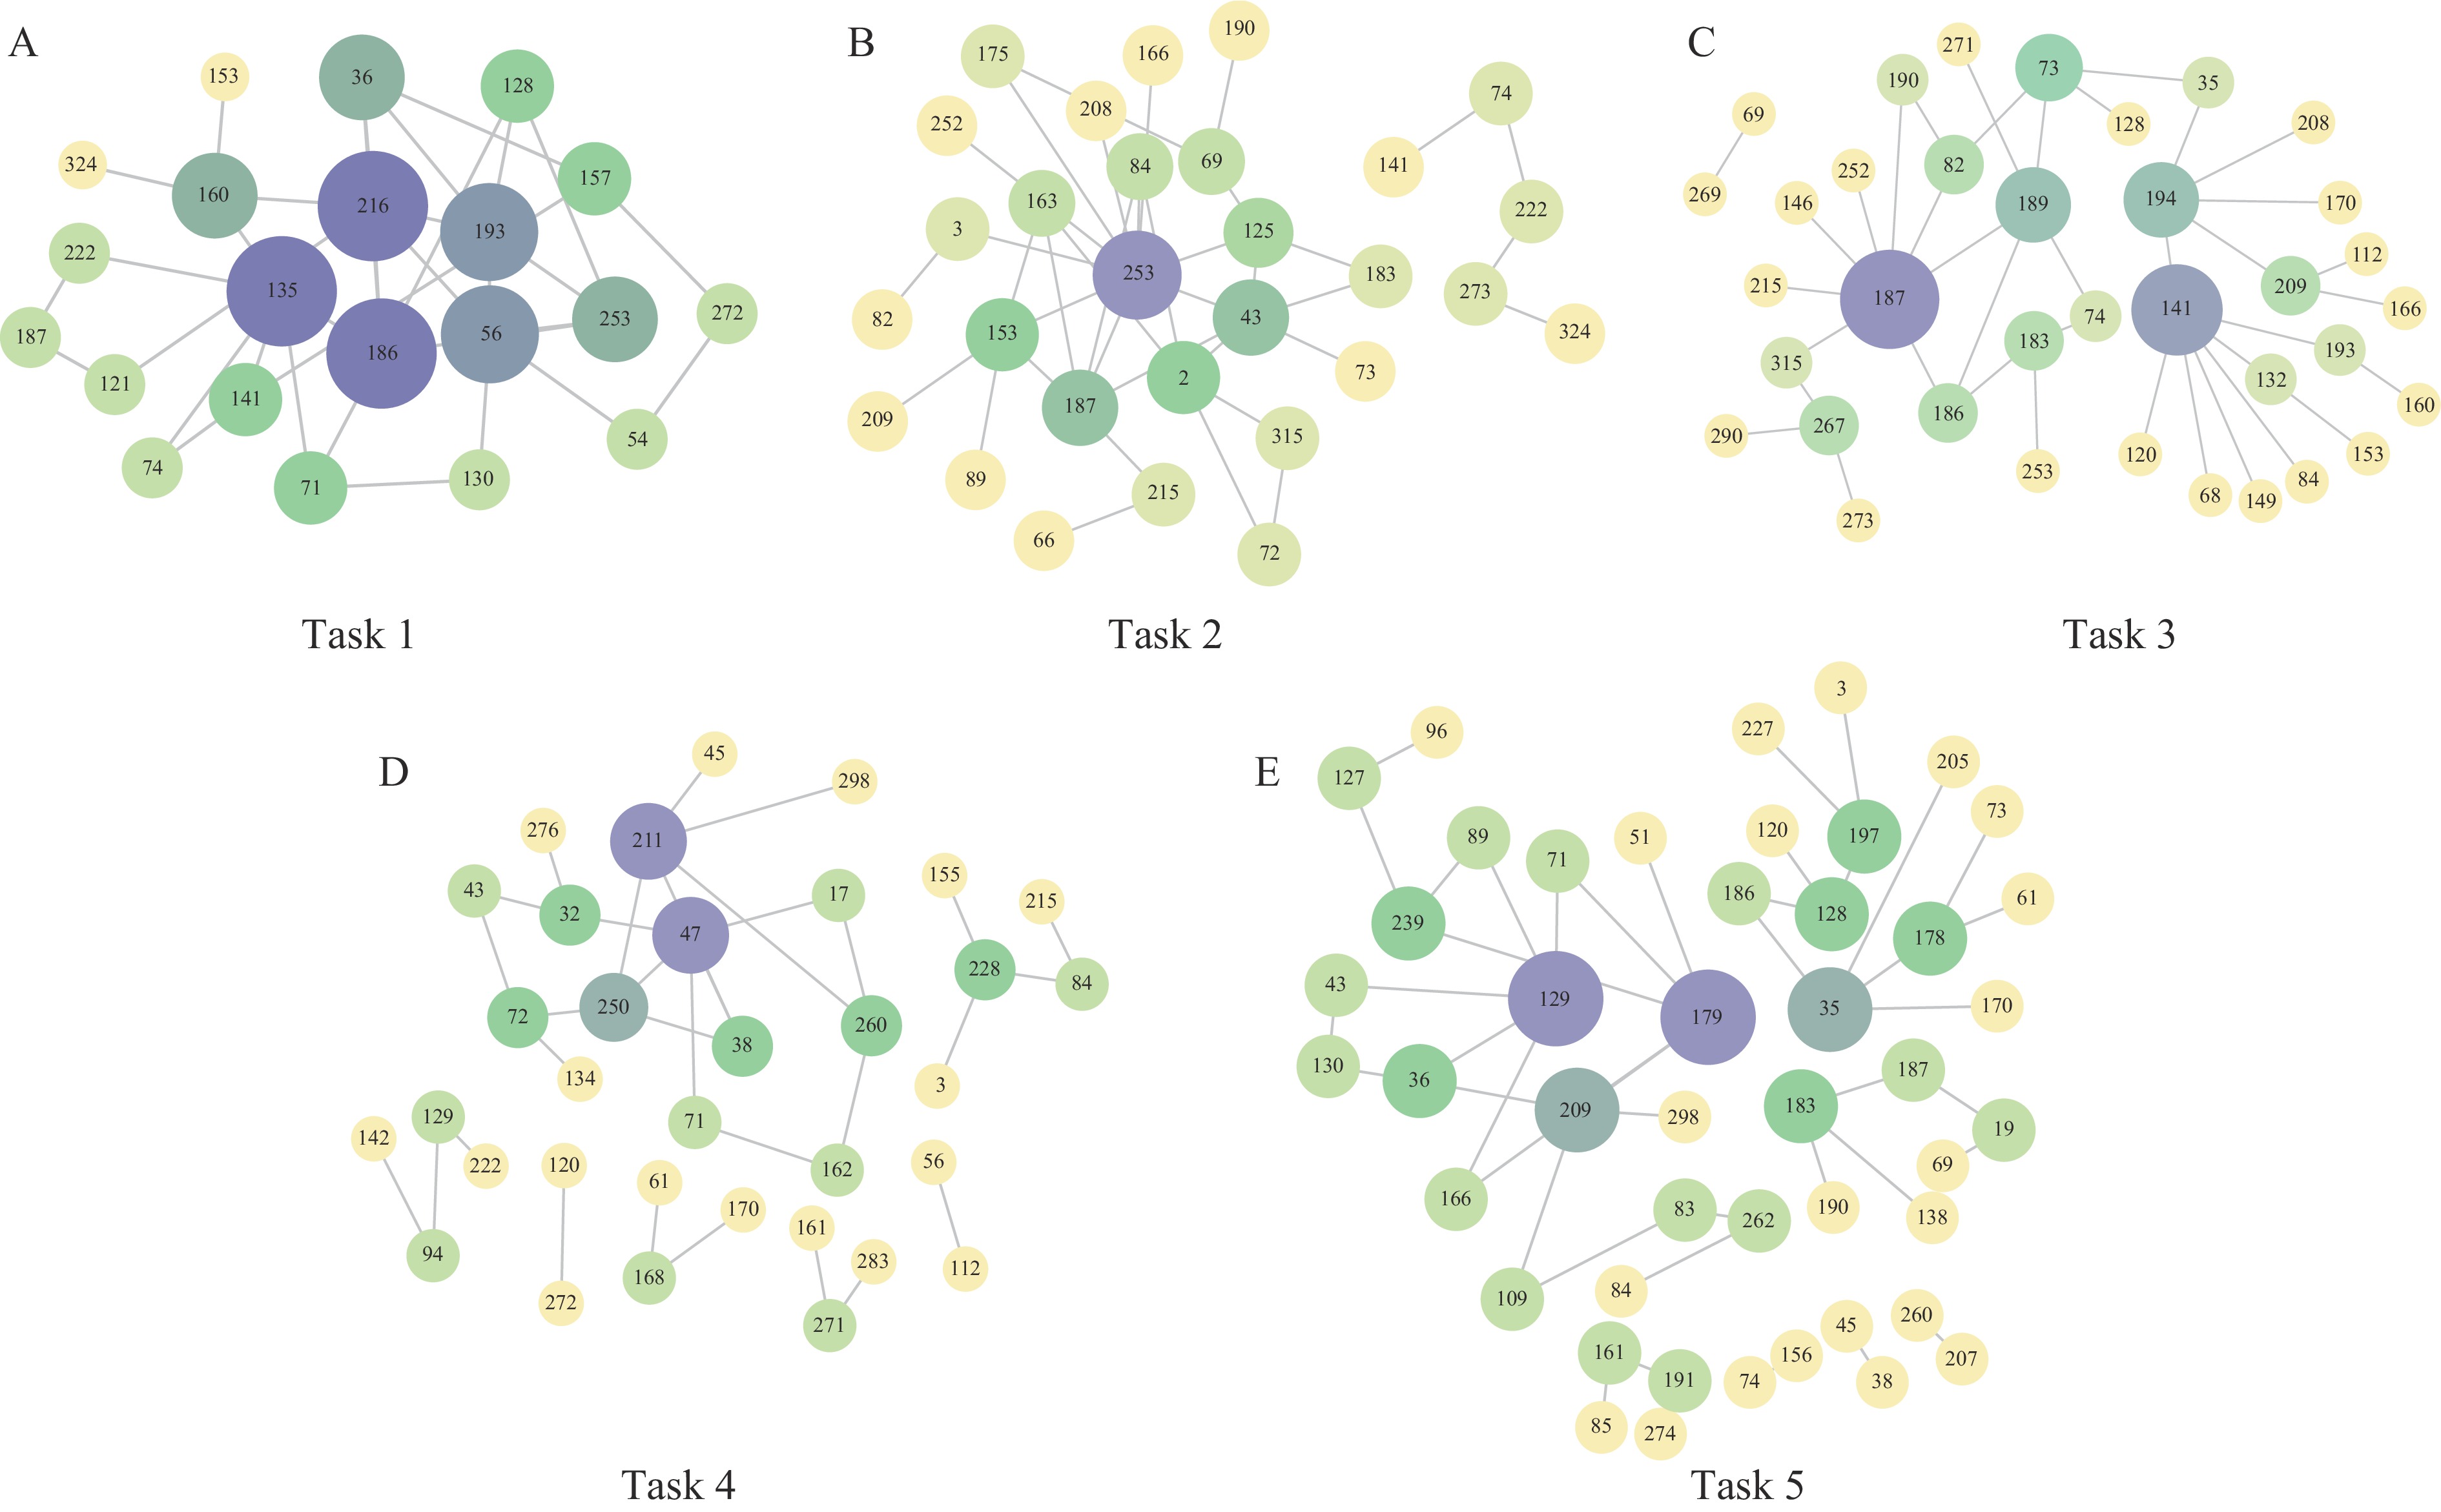 Figure 6.
Network diagram of two-site interactions for (A–E) Task 1–5.
Based on the results shown in Table 6 and Figure 5, we have identified both commonalities and differences across individual tasks. Certain amino acid sites consistently appear in multiple tasks, such as the 153 site in the Sa region, which is identified as critical in almost all tasks, suggesting its central role in antigenic variation. Conversely, some loci appear exclusively in specific tasks, reflecting the diversity of antigenic variations that may be influenced by different datasets or model conditions.
Finally, we summarized and deduplicated the amino acids in six antigenic epitopes (Ca, Cb, Pa, Pb, Sa, and Sb) selected from the five tasks. A total of 12 residues are present in the Ca antigenic epitope, 13 in the Cb antigenic epitope, 8 in the Pa antigenic epitope, 4 in the Pb antigenic epitope, 11 in the Sa antigenic epitope, and 12 in the Sb antigenic epitope. All residues were visualized on both trimeric and monomeric structures of the influenza HA protein (PDB: 3UBE) using PyMOL (Figure 7).
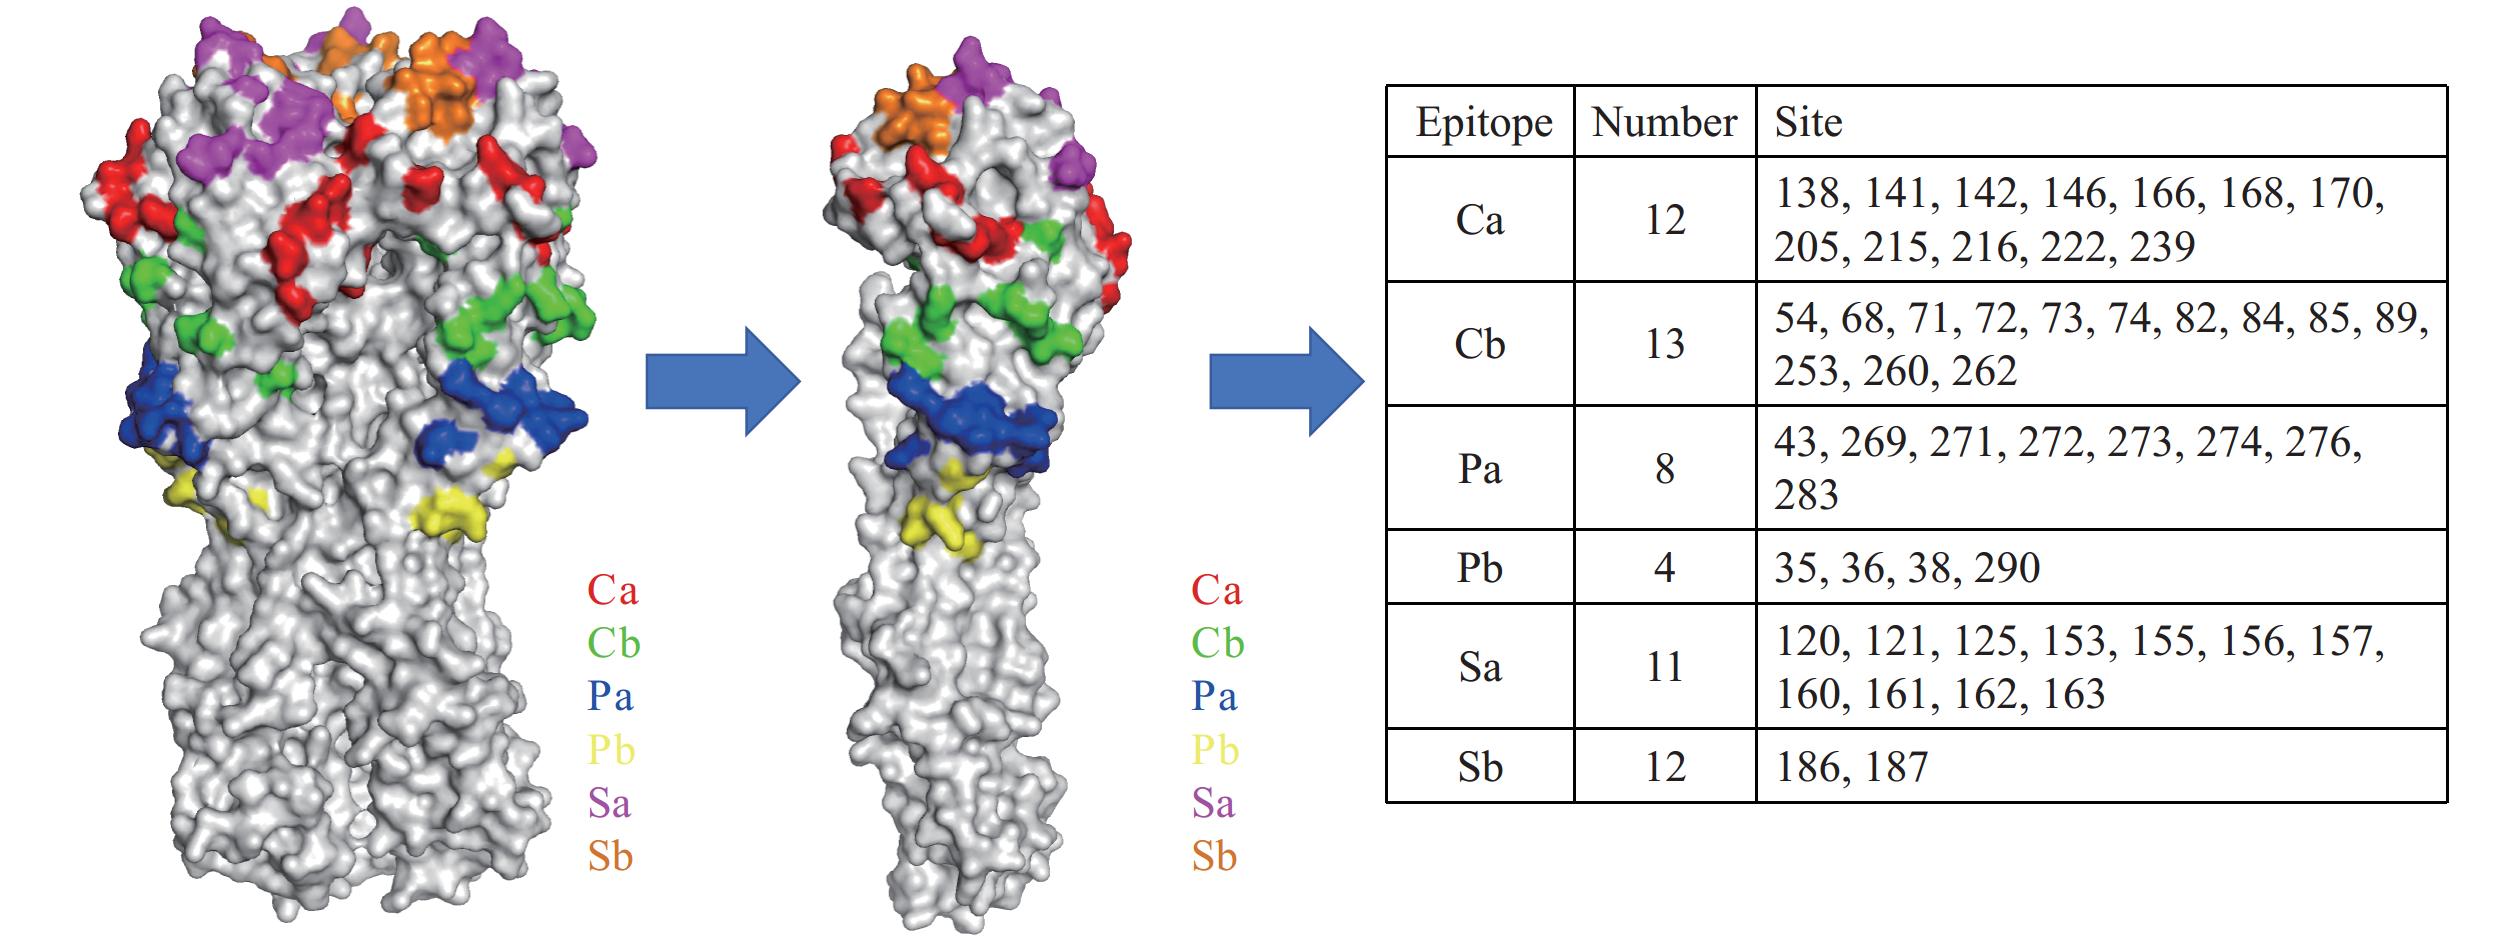 Figure 7.
The selected amino acids of six antigenic sites (i.e., Ca, Cb, Pa, Pb, Sa, and Sb) of H1 (A/California/04/2009; PDB 3UBE).
The identification of these key sites provides valuable insights for elucidating antigenic variation mechanisms and serves as a critical reference for vaccine design. Specifically, optimizing vaccine formulations to target these frequently occurring critical sites could substantially enhance vaccine efficacy against emerging viral strains.
-
This article introduces a novel approach for predicting antigenic variations of H1N1 influenza A — the MP model. Traditionally, antigenic variation prediction relies on extracting protein sequences and serological data, followed by applying regression-based models to infer the antigenic characteristics of novel viral protein sequences. In contrast, this study incorporates AFD theory as a key component, offering an alternative analytical perspective that aims to enhance predictive performance and interpretability.
The proposed method demonstrates several significant advantages. First, the algorithm leverages AFD to dynamically select optimal basis functions, which enhances its capacity to capture nonlinear relationships in antigenic data. This flexibility effectively mitigates issues such as overfitting, a common challenge in high-dimensional datasets with sparse labels. Second, compared with traditional regression techniques, the model offers improved interpretability, superior computational efficiency, and reduced complexity, making it particularly suitable for large datasets and real-time applications. Furthermore, the model’s applicability extends beyond H1N1 influenza A, with preliminary results suggesting its utility for other influenza subtypes such as H3N2 and Influenza B, and its potential adaptability to other viral families. Notably, this study also incorporates dual-site synergy considerations, identifying key site interactions from five publicly available datasets.
Empirical evaluations on these datasets indicate that the model performs well across various metrics, often outperforming baseline methods. However, deeper analysis has revealed certain areas requiring improvement. For example, while the algorithm exhibits strengths in computational efficiency and generalization, its sensitivity to capturing subtle antigenic shifts could be further refined.
Future efforts will focus on integrating advanced feature engineering to capture domain-specific viral protein properties and exploring ensemble learning to enhance predictive robustness. We also plan to collaborate with virology experts on cell-based experiments to validate our predictions and support applications in vaccine design and epidemiological forecasting. This comprehensive approach aims to refine our methodology and contribute to addressing complex challenges in influenza and broader virology research.
HTML
Matching Pursuit Model Based on Adaptive Fourier Decomposition Theory


Validation Examples


Model Evaluation
Analysis on Amino Acid Site
| Citation: |

|