
 Download:


-
An Omicron BA.2 epidemic occurred in Shanghai, China in early March 2022. The objective of our study is to quantify the spatial spread of the epidemic across Shanghai subdistricts and identify risk factors. This study provides quantitative estimates of the epidemic arrival time, growth rate, and infection attack rate (IAR) as of May 31, 2022, and uses a generalized linear mixed effect model (GLMM) to explore their associations with demographic and socioeconomic characteristics of the population, human mobility, and interventions at the subdistrict level. We found that the epidemic growth rate was positively associated with the epidemic arrival time and subdistricts farther away from the (likely) origin of the outbreak had lower growth rates. The IAR was negatively correlated with the arrival time, distance from the initial outbreak location, subdistrict location, and booster coverage in the population aged 65 years and above; a positive association was found for population density and gross domestic product (GDP). This study highlights the role of the geographical structure of the city, human mobility, population characteristics, and adopted interventions in shaping the dynamics of the epidemic.
Shanghai is divided into 16 districts and 216 subdistricts. In the initial phase of the outbreak, grid management was implemented at the subdistrict level and entailed partial lockdown and mass nucleic acid screening for high-risk areas and non-high-risk areas. Afterward, eastern Shanghai entered a population-wide lockdown on March 28, and then the rest of Shanghai entered a lockdown phase on April 1 (
Supplementary Figure S1 ). The city-wide lockdown was fully lifted on June 1, 2022.Daily aggregated data on the number of infections and individual-level data of all severe acute respiratory syndrome coronavirus 2 (SARS-CoV-2) infections were extracted from multiple publicly available official data sources. The initial (identified) foci of the outbreak was the cultural activity center of Shiquan subdistrict in Putuo District, where a cluster of 14 SARS-CoV-2 positive individuals was detected starting from March 1, 2022 (1).
To describe the time course of the Omicron outbreak in Shanghai, we estimated the following three indicators at the subdistrict level: 1) epidemic arrival time (i.e., the date of the first confirmed infection in a subdistrict), 2) IAR (i.e., the cumulative number of reported infections in a subdistrict divided by the total population in that subdistrict), and 3) epidemic growth rate.
To explore potential risk factors associated with the epidemic arrival time, growth rate, and IAR across subdistricts, we included several covariates that belong to four general categories: demographic characteristics, socioeconomic characteristics, human mobility, and interventions (
Supplementary Table S1 ). The arrival time of the epidemic represents a response variable when measuring the spread of the infection; however, we also considered it as an explanatory variable when exploring its association with the epidemic growth rate and IAR.A correlation analysis was conducted to assess collinearities between the independent variables. We built a GLMM model to estimate the proportion of variance in the response variables ascribable to intra- and inter-district variation. The significance level was set to 0.1 for candidate variable selection, and 0.05 for multivariate regression. To test whether the random model was appropriately chosen, we also estimated spatial autocorrelation between residuals using Moran’s I statistic. To quantify the uncertainty of model selection, a generalized estimating equation (GEE) model accounting for spatial clustering was used in a sensitivity analysis. The detailed statistical methods are presented in the Supplementary Material. All the analyses were performed in R 4.1.0 (R Foundation for Statistical Computing, Vienna, Austria).
As of May 31, 2022, a total of 626,840 SARS-CoV-2 infections had been reported in 99.54% of the Shanghai subdistricts. High heterogeneity in the spatial distribution of infections was found across subdistricts, with 27.78% of the subdistricts accounting for more than 70% of all infections (
Supplementary Figure S2 ).The spatial spread of the epidemic showed a clear spatial trend from the city center to adjacent areas, and a continuous spread toward suburban and rural areas. The spatial distribution of the arrival time was highly heterogeneous, with 35.19%, 41.67%, and 97.69% of the subdistricts reporting infections within the first week, second week, and a month, respectively.
We analyzed the correlation between the epidemic arrival time and the geographical distance from the initial outbreak location. The regression model showed that compared to the geographic and effective distances, the pre-epidemic flow of travelers showed a slightly weaker correlation with the epidemic arrival time (Figure 1).
 Figure 1.
Scatter plots of the correlation between epidemic arrival time and (A) geographical distance, (B) effective distance, and (C) baseline flows.
Note: Dots in the scatter plot were colored by different districts.By fitting a linear regression model to the logarithm of the daily number of new confirmed infections from February 26 to April 1, 2022, the overall epidemic growth rate for Shanghai was estimated to be 0.23 per day [95% confidence interval (CI): 0.22–0.25]. Excluding 6 subdistricts reporting no infections before the lockdown and 49 subdistricts with R2<0.6, as well as 3 subdistricts with only two data points, we analyzed the estimated growth rates for the remaining 158 subdistricts. The growth rate was lognormal-distributed, with a range of 0.06 to 0.39, which was positively associated with the arrival time of the epidemic (Figure 2A–2C).
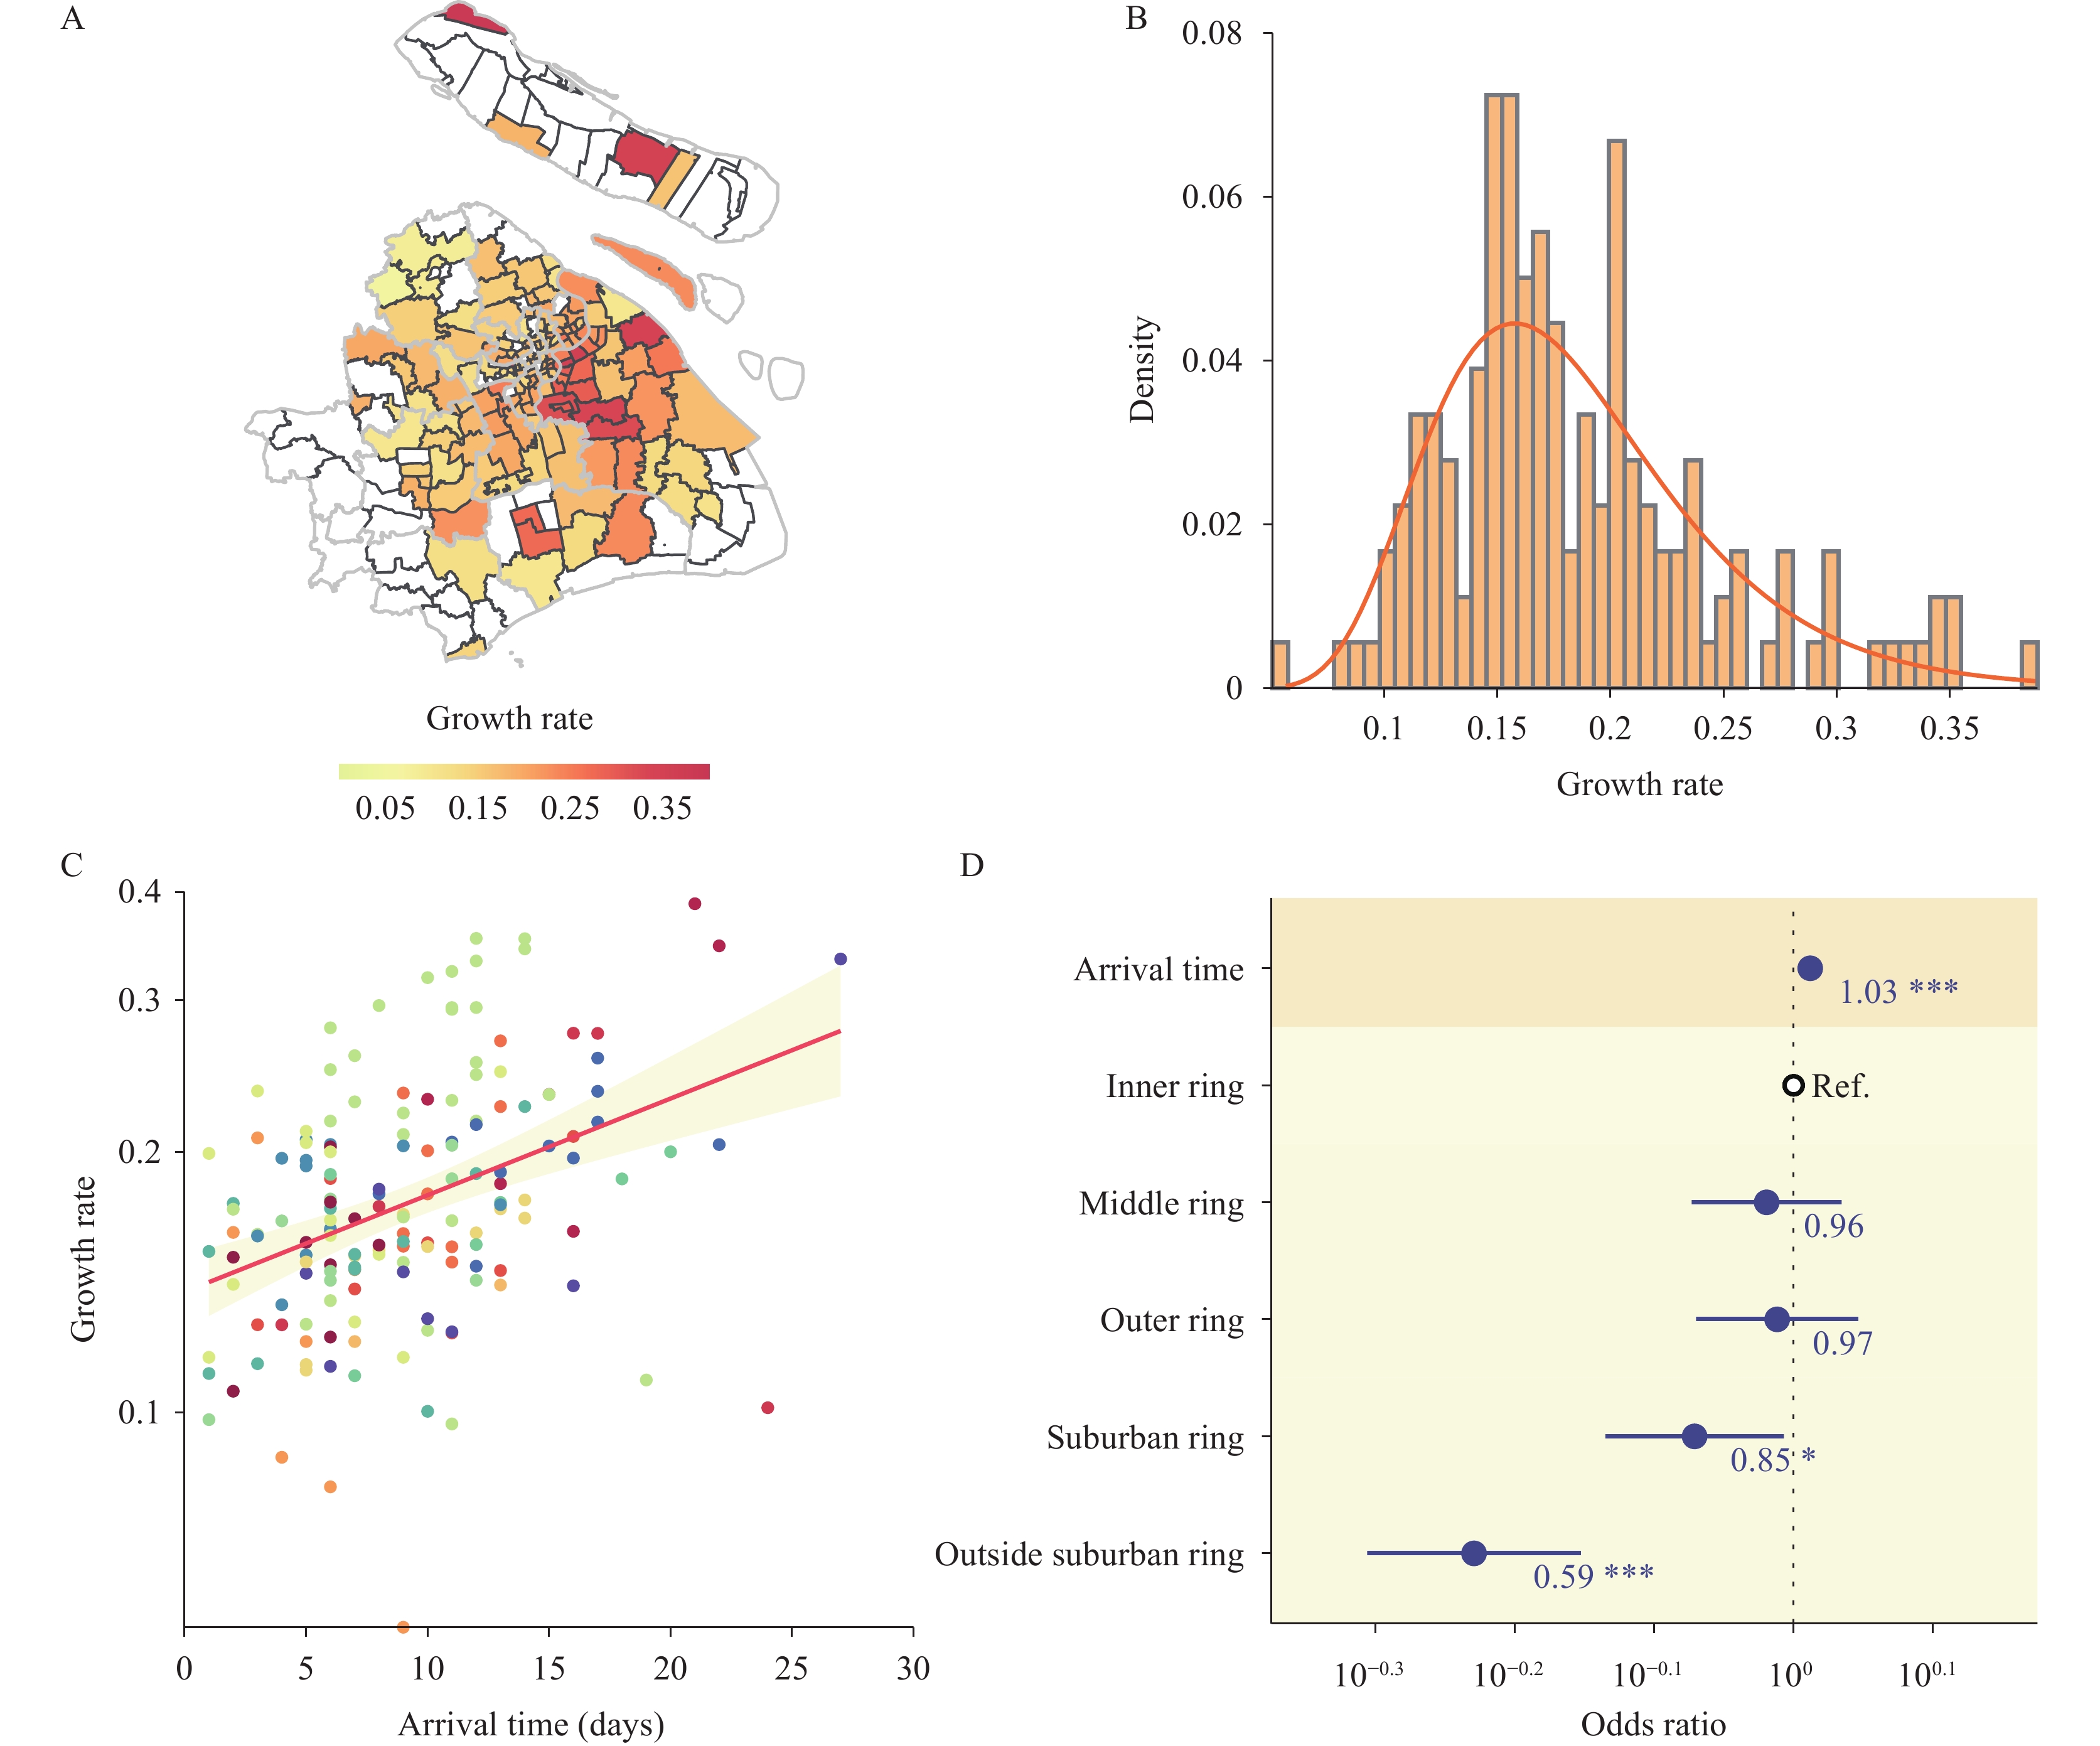 Figure 2.
Epidemic growth rate and its associated factors. (A) Geographical distribution of growth rates for 158 subdistricts. (B) Distribution of the estimated epidemic growth rate (per day) by subdistrict and fit of a log-normal distribution. (C) Scatter plot of the epidemic growth rate and arrival time. (D) Factors associated with the growth rate.
Note: In panel A, of the 216 subdistricts, 6 subdistricts reporting no infections before the lockdown, 49 subdistricts with an $ {R}^{2} $<0.6, and 3 subdistricts with only two data points for estimating their growth rates, were excluded from the regression; the excluded subdistricts are shown in white. In panel C, dots were colored by different districts. In panel D, dots and lines indicate point estimates and 95% confidence intervals of the odds ratio. Odds ratio was calculated as exponentiated regression coefficients. Numbers on the side of the dots indicate the numerical value of the point estimate.
Abbreviation: Ref.=reference category.
* indicates P-value<0.05;
** indicates P-value<0.01;
*** indicates P-value<0.001.
The results of the univariate analysis were reported in the
Supplementary Table S2 . The final selected model showed that the arrival time positively correlated with the growth rate of the epidemic [odds ratio (OR): 1.03, 95% CI: 1.02–1.04]. Subdistricts located in the suburban ring (OR: 0.85, 95% CI: 0.73–0.98) and outside the suburban ring (OR: 0.59, 95% CI: 0.49–0.70) were associated with a significantly lower epidemic growth rate (Figure 2D). The residuals did not show significant spatial autocorrelation with Moran’s I analysis. The results were robust after removing the outliers. We obtained similar results with a GEE model (Supplementary Table S3 ).As of May 31, 2022, the overall IAR in Shanghai was estimated to be 2.42%. However, the IAR was highly heterogeneous across subdistricts, ranging from 0 to 13.75%. The epidemic arrival time was significantly associated with the IAR. The final selected model showed that the arrival time was negatively correlated with the IAR (OR: 0.59, 95% CI: 0.46–0.75). Among the investigated demographic characteristics, population density was positively associated with the IAR (OR: 1.38, 95% CI: 1.20–1.60). Among the socioeconomic characteristics, subdistricts that were farther apart from the initial outbreak location were associated with a significantly lower IAR (OR: 0.96, 95% CI: 0.95–0.98). GDP at the district level positively correlated with the IAR (OR: 1.51, 95% CI: 1.23–1.85). Compared to subdistricts located in the inner ring, subdistricts located farther away from the inner ring were significantly associated with lower IARs (OR for middle ring: 0.51, 95% CI: 0.35–0.73; OR for outer ring: 0.43, 95% CI: 0.32–0.58; OR for suburban ring: 0.16, 95% CI: 0.11–0.24; OR for outside suburban ring: 0.05, 95% CI: 0.03–0.08). Among the vaccine-related covariates, booster coverage for people aged 65 years and above was associated with a significantly lower IAR (OR: 0.73, 95% CI: 0.55–0.96, Figure 3). Moran’s I for the residuals showed no significant spatial autocorrelation. The results were robust after removing the outliers, and similar results were obtained with a GEE model (
Supplementary Table S4 ). Figure 3.
Infection attack rate and its associated factors. (A) Geographical distribution of the infection attack rates at the subdistrict level as of May 31, 2022. (B) Distribution of the infection attack rate by subdistrict and fit of a log-normal distribution. (C) Scatter plot of the infection attack rate and arrival time. (D) Factors associated with the infection attack rate.
Note: In panel C, dots were colored by different districts. In panel D, dots and lines indicate point estimates and 95% confidence intervals of the odds ratio. Odds ratio was calculated as exponentiated regression coefficients. Numbers on the side of the dots indicate the numerical value of the point estimates.
Abbreviation: GDP=gross domestic product; Ref.=reference category.
* indicates P-value<0.05;
** indicates P-value<0.01;
*** indicates P-value<0.001.
-
This study highlights the heterogeneous spread of the 2022 Omicron BA.2 epidemic in Shanghai, and identifies associations between different metrics of spatial spread at the subdistrict level and demographic and socioeconomic characteristics of the population, human mobility patterns, and adopted interventions.
The identified (likely) foci of the outbreak was the cultural activity center of the Shiquan subdistrict in Putuo District. However, we could not rule out the possibility that the Omicron outbreak might have originated from multiple sources that resulted in simultaneous transmission chains prior to the identification of the first local transmission event.
Our findings suggest that the subdistricts with stronger connections to the initial outbreak location had higher chances of being reached by the epidemic early on, which is consistent with observations for the 2009 H1N1 influenza pandemic and 2003 SARS epidemic (2). The epidemic growth rate was positively associated with the arrival time of the epidemic, suggesting that the targeted interventions implemented in high-risk areas were insufficient to slow down transmission (3).
Human mobility is generally considered to be key in determining the risk of infection and the spread of epidemics (4-5). However, in our multivariate regression models, we found that pre-epidemic population flows were not significantly associated with the IAR or growth rate. This could be explained by its strong collinearity with the epidemic arrival time, which ultimately had a strong impact on determining the type and timing of adoption of control measures (6).
Subdistricts with a higher GDP were found to have a higher IAR, consistent with a previous study (7). This indicates that subdistricts with a higher GDP trend to have more factories and enterprises, causing more gathering and higher risk of transmission accordingly.
Initially, the outbreak spread in and around the inner ring. Previous literature also found that the COVID-19 pandemic in the United States was characterized by a geographically localized mosaic of transmission along an urban-rural gradient (8-9), suggesting that geographic distance may play an important role in SARS-CoV-2 spread. Finally, the public health impact of COVID-19 vaccines has already been widely discussed in the literature (10-13) and our study confirms previous evidence.
Our study suffers from limitations that are rooted in the uncertainty and fragmentary nature of publicly available sources, such as a high level of missing data for key variables, such as the date of symptom onset. Additionally, the population flows were provided by China Unicom and thus may suffer from the limitation intrinsic of mobile phone data. Moreover, we cannot exclude the possibility that there are other potential risk factors that were not considered in our study (e.g., housing conditions and meteorological factors). Meteorological factors may play an important role to explain the heterogeneity in the temporal and spatial spread of infectious diseases, but we did not include them here as the variation may be very limited across the small study location and the short study period. Finally, this study does not provide causal relationships, but only provides associations between different metrics of the epidemic spread with a set of indicators.
In conclusion, this study provides a quantitative description of the spatiotemporal spread of the Omicron BA.2 variant in Shanghai at the subdistrict level. Our findings highlight the role of the geographical structure of the city, human mobility, socioeconomic characteristics of the population, and adopted interventions in shaping the dynamics of the epidemic. Disentangling these factors might contribute to a deeper understanding the transmission dynamics and ecology of COVID-19 and guide the design of monitoring and management strategies.
HTML
| Citation: |

|