
 Download:


-
Bisphenol A (BPA) is used in the synthesis of commercial plastics, including polycarbonates and epoxy resins, which are incorporated into a wide variety of consumer goods. Exposure to BPA was suspected to result in a variety of toxicities in the neurological, reproductive, metabolic, and immune system (1). Considering these potential undesirable effects, European Food Safety Authority (EFSA) established a temporary tolerable daily intake (t-TDI) of 4 μg/kg body weight per day (2).
Abiding by the regulations on the production and restricted use of BPA in European Union, United States, China, and other countries, BPA in commercial products was gradually replaced by its analogues, such as bisphenol S (BPS), bisphenol F (BPF), bisphenol B (BPB), and bisphenol AF (BPAF). After being put into use, these bisphenolic compounds (BPs) were released into the environment and entered the food chain. A variety of foods (cereals, fruits, meats etc.) were found to contain BPS and other analogues. Studies have shown that the genotoxicity and estrogenic activity of these alternatives are like that of BPA (3-4).
The primary source of exposure to BPA for most people is through the diet from contaminated foodstuffs (5). Dietary exposure of BPA from the Canadian Total Diet Study (TDS) was evaluated in view of BPs in composite food samples (6). In China, BPA from the Fourth China TDS (2007) samples as well as BPA and several analogues from the Fifth China TDS (2010–2012) were analyzed and the estimated daily intakes (EDI) of these BPs were safe for general people (7-8). However, in past decades, China’s sustained development and progress have affected the lives of every resident. Under this circumstance, food consumption and contamination levels might have changed remarkably since China’s restriction of BPA in baby products and food contact materials implemented since 2011. The purpose of this study was to evaluate the Chinese daily exposure to BPs from the Sixth TDS (2016–2019) (9).
Levels of BPs in the Sixth China TDS were provided in Supplementary Tables S1–S4 and summarized in Table 1, where BPA was detected in 216 out of total 288 samples, with a concentration range of non-detected value (ND) to 20.0 µg/kg, among which the highest level occurred in cereals from Jiangsu Province. The mean concentrations of BPA from food categories ranged from 0.129 µg/kg (milk)–1.02 µg/kg (meat). BPS presented a rate of detection of 78.5%, accounting for 226 samples. The maximum level 67.1 µg/kg was attributed to a sample of meats from Fujian Province. While the second largest value is 16.6 μg/kg from a meat sample in Henan Province. BPF and BPAF were found in 8.33% and 27.1% of samples, with the maximum concentrations of 1.06 μg/kg and 1.75 μg/kg, respectively.
Category Parameter BPA BPS BPF BPAF Cereals Mean (μg/kg) 0.466 0.545 0.007 0.012 Medium (μg/kg) 0.256 0.128 ND ND Range (μg/kg) ND to 1.44 ND to 6.40 ND to 0.169 ND to 0.129 Detective rate (%) 91.7 83.3 4.2 29.2 Legumes and nuts Mean (μg/kg) 0.484 0.984 0.146 ND Medium (μg/kg) 0.255 0.707 ND ND Range (μg/kg) ND to 3.39 ND to 4.23 ND to1.06 ND Detective rate (%) 87.5 91.7 37.5 0 Potatoes Mean (μg/kg) 0.340 0.163 0.008 0.006 Medium (μg/kg) 0.271 0.147 ND ND Range (μg/kg) ND to 1.35 ND to 0.648 ND to 0.186 ND to 0.029 Detective rate (%) 95.8 91.7 4.2 29.2 Meats Mean (μg/kg) 1.024 5.827 0.106 0.026 Medium (μg/kg) 0.476 2.010 ND ND Range (μg/kg) ND to 5.82 ND to 67.1 ND to 0.279 ND to 0.530 Detective rate (%) 95.8 91.7 20.8 25 Eggs Mean (μg/kg) 0.180 0.130 ND 0.021 Medium (μg/kg) 0.169 0.042 ND 0.013 Range (μg/kg) ND to 0.544 ND to 0.636 ND ND to 0.061 Detective rate (%) 54.2 87.5 0 50 Aquatic foods Mean (μg/kg) 0.927 1.25 0.015 0.125 Medium (μg/kg) 0.689 0.621 ND 0.024 Range (μg/kg) 0.199 to 3.31 ND to 6.34 ND to 0.192 ND to 1.75 Detective rate (%) 100 95.8 8.3 79.2 Milk Mean (μg/kg) 0.129 0.022 ND 0.002 Medium (μg/kg) ND 0.008 ND ND Range (μg/kg) ND to <0.385 ND to 0.148 ND ND to 0.026 Detective rate (%) 41.7 29.2 0 12.5 Vegetables Mean (μg/kg) 0.347 0.343 0.015 0.010 Medium (μg/kg) 0.293 0.127 ND ND Range (μg/kg) ND to 1.09 0.020 to 1.81 ND to 0.190 ND to 0.041 Detective rate (%) 95.8 100 8.3 37.5 Fruits Mean (μg/kg) 1.68 0.315 0.032 0.023 Medium (μg/kg) 0.418 0.111 ND ND Range (μg/kg) ND to 20.0 0.026 to 1.71 ND to 0.449 ND to 0.175 Detective rate (%) 91.7 100 12.5 41.7 Sugar Mean (μg/kg) 0.909 0.034 0.011 0.006 Medium (μg/kg) 0.602 0.021 ND ND Range (μg/kg) 0.197 to 3.26 ND to 0.114 ND to 0.260 ND to 0.043 Detective rate (%) 91.7 70.8 4.2 20.8 Beverages and water Mean (μg/kg) 0.234 0.058 ND ND Medium (μg/kg) ND 0.013 ND ND Range (μg/kg) ND to 1.57 ND to 0.612 ND ND Detective rate (%) 20.8 50.0 0 0 Alcoholic beverages Mean (μg/kg) 0.161 0.081 ND ND Medium (μg/kg) ND 0.012 ND ND Range (μg/kg) ND to 0.610 ND to 1.54 ND ND Detective rate (%) 37.5 50 0 0 Total Mean (μg/kg) 0.546 1.17 0.023 0.019 Medium (μg/kg) 0.251 0.055 ND ND Detective rate (%) 75.3 78.5 8.33 27.1 Abbreviations: BPA=bisphenol A; BPS=bisphenol S; BPF=bisphenol F; BPAF=bisphenol AF; LOD=limits of detection; ND=non-detected value. Table 1. Occurrence of BPA and its analogues in different composite Total Diet Study samples.
The EDIs of BPA, BPS, BPF, and BPAF for an average male adult are given in Figure 1. For BPA, the highest exposure was found in Henan (56.9 ng/kg body weight per day), while the lowest was found in Jilin (5.74 ng/kg body weight per day). Mean exposure to BPA was estimated to be 18.1 ng/kg body weight per day, significantly below the t-TDI (4 μg/kg body weight per day) recommended by the EFSA (2). The EDI of BPS in the Sixth TDS for an average Chinese male adult was 22.2 ng/kg body weight per day. Jiangsu (120 ng/kg body weight per day) and Fujian (114 ng/kg body weight per day) posed the two highest exposures in this TDS; while the exposure in Jilin residents (0.559 ng/kg body weight per day) was the lowest. BPF and BPAF presented dietary exposures of 0.485 ng/kg body weight per day and 0.384 ng/kg body weight per day, respectively.
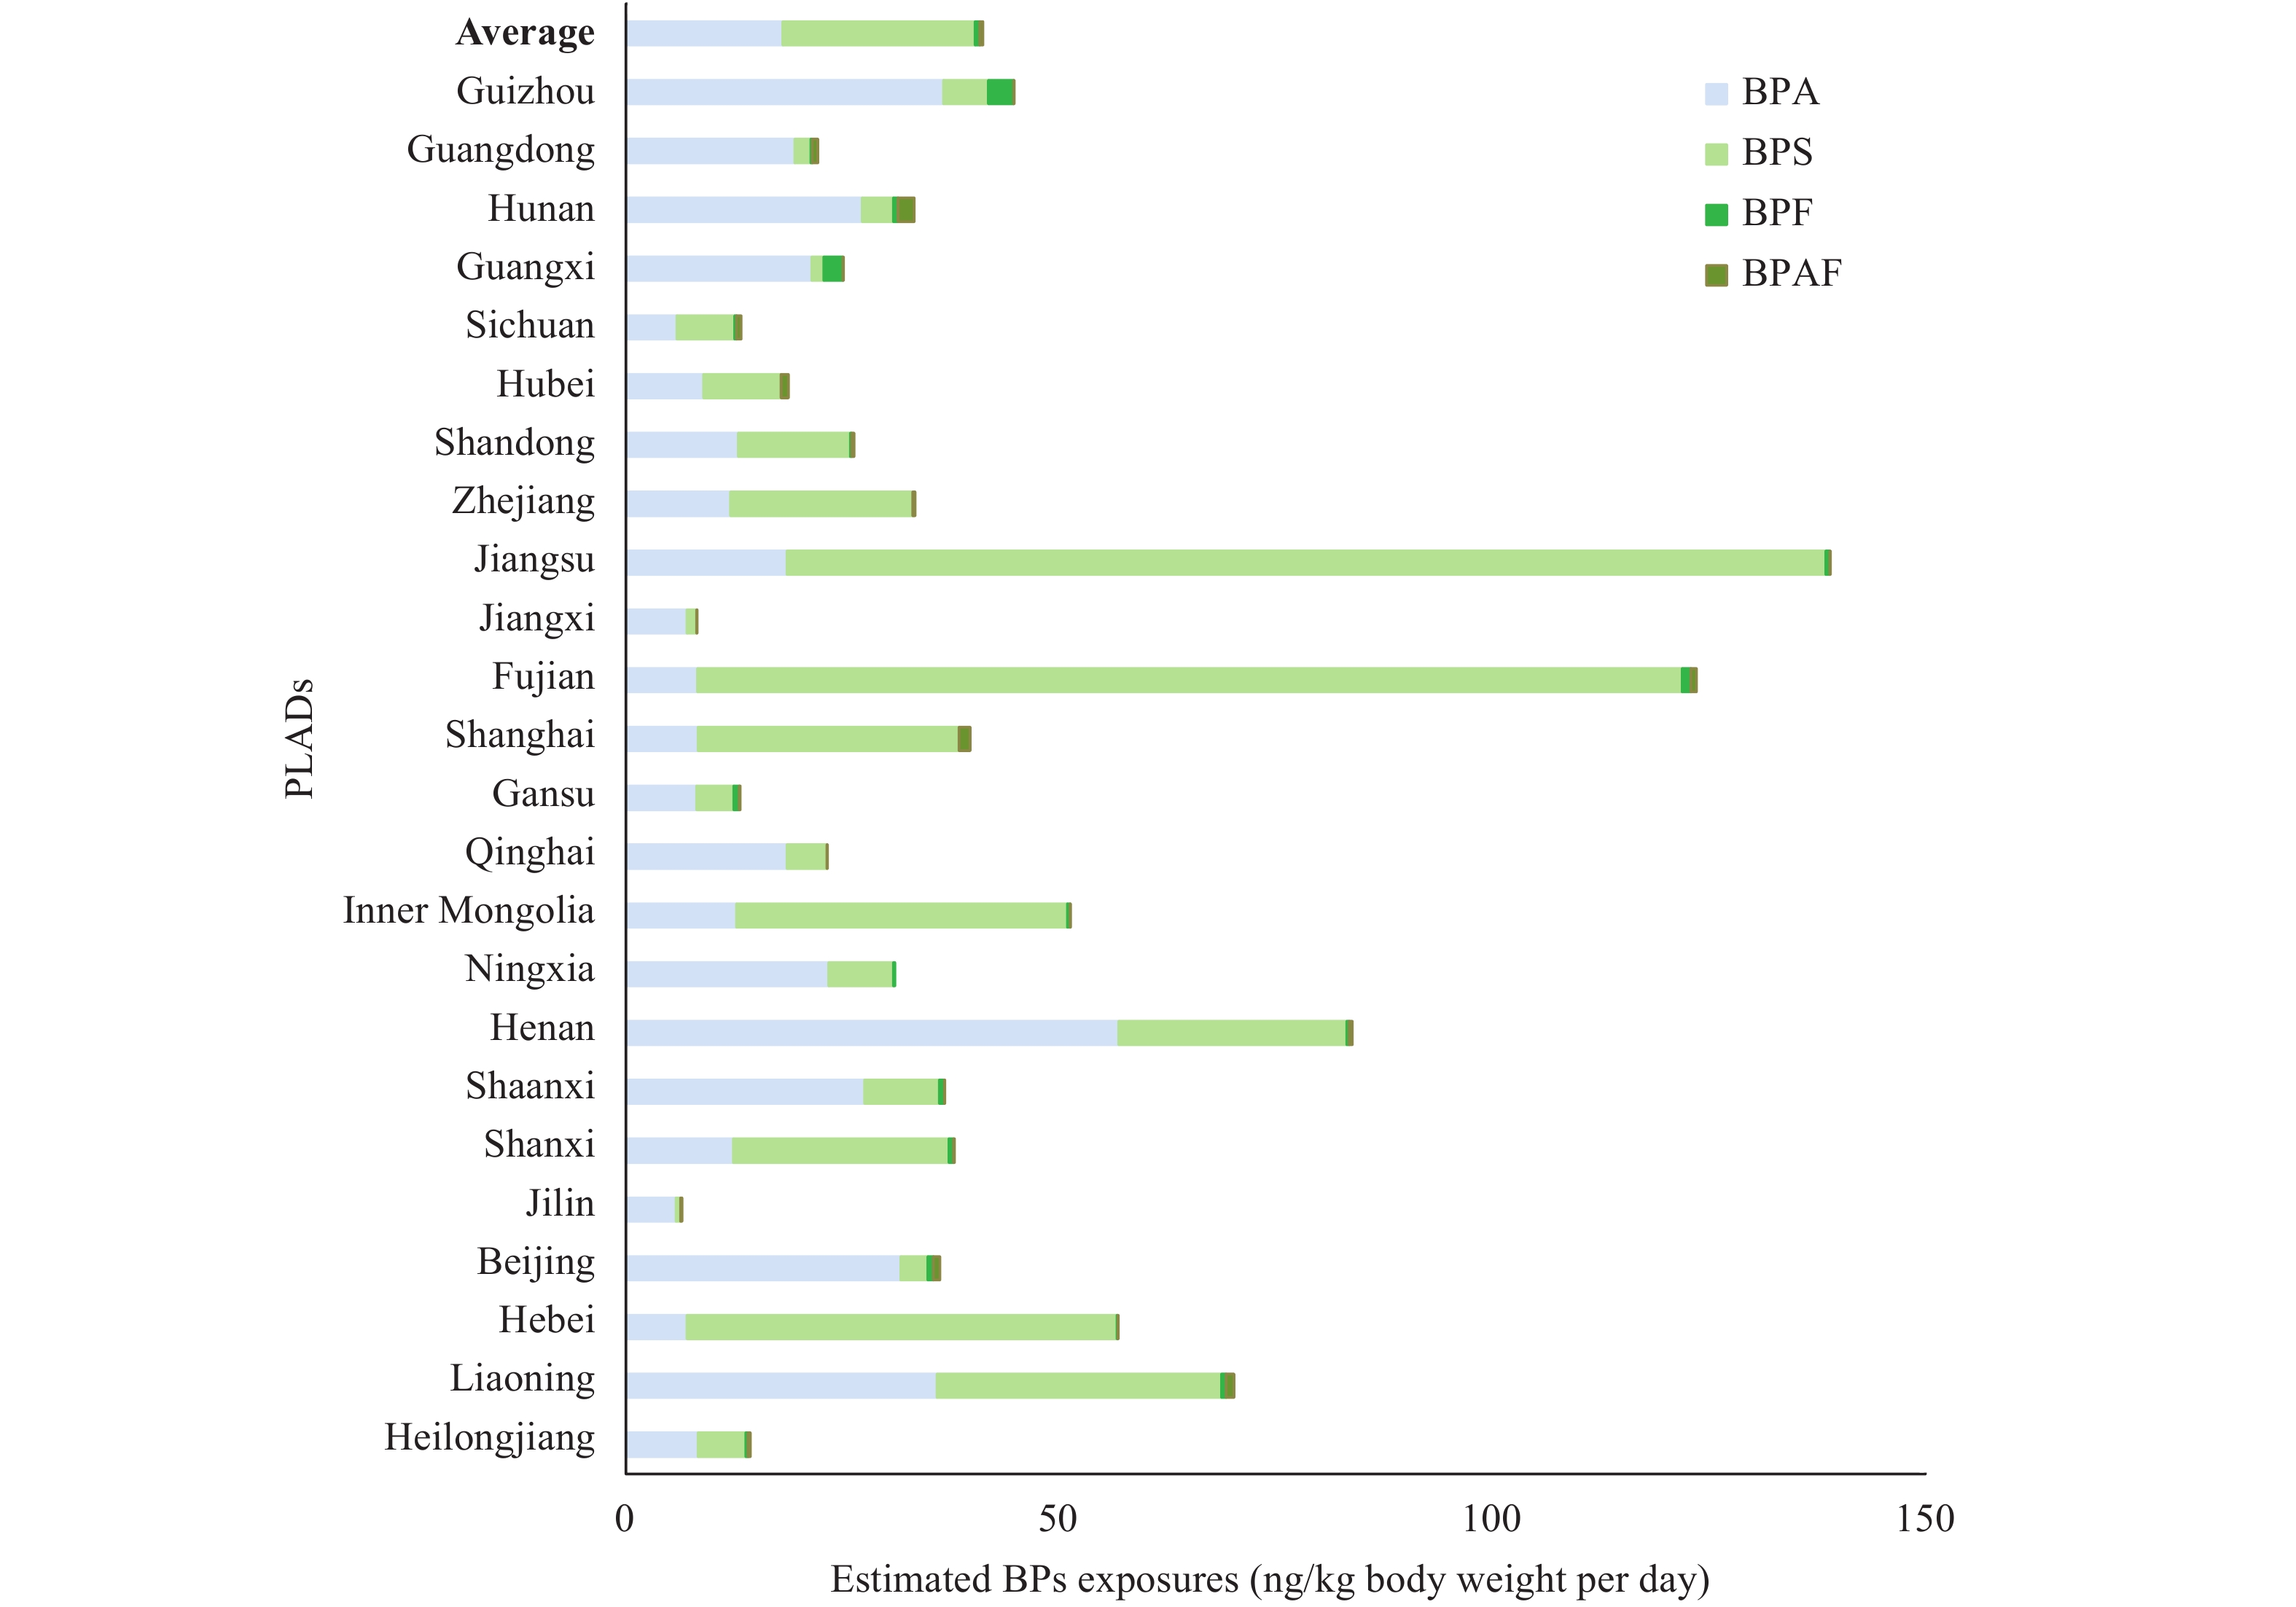 Figure 1.
EDI of BPA, BPS, BPF, and BPAF among sampling PLADs from the Sixth TDS.
Abbreviations: BPs=bisphenolic compounds; EDI=estimated daily intakes; BPA=bisphenol A; BPS=bisphenol S; BPF=bisphenol F; BPAF=bisphenol AF; PLADs=provincial-level administrative divisions; TDS=Total Diet Study.The contributions of different food categories to total EDI of BPs are shown in Figure 2. The main dietary contributors for BPA were cereals (40.3%), water and beverage (17.4%) as well as vegetables (13.7%). As for BPS, the dominant contribution food groups were cereals (31.4%), followed by meats (25.4%), legumes (11.7%), vegetables (11.7%) and water and beverages (8.76%). Legumes (41.2%), meats (20.7%), and fruits (11.7%) were the top three contributors of BPF. Exposure to BPAF was mainly from cereals (22.6%), aquatic foods (21.5%) and vegetables (21.2%).
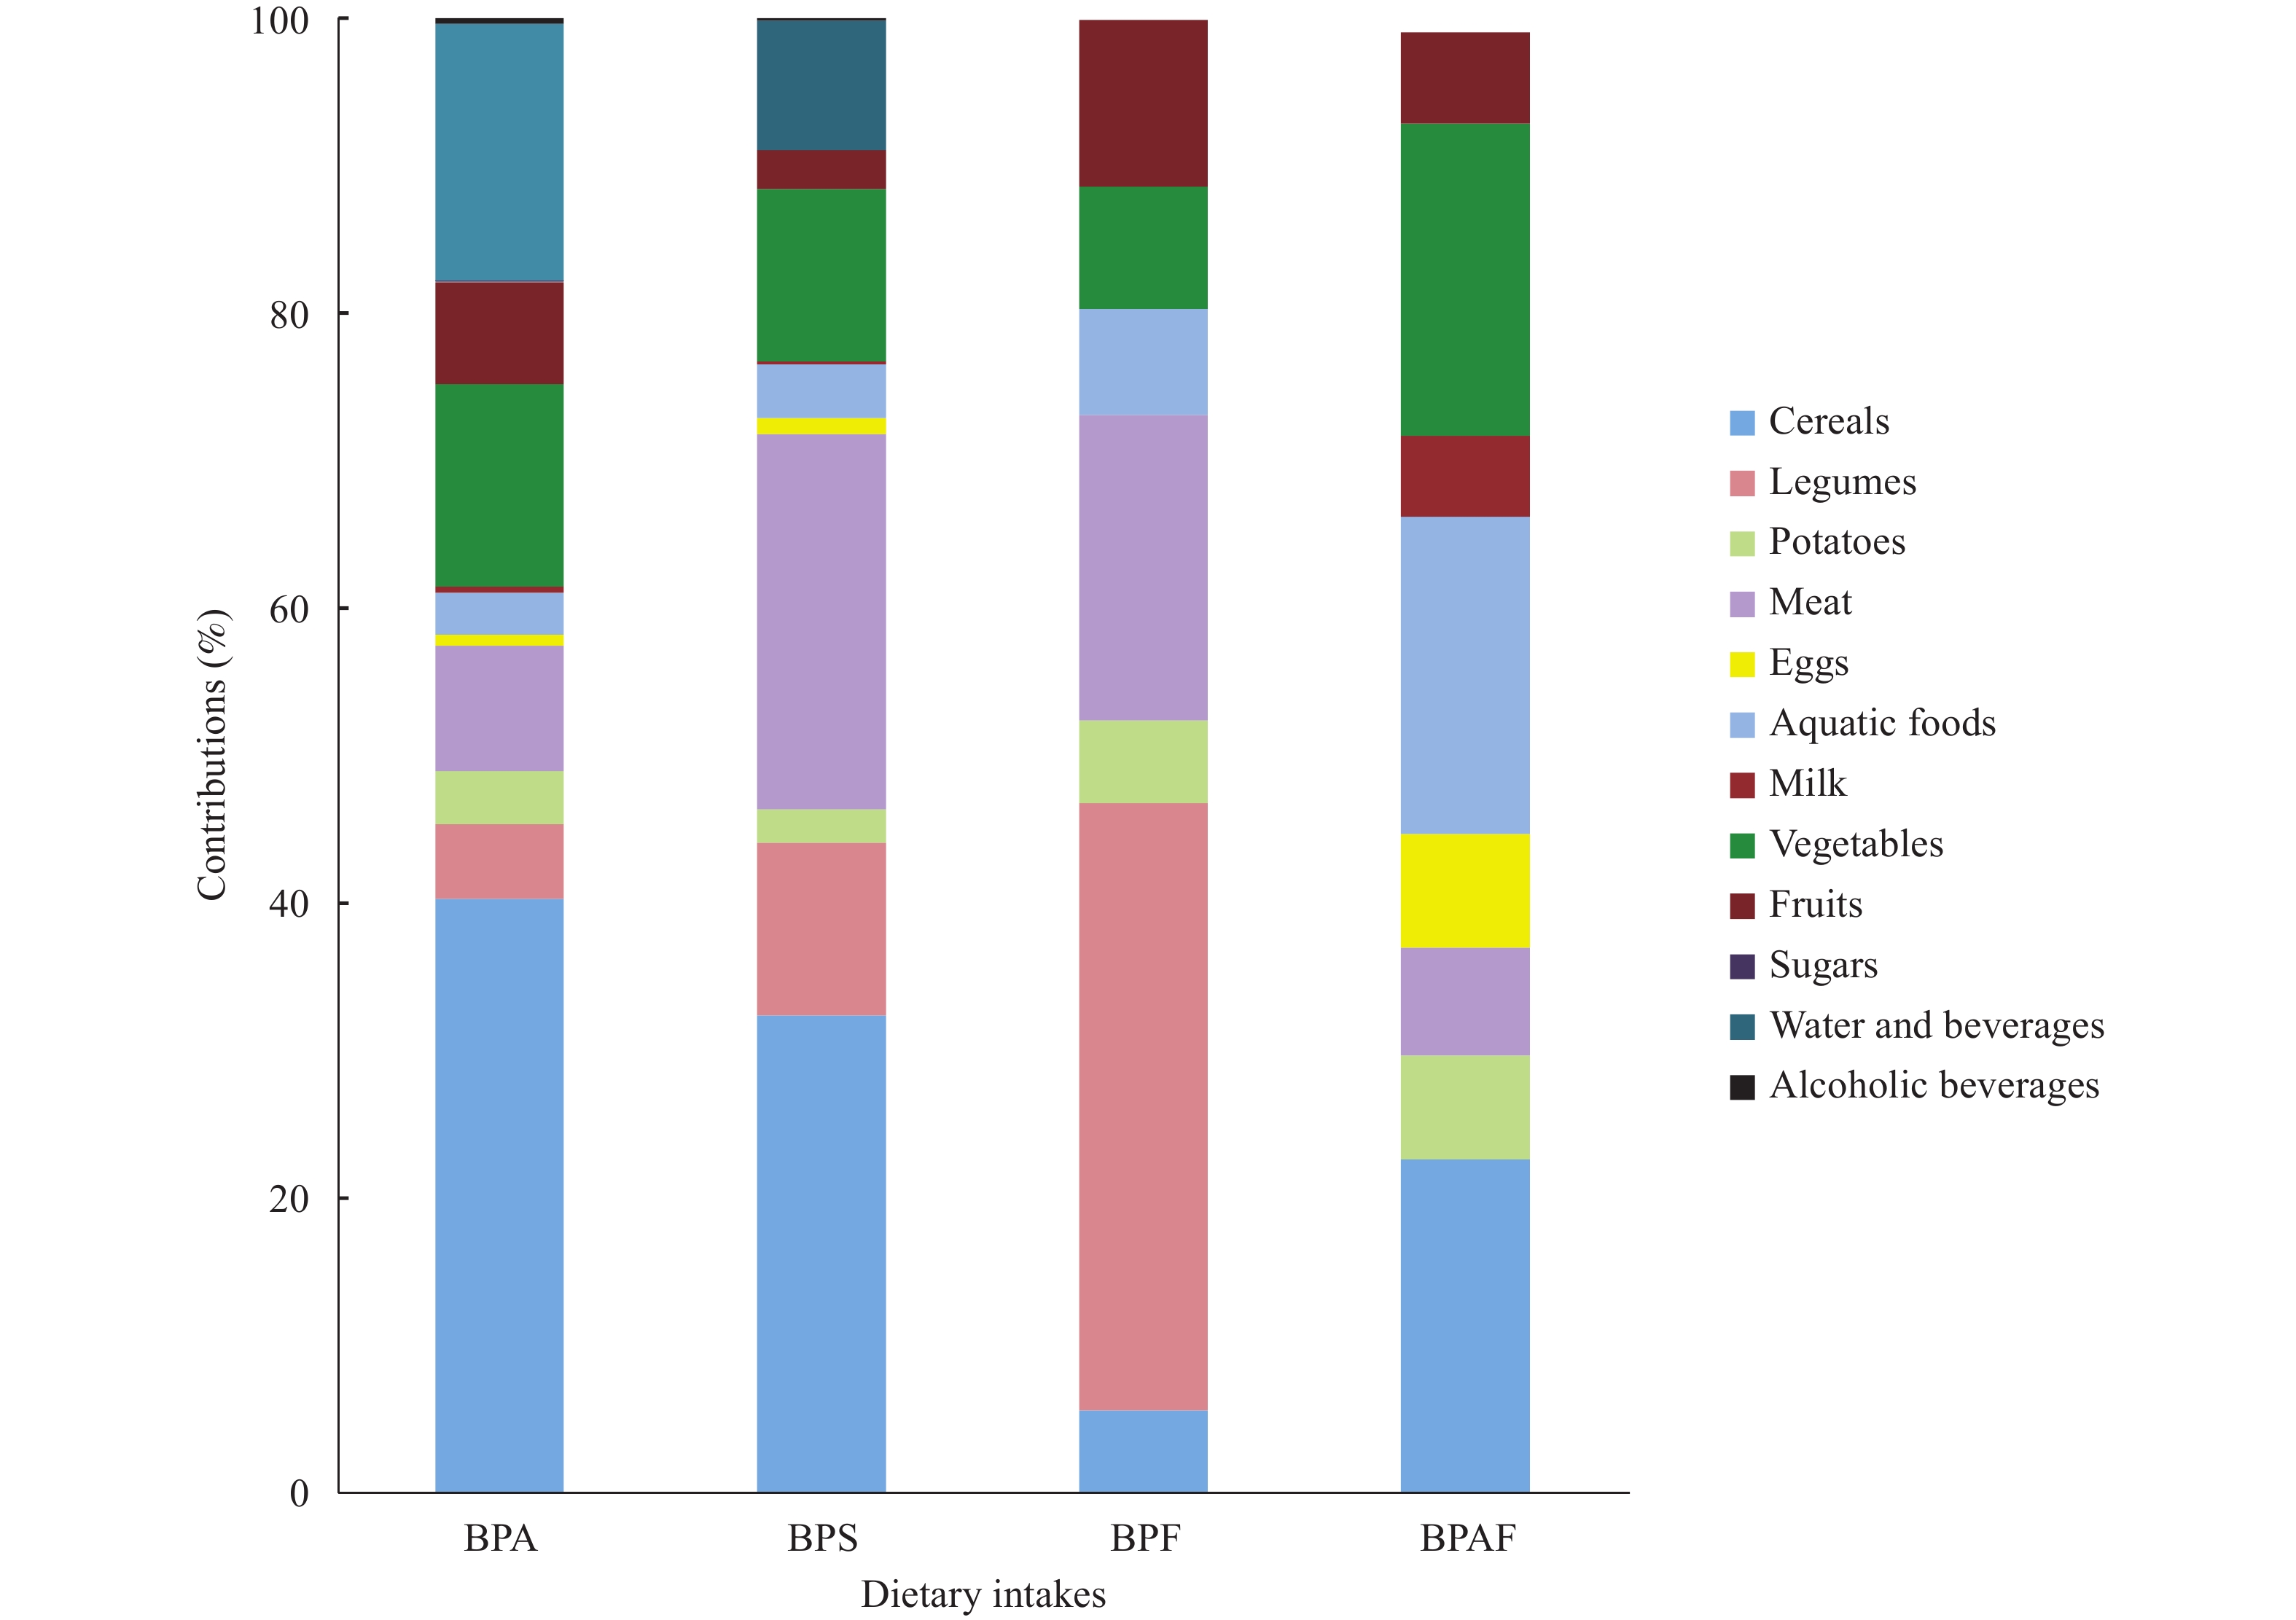 Figure 2.
Contribution (% of daily intake) of the food categories to dietary BP intakes for the general Chinese population.
Abbreviation: BP=bisphenolic compound; BPA=bisphenol A; BPS=bisphenol S; BPF=bisphenol F; BPAF=bisphenol AF. -
In the Sixth China TDS, BPS posed a comparable rate of detection as BPA, demonstrating the wide use of BPS. Compared to BPA and BPS, BPF and BPAF appeared to possess evidently lower rates of detection and detection levels. Similar trends were found in the Fifth China TDS (8) and several other reports (10–11).
Considering the similar endocrine disrupting properties and other toxicological effects of BPs, the exposure levels of BPA, BPS, BPF, and BPAF were summed up to assess the risks through dietary intake. The combined exposure levels (6.45–139 ng/kg body weight per day, Figure 1) were far below the t-TDI of BPA set by EFSA, which implied that the exposure to BPs for Chinese adults was safe.
BPs were concerning in the past three China TDSs (Supplementary Table S5). The BPA exposures in the Fourth and Fifth TDS were 43.0 ng/kg body weight per day (7 and 217 ng/kg body weight per day (8), respectively. The increase of BPA exposure might be attributed to the feverish growth of China’s BPA consumption from 2000 to 2014. The exposure to BPA in this study was significantly less than that in the Fifth TDS, which may be related to the measures and restrictions of BPA use in China. The exposures to BPS, BPF, and BPAF in the Sixth TDS were also lower than that in the Fifth one.
The most remarkable change was that the exposure to BPS exceeded BPA and became the most dominant BP in the Sixth TDS. In Fujian and Jiangsu, the only two provincial-level administrative divisions (PLADs) where BPs intakes were higher than 100 ng/kg body weight per day, BPS contributed more than 80% of the total BP exposure due to the high levels of BPS in meat from Fujian and cereals from Jiangsu.
It is noteworthy that Jilin implemented the “Restriction on Plastic Bags” from January 1, 2015, stipulating that the production and sale of non-degradable plastic shopping bags and plastic tableware were prohibited throughout the province. It has become China’s first PLAD to fully ban “plastics”. The EDIs of BPA and BPS in Jilin in this study were 5.74 ng/kg body weight per day and 0.559 ng/kg body weight per day, respectively, ranking lowest among the 24 PLADs. These values were lower by more than an order of magnitude than the results in the Fifth TDS (300 ng/kg body weight per day for BPA and 11.7 ng/kg body weight per day for BPS, respectively), indicating that the implementation of the restrictions affected the reduction of BPs contaminants.
The total dietary exposure to BPA in the Sixth China TDS (18.13 ng/kg body weight per day) was lower than that in France (42.4 ng/kg body weight per day) (12), Canada (52–81 ng/kg body weight per day) (6), the United States (44.6 ng/kg body weight per day) (11), and the EFSA (116–159 ng/kg body weight per day) (2). However, it was higher than that of a recent survey in United States (6.0 ng/kg body weight per day) (13). The diversity in food consumption habits may be a potential reason for the relatively high BPA exposure to these Western countries.
This study has several limitations. Only composite samples were analyzed for the dietary intake assessment of population in a given region, which could reveal realistic information by virtue of appropriate selection of the composite sample size and retesting of select individual samples. As for the samples with extremely high levels of contamination, the original individual samples can be assessed instead. The estimated BPs intake was based on a standard Chinese male adult (18–45 years). There was a lack of the dietary exposure data of 0–18 years-old people in this study. Furthermore, young-aged people and pregnant women are prone to be vulnerable to the endocrine disrupting compounds. The chlorinated derivatives of BPA and BPS reported higher estrogenic activity and other potential toxicities. It is necessary to continuously monitor the dietary exposure of the various BPs, including the chlorinated derivatives.
This study investigated the contamination of BPs in composite food samples from the Sixth China TDS during 2016–2019. BPA and BPS were detected in more than 75% of the food samples. Dietary intakes of BPs for Chinese adults were below the t-TDI, and the major contribution was from cereals, water and beverages, meat, and vegetables. The exposure of BPS in the Sixth TDS exceeded that of BPA. This implies the need to strengthen the monitoring of BPs in foodstuffs.
-
No conflicts of interest.
Food categories HL LN HE BJ JL SX SN HA NX NM QH GS SH FJ JX JS ZJ SD HB SC GX HN GD GZ Cereals 0.256 1.445 0.156 1.341 NDa 0.203 0.874 0.975 0.295 0.297 0.362 0.169 0.274 0.236 0.167 0.273 0.162 0.184 0.178 ND 0.256 1.445 0.156 1.341 Legumes ND 0.203 0.874 0.975 0.295 0.297 0.362 0.169 0.274 0.236 0.167 0.273 0.162 0.184 0.178 ND 0.207 ND 3.389 0.508 1.166 0.563 0.185 0.723 Potatoes 0.293 0.404 ND 0.219 0.698 0.239 0.187 0.636 0.212 0.185 1.352 0.271 0.271 0.274 0.277 0.222 0.206 0.233 0.29 0.294 0.249 0.474 0.215 0.393 Meat 0.213 5.815 0.383 0.356 0.453 1.104 0.175 1.737 0.228 0.784 3.629 1.665 0.926 0.249 ND 0.904 1.028 0.184 0.263 0.473 0.849 0.480 0.386 2.209 Eggs 0.207 0.544 0.453 ND ND ND 0.314 ND ND ND ND 0.246 0.286 ND 0.209 0.178 ND ND 0.251 0.177 ND 0.253 0.161 0.218 Aquatic foods 0.199 3.310 0.770 0.629 0.268 2.408 0.199 1.299 0.275 0.942 2.486 0.326 0.624 0.689 0.724 0.646 1.223 1.336 0.486 0.298 0.844 0.639 0.689 0.928 Milk 0.181 0.235 0.199 ND 0.025 ND ND ND ND ND ND ND 0.153 ND ND ND ND ND ND 0.168 0.385 0.215 0.236 0.249 Vegetables 0.153 0.201 0.167 0.453 ND 0.284 1.088 0.347 0.19 0.478 0.231 0.243 0.19 0.296 0.285 0.303 0.575 0.291 0.193 0.326 0.311 0.336 0.387 0.936 Fruits 0.432 0.247 0.606 0.468 0.261 1.498 0.22 1.056 2.601 0.383 ND 1.428 0.405 0.260 0.176 20.001 0.154 0.545 0.481 0.245 7.933 0.18 0.542 ND Sugars 1.648 0.654 2.034 0.520 0.780 0.530 ND 0.784 0.197 3.256 1.066 1.516 0.252 0.543 0.387 ND 0.669 1.511 0.338 2.699 0.845 0.549 0.357 0.538 Water and beverages ND 0.168 ND ND ND ND ND 1.569 1.534 ND ND ND ND ND ND ND ND 0.161 ND ND ND ND 0.763 ND Alcoholic beverages 0.209 0.188 ND ND 0.174 ND ND 0.403 0.356 0.610 ND ND ND ND ND 0.478 ND ND 0.159 ND ND ND ND 0.17 Note: ND: non-detected value, assigned 1/2 LOD in calculations.
Abbrreviations: HL=Heilongjiang; LN=Liaoning; HE=Hebei; BJ=Beijing; JL=Jilin; SX=Shanxi; SN=Shaanxi; HA=Henan; NX=Ningxia; NM=Inner Mongolia; QH=Qinghai; GS=Gansu; SH=Shanghai; FJ=Fujian; JX=Jiangxi; JS=Jiangsu; ZJ=Zhejiang; SD=Shandong; HB=Hubei; SC=Sichuan; GX=Gugangxi; HN=Hunan; GD=Guangdong; GZ=Guizhou; (the same below).Table S1. Levels of BPA in composites food samples from the Sixth China Total Diet Study (µg/kg).
Food categories HL LN HE BJ JL SX SN HA NX NM QH GS SH FJ JX JS ZJ SD HB SC GX HN GD GZ Cereals 0.129 0.316 1.983 0.068 ND 0.675 0.033 0.388 0.169 1.269 0.128 0.152 0.060 0.495 0.02 6.403 0.401 0.241 0.059 ND ND 0.032 ND 0.021 Legumes 1.213 1.408 1.045 0.031 0.025 0.074 1.169 0.160 2.543 1.639 0.021 0.466 0.304 3.145 ND 0.948 0.161 1.068 1.820 4.228 0.142 ND 1.907 0.076 Potatoes 0.106 0.243 0.161 0.029 ND 0.145 0.156 0.465 0.036 0.648 0.024 0.183 0.058 0.122 0.136 0.265 0.258 0.116 0.148 0.027 ND 0.201 0.154 0.208 Meat 0.203 8.638 6.669 ND ND 2.182 4.768 16.587 0.378 2.044 0.120 0.100 11.215 67.093 0.039 6.291 3.648 2.481 4.071 0.229 0.104 0.846 0.141 1.976 Eggs 0.073 0.044 0.619 0.314 0.025 0.029 ND 0.037 0.214 0.021 0.041 0.067 0.636 0.223 0.230 0.109 0.021 0.148 0.019 ND ND 0.074 0.028 0.022 Aquatic foods 2.159 0.598 6.344 0.743 0.091 1.921 1.501 2.622 0.026 0.757 1.506 0.131 4.586 3.127 0.023 0.509 0.087 0.644 1.621 0.369 0.034 0.427 ND 0.159 Milk 0.148 ND ND ND ND ND 0.052 ND 0.028 0.038 0.055 0.040 ND ND ND ND ND ND ND ND ND 0.033 ND ND Vegetables 0.073 0.968 0.173 0.056 0.02 0.223 0.483 0.201 0.794 1.807 0.033 0.036 0.093 0.608 0.022 1.156 0.869 0.106 0.148 0.129 0.02 0.029 0.072 0.124 Fruits 0.071 1.598 0.534 0.053 0.048 0.122 0.465 0.523 0.100 1.714 0.032 0.171 0.169 0.329 0.099 0.347 0.058 0.256 0.624 0.030 0.100 0.039 0.026 0.050 Sugars 0.114 0.029 0.069 0.022 0.019 0.021 0.021 0.021 0.016 0.103 0.02 ND ND ND ND ND 0.028 0.055 0.019 0.058 0.106 ND ND 0.036 Water and beverages ND 0.612 0.075 0.054 ND ND 0.027 ND ND 0.026 0.059 0.019 0.268 0.018 0.02 0.099 ND ND ND ND 0.028 ND ND ND Alcoholic beverages 0.016 0.029 0.018 0.019 ND ND 0.019 0.02 0.083 ND ND 1.537 ND ND ND ND ND 0.018 0.029 ND 0.024 ND 0.030 ND Note: ND: non-detected value, assigned 1/2 LOD in calculations. Table S2. Levels of BPS in composites food samples from the Sixth China Total Diet Study (µg/kg).
Food categories HL LN HE BJ JL SX SN HA NX NM QH GS SH FJ JX JS ZJ SD HB SC GX HN GD GZ Cereals ND ND ND ND ND ND ND ND ND ND ND ND ND ND ND ND ND ND ND ND ND ND ND 0.169 Legumes ND 0.184 ND 0.163 ND 0.444 0.383 ND ND ND ND 0.624 ND ND ND 0.288 ND 0.163 ND 0.192 1.064 ND ND ND Potatoes ND ND ND ND ND ND ND 0.186 ND ND ND ND ND ND ND ND ND ND ND ND ND ND ND ND Meat ND ND ND 0.261 ND ND ND ND 0.205 0.279 ND ND ND ND ND ND ND ND ND ND 0.168 0.209 ND ND Eggs ND ND ND ND ND ND ND ND ND ND ND ND ND ND ND ND ND ND ND ND ND ND ND ND Aquatic foods 0.169 ND ND ND ND ND ND ND ND ND ND ND ND ND ND ND ND ND ND ND ND ND 0.192 ND Milk ND ND ND ND ND ND ND ND ND ND ND ND ND ND ND ND ND ND ND ND ND ND ND ND Vegetables ND ND ND ND ND ND ND ND ND ND ND ND ND 0.16 ND ND ND ND ND ND 0.190 ND ND ND Fruits 0.169 ND 0.156 ND ND ND ND ND ND ND ND 0.449 ND ND ND ND ND ND ND ND ND ND ND ND Sugars 0.26 ND ND ND ND ND ND ND ND ND ND ND ND ND ND ND ND ND ND ND ND ND ND ND Water and beverages ND ND ND ND ND ND ND ND ND ND ND ND ND ND ND ND ND ND ND ND ND ND ND ND Alcoholic beverages ND ND ND ND ND ND ND ND ND ND ND ND ND ND ND ND ND ND ND ND ND ND ND ND Note: ND: non-detected value, assigned 0 in calculations. Table S3. Levels of BPF in composites food samples from the Sixth China Total Diet Study (µg/kg).
Food categories HL LN HE BJ JL SX SN HA NX NM QH GS SH FJ JX JS ZJ SD HB SC GX HN GD GZ Cereals ND ND ND 0.026 ND ND ND 0.015 ND ND ND ND 0.129 0.040 ND ND ND ND 0.02 0.015 ND ND 0.051 ND Legumes ND ND ND ND ND ND ND ND ND ND ND ND ND ND ND ND ND ND ND ND ND ND ND ND Potatoes ND 0.024 0.029 ND ND ND ND ND ND ND ND ND ND 0.016 0.019 0.018 0.018 ND ND ND ND ND 0.018 ND Meat ND 0.530 ND 0.019 ND ND ND ND ND ND 0.024 0.018 ND 0.015 ND ND 0.021 ND ND ND ND ND ND ND Eggs ND ND 0.030 0.038 0.017 ND ND ND ND ND ND 0.025 0.02 0.020 0.019 ND ND 0.017 0.2 ND ND 0.029 0.061 0.02 Aquatic foods ND 0.025 0.02 0.027 ND 0.015 0.017 ND ND 0.016 0.019 0.025 0.053 0.017 0.026 ND 0.026 0.044 0.796 0.029 0.029 1.751 0.022 0.025 Milk ND ND 0.015 ND ND ND 0.026 ND ND ND 0.016 ND ND ND ND ND ND ND ND ND ND ND ND ND Vegetables 0.041 0.036 ND 0.024 0.023 0.018 ND ND ND ND ND ND ND ND ND ND 0.02 0.026 ND 0.029 ND ND 0.023 ND Fruits 0.021 ND ND 0.021 ND 0.018 ND 0.015 ND ND 0.018 0.092 ND ND ND ND 0.025 0.052 0.175 0.108 ND ND ND ND Sugars 0.036 ND 0.02 ND ND ND ND ND ND 0.043 ND ND ND ND ND ND ND 0.021 ND 0.02 ND ND ND ND Water and beverages ND ND ND ND ND ND ND ND ND ND ND ND ND ND ND ND ND ND ND ND ND ND ND ND Alcoholic beverages ND ND ND ND ND ND ND ND ND ND ND ND ND ND ND ND ND ND ND ND ND ND ND ND Note: ND: non-detected value, assigned 0 in calculations. Table S4. Levels of BPAF in composites food samples from the Sixth China Total Diet Study (µg/kg).
Compound The Fourth TDS 2007 The Fifth TDS 2010−2012 The Sixth TDS (this study) 2016−2019 BPA 43 217 18.1 BPS − 25.6 22.2 BPF − 25.1 0.485 BPAF − 0.499 0.384 Note: “−” means not detected.
Abbrreviations: BPA=bisphenol A; BPS=bisphenol S; BPF=bisphenol F; BPAF=bisphenol AF; TDS=Total Diet Studys.Table S5. Estimated BPA and its analogues exposures in three Total Diet Studys (ng/kg body weight per day).
HTML
| Citation: |

|