

 Download:


-
Currently, countries with sufficient vaccine supply, such as Israel, are working towards a policy to promote booster vaccination. Israel began offering booster vaccines to the elderly on July 30, 2021 and offered these booster shots to the rest of the population starting on October 3, 2021 (1). The United States, Spain, Britain, China, and other countries have also reported planning to implement booster vaccinations.
One study of fully vaccinated over 60-year-olds in Israel found the rate of confirmed infection was lower in booster groups than in the two dose groups after 12 days, relative ratio: 11.3 (95% CI: 10.4–12.3) (2). China has administered more than 2.2 billion doses of COVID-19 vaccines as of October 6, 2021 (3), but still has a high risk of being attacked by variants of SARS-CoV-2 through international trade. More than 40 outbreaks, which were started with the high-risk population (HRPs), such as health workers and airport staff, have been reported in China. In the latest outbreaks in Nanjing City in Jiangsu Province, high transmissibility of the breakthrough infection of the Delta variant was reported among the more vaccinated population. This evidence may point out that the current vaccination status cannot address the challenge presented by the Delta variant independently. Accordingly, a booster vaccination is necessary for China to better cope with imported cases. Based on our previous studies, we developed a mathematical model (4) to estimate the effectiveness when getting a COVID-19 booster shot among HRPs in China.
-
Based on the natural history of COVID-19 and our previous studies (5-6), we developed a Susceptible-Exposed-Symptomatic-Asymptomatic-Recovered/Removed (SEIAR) model with R (version 4.1.0, R Foundation, Vienna, Austria) to predict the cumulative case outcome of booster vaccines on 50 million high-risk individuals (making up 1.43% of the total population), who were fully vaccinated. In the model, HRPs who had been fully vaccinated were divided into five categories: Vaccinated but still Susceptible (S) due to breakthrough infection, Exposed (E), Symptomatic (I), Asymptomatic (A), and Removed (R) including recovered and death. Booster vaccinated HRPs were also divided into five categories and denoted as S1, E1, I1, A1, and R1, respectively.
The model was based on the following assumptions:
a) Susceptible HRPs would be infected by contact with symptomatic/asymptomatic infections with a transmission relative rate of
$\beta $ .b) The latent period of an exposed person was
$ 1/\omega $ , the latent period of an asymptomatic person was$ 1/{\omega }{\text{'}} $ .c) Parameter p (0≤p≤1) gave the proportion of individuals who had asymptomatic infections.
d) The transmission rates of S were
$\beta $ and$\kappa \beta $ after effective contact with I and A (0≤$\kappa $ ≤1).e) Individuals in categories I and A were transferred into category R after an infectious period of
$1/\gamma $ and$1/\gamma{\text{'}} $ , respectively.f) Case fatality rate was 0 and was not simulated in the model because vaccines were highly protective against death.
g) We assumed that the infectivity and susceptibility would be reduced after vaccination (7-8). Vaccine efficacy against infectivity (VEI) and against susceptibility (VES) (7) due to booster vaccination were denoted as (1 - x) and (1 - y), respectively.
The flowchart of the booster vaccination SEIAR model was shown in Figure 1.
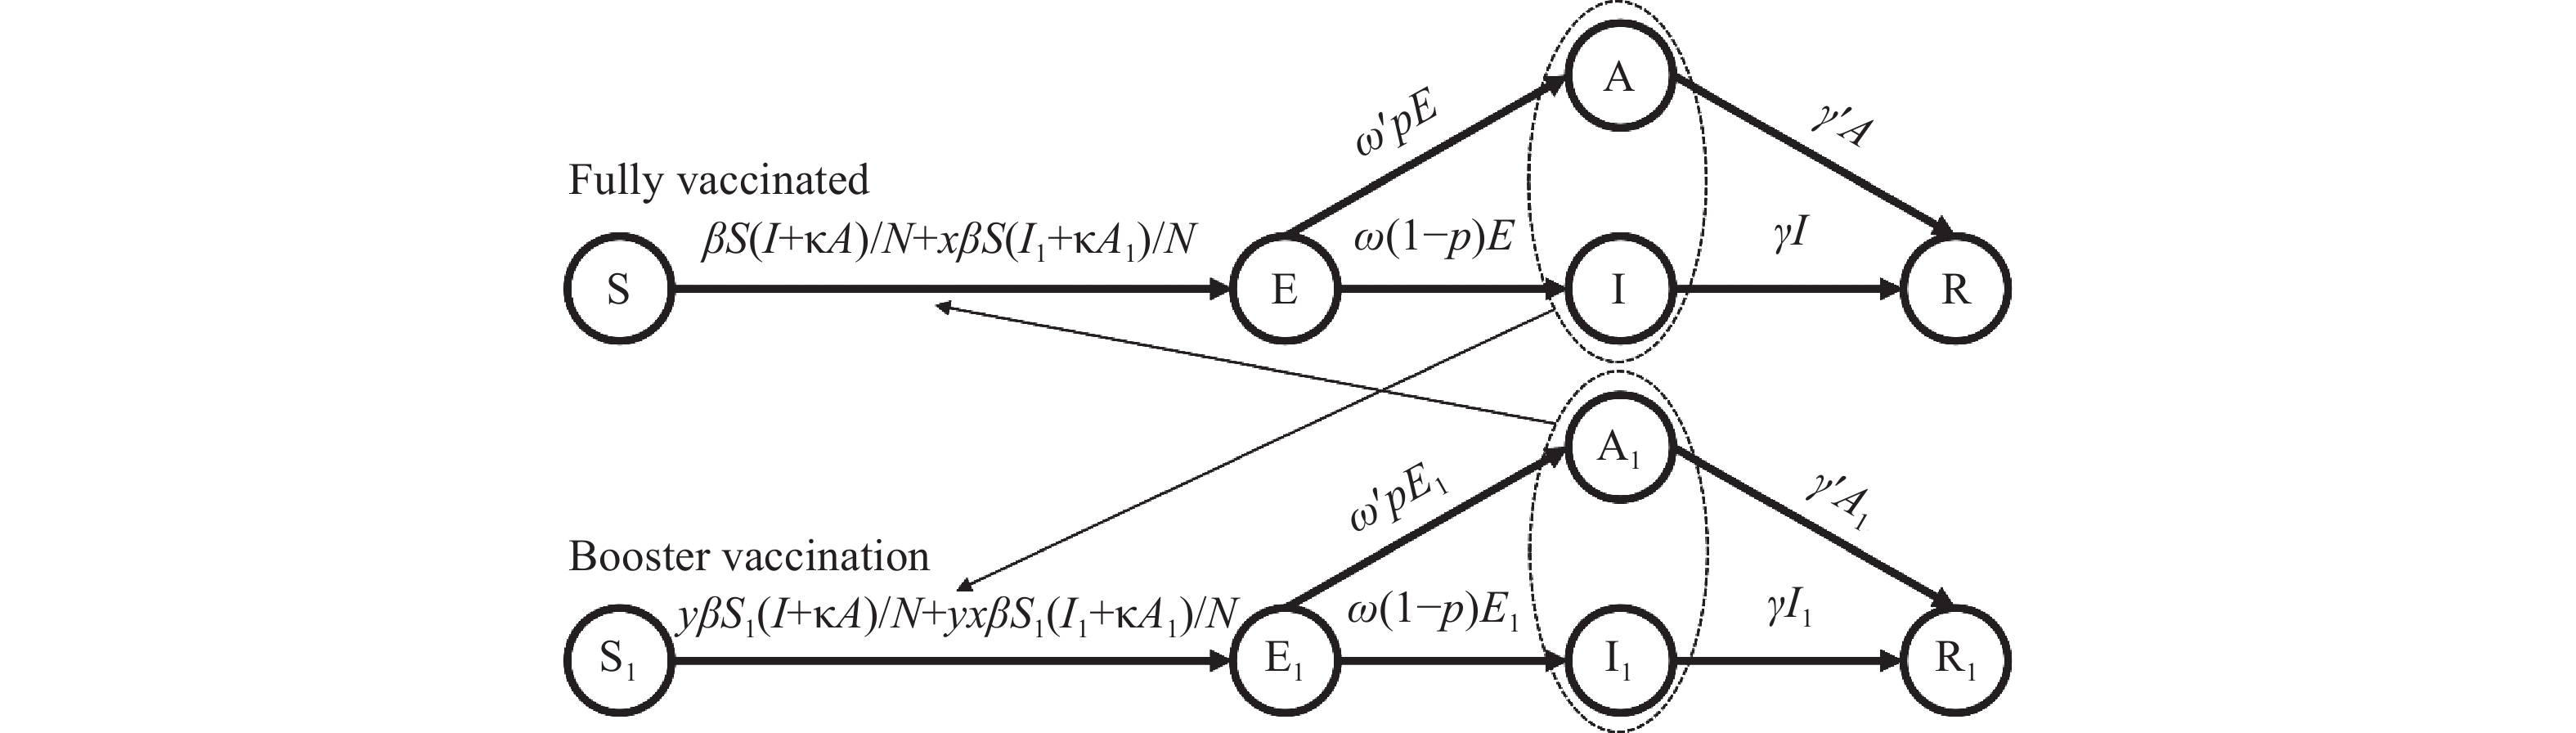 Figure 1.
Flowchart of the booster vaccination susceptible-exposed-symptomatic-asymptomatic-recovered/removed (SEIAR) model.
The equations of the model were as follows:
$$\begin{aligned} &\frac{dS}{dt}=-\left(\frac{\beta S\left(I+\kappa A\right)}{N}+\frac{x\beta S\left({I}_{1}+\kappa {A}_{1}\right)}{N}\right) \\ & \frac{dE}{dt}=\left(\frac{\beta S\left(I+\kappa A\right)}{N}+\frac{x\beta S\left({I}_{1}+\kappa {A}_{1}\right)}{N}\right)-p{\omega }^{\text{'}}E-\left(1-p\right)\omega E\\ &\frac{dI}{dt}=\left(1-p\right)\omega E-\gamma I\\ &\frac{dA}{dt}=p{\omega }^{\text{'}}E-{\gamma }^{\text{'}}A \\ & \frac{d{S}_{1}}{dt}=-\left(\frac{y\beta {S}_{1}\left(I+\kappa A\right)}{N}+\frac{xy\beta {S}_{1}\left({I}_{1}+\kappa {A}_{1}\right)}{N}\right) \end{aligned} $$ $$ \begin{aligned} &\frac{d{E}_{1}}{dt}=\left(\frac{y\beta {S}_{1}\left(I+\kappa A\right)}{N}+\frac{xy\beta {S}_{1}\left({I}_{1}+\kappa {A}_{1}\right)}{N}\right)-p{\omega }^{\text{'}}{E}_{1}-\left(1-p\right)\omega {E}_{1}\\ &\frac{d{I}_{1}}{dt}=\left(1-p\right)\omega {E}_{1}-\gamma {I}_{1}\\ & \frac{d{A}_{1}}{dt}=p{\omega }^{\text{'}}{E}_{1}-{\gamma }^{\text{'}}{A}_{1}\\ & \frac{d{R}_{1}}{dt}=\gamma {I}_{1}+{\gamma }^{\text{'}}{A}_{1} \\ & N=S+E+I+A+R+{S}_{1}+{E}_{1}+{I}_{1}+{A}_{1}+{R}_{1} \end{aligned}$$ N was defined as the total population. The left side of the equation indicated the instantaneous change rate of each department at time t.
-
Most parameter settings were based on our previous study (8). Considering the changes of the Delta variant, we edited the value of some parameters according to the latest research (9), including latent relative rates. The effective reproduction number (Reff ) was defined as the number of secondary cases an infected person can cause in a population after some interventions (8). In the study, Reff was adjusted from 4 to 6 based on the current immune barrier in China and
$ \beta $ was calculated by Reff ;$ 1-x $ and$ 1-y $ based on simulations;$ \omega $ and$ {\omega }^{\text{'}} $ were set as 0.33 and 0.20, respectively;$ \gamma $ was set as 0.2;$ {\gamma }^{\text{'}} $ was set as 0.1;$ \kappa $ was set as 0.6; and$ p $ was set as 0.5 (Supplementary Table S1).Based on our previous studies (4,8), the equation of Reff from the SEIAR model was shown as follows:
$$ {R}_{eff}=\frac{\beta }{\left(1-p\right)\omega +p{\omega }^{\text{'}}}\left(\frac{\left(1-p\right)\omega }{\gamma }+\frac{\kappa p{\omega }^{\text{'}}}{{\gamma }^{\text{'}}}\right) $$ -
In this study, 6 parameters were used to analyze the sensitivity of the model:
$ \kappa $ (0–1),$ \omega $ (0.056–0.500),$ {\omega }^{\text{'}} $ (0.056–0.500),$ \gamma $ (0.111-0.333),$ {\gamma }^{\text{'}} $ (0.048-1.000), and$ p $ (0–1). Each parameter was split into 20 values according to its range. -
Our model showed that under the current vaccination strategy, there still existed a high risk of a outbreak in Chinese HRPs. Further simulation showed that we could not prevent outbreaks when 80% of HRPs were covered with a booster vaccine, unless the effective reproduction number (Reff) =4.0 and the effectiveness of the booster (EB) was high, indicated by VES and VEI exceeding 90% (Figure 2A). Furthermore, when 90% of HRPs were covered with a booster vaccine, only an EB with the values of VES and VEI exceeding 60% were required (Figure 2B), and with 99% coverage of HRPs was needed for the VES and VEI to only have to exceed 50% (Figure 2C). However, VES and VEI both needed to exceed 70% at 99% coverage of HRPs under high transmissibility conditions (Reff=6.0) (Figure 2I).
To estimate the reality as closely as possible, we selected high transmissibility (Reff=6.0) and covered 99% of HRPs with booster shots and assumed the VES and VEI were both 50%. Cumulative cases did not seem to be sensitive to the six parameters (
$ \kappa $ ,$ \omega $ ,$ {\omega }^{\text{'}} $ ,$ \gamma $ ,$ {\gamma }^{\text{'}} $ ,$ p $ ), but the proportion of cases was sensitive to latent periods and the proportion of asymptomatic cases (Supplementary Figure S1).We adjusted parameters and re-ran the SEIAR model to simulate a different scenario, which presented a similar result (Supplementary Figure S2). Considering COVID-19 cases were regularly divided into confirmed cases and symptomatic cases, we also re-ran the SEIAR model to predict the dynamic evolution of COVID-19 with outcomes of confirmed cases and symptomatic cases (Supplementary Figures S3–S4). The results were consistent with our findings where cumulative cases were selected as the outcome index.
-
We used the SEIAR model to consider the infectivity of asymptomatic cases and previously described parameters to discover whether the hypotheses that had been put forward was feasible. All else being equal, low booster vaccine coverage cannot sustain the barrier of immunity, let alone against increased infectivity variant over time. Our finding suggests that the VES and VEI of both at least 70% are required when covering 99% of HRPs under high transmissibility (Reff =6.0). However, 90% coverage at equal conditions can generate a hundredfold increase, despite lower coverage of the booster vaccine.
Undoubtedly, current vaccines had high effectiveness to reduce severe and dead cases. However, it could not control the transmission of the Delta variant in China due to breakthrough infection. Two strategies, including improving the vaccine effectiveness (VE) and adding the booster dose among HRPs, should be simultaneously applied for controlling the high transmission of coronavirus variants. Therefore, it is essential to assess the VES and VEI of current vaccines for the booster. Considering substantial differences in VE, further application of booster shots in HRPs should be based on high VE to increase antibody concentrations, including selecting other kinds of vaccines and administration of booster doses (10).
This study was subject to some limitations. First, our model did not consider the transmission between HRPs and non-HRPs which was widely happening in current outbreaks. Second, although our model represents HRPs in China, our initial population size (N=50,000,000) did not consider the influence of occupation in which contact rates and susceptibility were different.
Under the current vaccination strategy, which could not control the transmission of the Delta variant in China due to breakthrough infection, there was still a high risk of outbreaks of HRPs in China. Therefore, we recommend booster vaccination in HRPs.
-
No conflicts of interest reported.
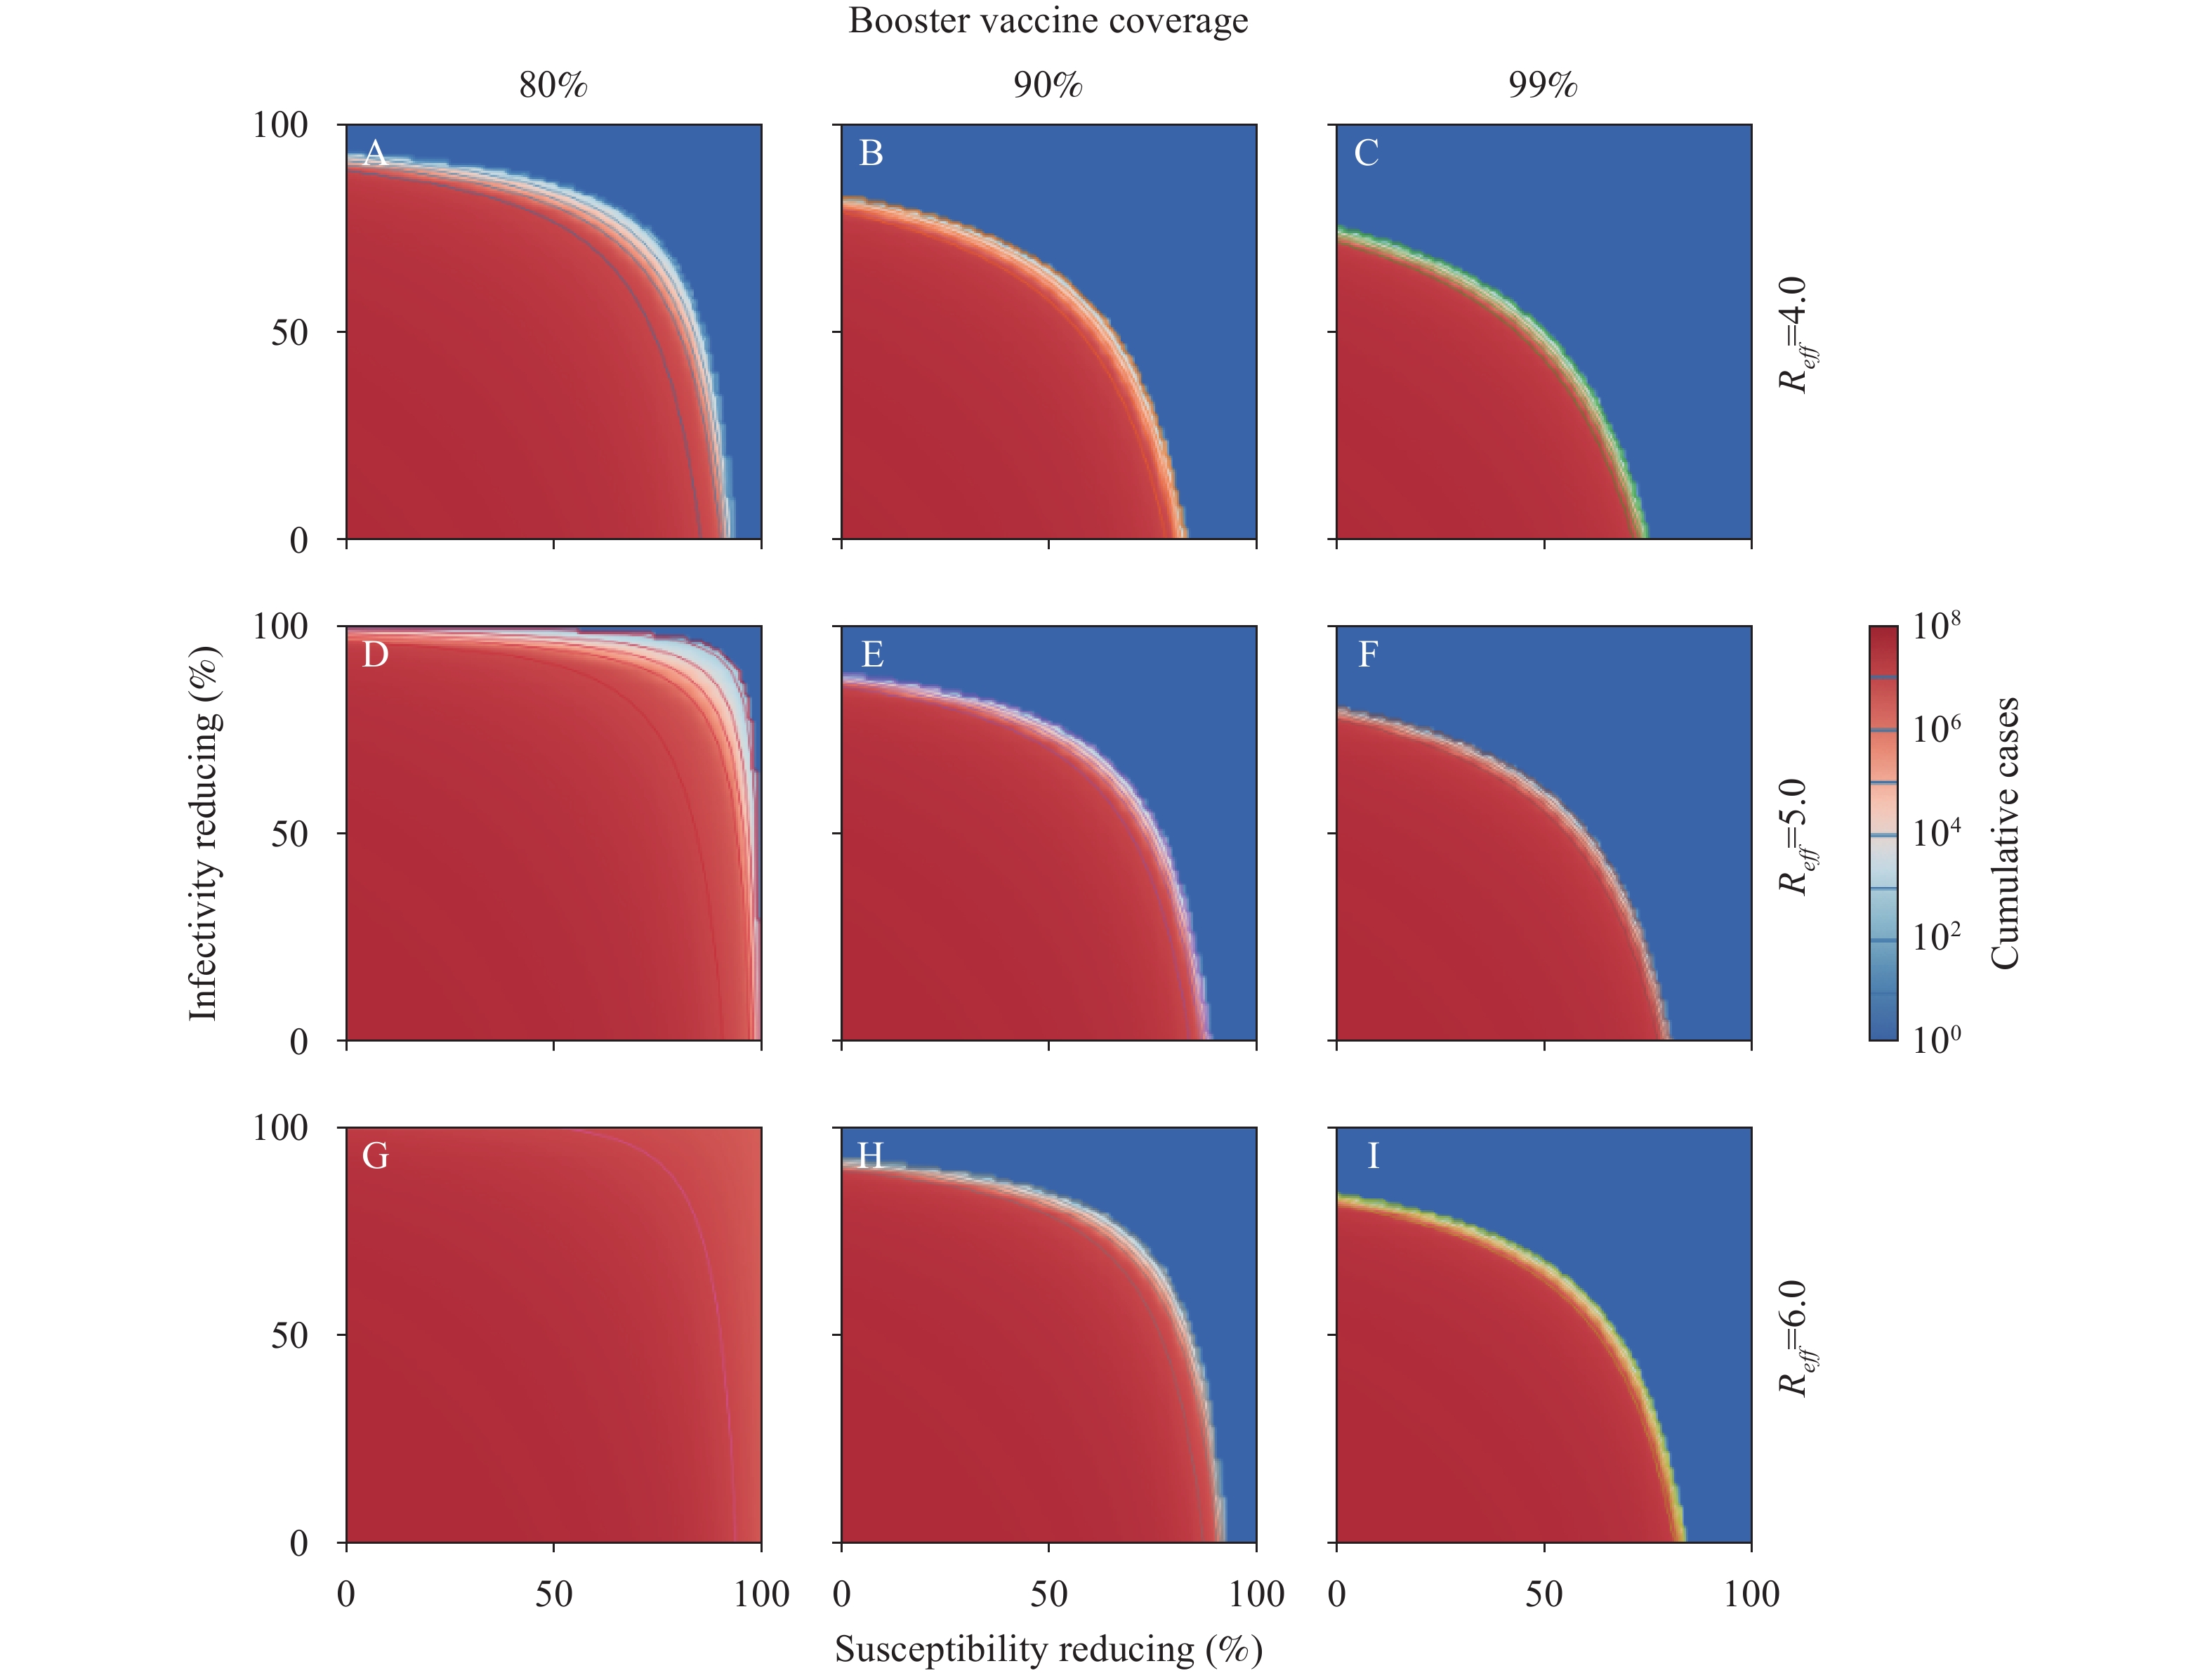 Figure 2.
Simulated cumulative cases of COVID-19 for different effective reproduction numbers (Reff) and booster vaccine coverage. (A) Booster vaccine coverage of 80% and Reff at 4.0, (B) Booster vaccine coverage of 90% and Reff at 4.0, (C) Booster vaccine coverage of 99% and Reff at 4.0, (D) Booster vaccine coverage of 80% and Reff at 5.0, (E) Booster vaccine coverage of 90% and Reff at 5.0, (F) Booster vaccine coverage of 99% and Reff at 5.0, (G) Booster vaccine coverage of 80% and Reff at 6.0, (H) Booster vaccine coverage of 90% and Reff at 6.0, (I) Booster vaccine coverage of 99% and Reff at 6.0.
Note: We estimate the effectiveness of booster shots in high-risk populations, simulated by setting Reff from 4 to 6 and booster vaccine coverage with 80%, 90%, and 99%, respectively. We assume that infectivity and susceptibility would be reduced after vaccination (7–8), with scenarios that booster vaccine can further reduce infectivity (0–100%) and susceptibility (0–100%). Logarithmic contour was adopted to display the outcome of this study because the outcome varies considerably between different conditions.
HTML
Model Development


Parameter Estimation


Sensitivity Analysis


| Citation: |

|