
 Download:


-
Latent tuberculosis infection (LTBI) refers to a chronic immune response to Mycobacterium tuberculosis antigens, without clinical or radiological evidence of active tuberculosis (ATB) (1). Prophylactic treatment of LTBI plays an increasingly pivotal role in TB control. It is estimated that 23% of the global population has LTBI (2), and the overall disease burden is relatively high in China. LTBI is a potential reservoir for ATB, with 5%–10% of the LTBI cases progressing to active disease. Therefore, LTBI treatment directly affects the global prevention of future TB infections. LTBI research largely relies on screening high-risk populations and developing targeted treatment strategies (3). Examining families and other close contacts of patients with ATB is warranted for the identification and management of LTBI (4–6).
Machine learning techniques such as support vector machines (SVM), random forest (RF), and artificial neural networks have been widely used in disease monitoring, diagnosis, and prognosis. These methods effectively detect novel patterns within existing datasets. In LTBI prediction, machine learning helps identify risk indicators that may remain undetected using conventional statistical approaches.
In this study, a survey and analysis of the close contacts of patients with TB in Henan Province were conducted. Five machine learning methods, namely, SVM, RF, decision tree (DT), logistic regression (LR), and multilayer perceptron (MLP), were used to predict LTBI. Their predictive accuracies were systematically compared to identify the optimal LTBI prediction framework. Furthermore, targeted interventions were proposed for high-risk populations identified using the best-performing model, enabling a proactive shift in TB prevention and control strategies.
HTML
-
This study used a univariate logistic regression analysis for variable screening. Based on the 10 events per variable criterion, which requires a minimum sample size of 10–15 times the number of variables, 19 factors were analyzed. The estimated incidence of LTBI among close contacts of patients with pulmonary TB was approximately 30%. Therefore, the minimum number of required outcome events was 10×19=190. Consequently, the calculated minimum sample size was 190/0.3=634 participants. Allowing for 20% loss to follow-up, 760 close contacts were enrolled. To facilitate enrollment, the final target sample size was set to 800.
Index cases were identified through the Tuberculosis Management Information System (the China Disease Control and Prevention Information System) as patients with ATB in Henan Province receiving treatment for 3–6 months in 2024. LTBI was defined as individuals who shared the same residence for at least 7 days with an ATB patient during the period from 3 months before the patient’s diagnosis to 14 days after diagnosis, and showed a strongly positive purified protein derivative (PPD) test result. Non-LTBI individuals were defined as those who were ruled out for both active and latent TB infection, with no more than one non-LTBI subject enrolled per patient as a study participant. A PPD test was performed according to the Chinese Guidelines for Preventive Treatment of Tuberculosis and the PPD results were recorded after 72 h. For PPD≥10 mm, ATB is ruled out based on the clinician’s diagnosis, and the individual is determined to have latent TB infection. For PPD<10 mm, if active and latent tuberculosis infection are ruled out based on the clinician’s diagnosis, the individual is classified as having a non-latent infection. LTBI cases were household contacts of patients with ATB (exposure≥7 days between 3 months pre- and 14 days post-diagnosis) with a strongly positive PPD test. Non-LTBI controls were excluded for both ATB and LTBI, with up to one control enrolled per patient. Close contacts of these index cases were recruited after written informed consent was obtained. After excluding individuals owing to employment-related migration, refusal to participate, or incomplete data during the field investigations, 795 close contacts were finally included. All contacts underwent tuberculin PPD testing and TB screening and completed structured questionnaires at designated TB care facilities. Questionnaire-derived variables and system-recorded clinical parameters of the index cases were analyzed as potential predictors of LTBI among close contacts.
The Delphi method was used to design the two structured questionnaires. First, the Index Case Questionnaire was completed by designated institutions based on medical records including demographic, diagnosis, and treatment information. The second questionnaire was completed by the investigator during in-person interviews with close contacts, supplemented by medical records retrieved from the case-reporting information system. The questionnaire included questions regarding sociodemographic characteristics, lifestyle habits, exposure history, and TB-related knowledge. If close contacts were unable to participate because of physical limitations, family members or guardians completed the questionnaire on their behalf. Provincial TB control institutions conducted city-level data verification, followed by double data entry using Epi Data 3.1 software (EpiData Association, Odense, Denmark). The finalized databases were securely transmitted to provincial authorities via encrypted emails.
A database was established using EpiData 3.1, with data collected in Microsoft Excel (Microsoft Office Home and Student 2019, Microsoft Corporation, Redmond, USA). Data analysis was conducted using SPSS Modeler (version 18.0; IBM Corp, Armonk, NY, USA) and SPSS 27.0. Qualitative data were analyzed using the chi-squared test followed by univariate logistic regression analysis. Machine learning models including SVM, RF, DT, MLP, and LR were developed to predict LTBI. The model performance was evaluated using the mean squared error (MSE) and coefficient of determination (R2). A lower MAE and higher R2 indicated superior predictive accuracy. The predictive values of these models were further assessed using receiver operating characteristic (ROC) curves and F1-scores, with external validation of the test set. The MSE, R2, and area under the ROC curve (AUC) were calculated using SPSS 27.0, integrated with Python 3.12. A two-tailed test was applied, with statistical significance set at α=0.05.
-
After excluding individuals with missing information owing to migrant work or refusal to participate in the field investigation, 795 close contacts were included. LTBI accounted for 50.44% (n=401) of the close contacts. Significant differences (P<0.05) were observed between the LTBI and non-LTBI groups in terms of marital status, educational level, occupational type, residential area type, per capita living space, household registration type, annual household income, frequency of participation in group activities, type of contact with index cases, Bacille Calmette–Guérin (BCG) scar, weekly frequency of sleep deprivation, population classification of index cases, key population classification of index cases, and etiological results of index cases (Table 1).
Variant LTBI
(n=401)Composition
ratio (%)non-LTBI
(n=394)Composition
ratio (%)OR (95% CI) P VIF Sex 0.985 1.482 Male 157 39.2 154 39.1 Female 244 60.8 240 60.9 0.997 (0.750, 1.326) Age groups (years) 0.065 1.487 15–18 12 3.0 11 2.8 19–60 312 77.8 280 71.1 1.021 (0.444, 2.352) 0.960 ≥60 77 19.2 103 26.1 0.685 (0.287, 1.635) 0.394 BMI (kg/m2) 0.971 1.111 18.5–23.9 228 56.9 227 57.6 <18.5 19 4.7 19 4.8 0.996 (0.514, 1.930) 0.990 ≥24 154 38.4 148 37.6 1.036 (0.774, 1.386) 0.812 Marital status <0.001 1.679 Unmarried 81 20.2 30 7.6 Married 310 77.1 350 88.8 0.328 (0.210, 0.512) <0.001 Divorced/widowed 10 2.5 14 3.6 0.265 (0.106, 0.659) 0.004 Education level <0.001 1.599 Illiterate 36 9.0 41 10.4 Primary/junior high school 185 52.5 232 58.9 0.908 (0.558, 1.479) 0.699 High school and above 180 37.9 121 30.7 1.694 (1.024, 2.803) 0.040 Careers <0.001 1.338 Other 84 20.9 97 24.6 Farmer 163 40.6 210 53.3 0.896 (0.627, 1.280) 0.547 Student/teacher 77 19.2 24 6.1 3.705 (2.152, 6.379) <0.001 Healthcare/detainee 19 4.7 7 1.8 3.134 (1.256, 7.822) 0.014 Homemaker/unemployed 58 14.5 56 14.2 1.196 (0.748, 1.912) 0.455 Labor intensity 0.488 1.350 Light 261 65.1 248 62.9 Moderate 128 31.9 138 35.0 0.881 (0.655, 1.186) 0.655 Heavy 12 3.0 8 2.0 1.425 (0.573, 3.546) 0.573 Residence type 0.019 1.508 Rural 206 51.4 235 59.6 Urban 195 48.6 159 40.4 1.399 (1.057, 1.853) Per capita living area (m2) <0.001 1.505 ≥20 320 79.8 349 88.6 <20 81 20.2 45 11.4 1.963 (1.323, 2.913) Household registration type <0.001 1.298 Local residence 319 79.6 349 88.6 Migrant population 82 20.4 45 11.4 1.994 (1.344, 2.956) Annual household income (CNY) 0.032 1.362 <30,000 179 44.6 204 51.8 30,000–50,000 143 35.7 107 27.2 1.523 (1.105, 2.100) 0.010 >50,000 79 19.7 83 21.1 1.085 (0.751, 1.567) 0.665 Exposure to dust 0.489 1.355 No 382 95.3 371 94.2 Yes 19 4.7 23 5.8 0.802 (0.430, 1.498) Daily ventilation frequency 0.063 1.180 0–1 time 118 29.4 106 26.9 2–3 times 89 22.2 93 23.6 0.860 (0.581, 1.272) 0.449 >3 times 190 47.4 180 45.7 0.948 (0.680, 1.322) 0.754 None 4 1.0 15 3.8 0.240 (0.077, 0.744) 0.013 Frequency of group activity participation per week <0.001 1.763 Low 259 64.6 321 81.5 Moderate 87 21.7 61 15.5 1.768 (1.226, 2.549) 0.002 High 55 13.7 12 3.0 5.681 (2.979, 10.833) <0.001 Contact type <0.001 2.578 Household 292 73.7 348 90.2 Neighbor 13 3.3 10 2.6 1.549 (0.670, 3.585) 0.306 Relative 16 4.0 15 3.9 1.271 (0.618, 2.615) 0.514 Colleague/classmate 56 14.1 7 1.8 9.534 (4.280, 21.240) <0.001 Other 19 4.8 6 1.6 3.774 (1.488, 9.574) 0.005 Health education received 0.996 1.247 Yes 225 56.1 221 56.1 No 176 43.9 173 43.9 0.999 (0.755, 1.322) BCG scar <0.001 1.150 Present 314 78.3 263 66.8 Absent 87 21.7 131 33.2 0.556 (0.405, 0.764) Smoking status 0.312 1.106 Never 179 44.6 202 51.3 Occasional 5 1.2 6 1.5 0.940 (0.282, 3.134) 0.920 Frequent 75 18.7 56 14.2 1.511 (1.013, 2.256) 0.043 Quit smoking 10 2.5 8 2.0 1.411 (0.545, 3.652) 0.478 Passive smoking 132 32.9 122 31.0 1.221 (0.888, 1.678) 0.218 Weekly frequency of sleep deprivation <0.001 1.291 None 242 60.3 291 73.9 1–2 times 56 14.0 48 12.2 1.403 (0.920, 2.138) 0.115 3–5 times 53 13.2 35 8.9 1.821 (1.150, 2.884) 0.011 >5 times 50 12.5 20 5.1 3.006 (1.742, 5.189) <0.001 Comorbidities 0.867 3.256 None 310 77.3 308 78.2 One 75 18.7 67 17.0 1.112 (0.772, 1.603) 0.568 Two 12 3.0 15 3.8 0.795 (0.366, 1.726) 0.562 Three or more 4 1.0 4 1.0 0.994 (0.246, 4.008) 0.993 Index case variables (source of infection status) Sex 0.942 1.103 Male 292 72.8 286 72.6 Female 109 27.2 108 27.4 0.989 (0.724, 1.351) 0.942 Occupation <0.001 1.462 Other 24 6.0 28 7.1 Farmer 232 57.9 270 68.5 1.002 (0.565, 1.778) 0.993 Student/teacher 88 21.9 36 9.1 2.852 (1.461, 5.568) 0.002 Homemaker/unemployed 52 13.0 60 15.2 1.011 (0.523, 1.956) 0.974 Healthcare worker 5 1.2 0 0.0 >100 0.999 Key population classification <0.001 1.591 No 261 65.1 304 77.2 Diabetes 41 10.2 44 11.2 1.085 (0.688, 1.713) 0.725 Silicosis 9 2.2 6 1.5 1.747 (0.614, 4.973) 0.296 School or childcare staff 79 19.7 36 9.1 2.556 (1.667, 3.919) <0.001 Other 11 2.7 4 1.0 3.203 (1.008, 10.179) 0.048 Diagnosis delay 0.063 1.178 No delay 155 38.7 178 45.2 Delayed 246 61.3 216 54.8 1.308 (0.986, 1.735) Treatment category 0.179 1.119 New case 356 88.8 361 91.6 Retreatment case 45 11.2 33 8.4 1.383 (0.862, 2.218) Etiological results 0.027 1.126 Negative/not tested 96 23.9 122 31.0 Positive 305 76.1 272 69.0 1.425 (1.042, 1.950) Note: Bold number means statistical significance.
Abbreviation: OR=odds ratio; CI=confidence interval; BCG=Bacille Calmette–Guérin; CNY=Chinese Yuan; LTBI=latent tuberculosis infection; VIF=variance inflation factor.Table 1. Comparison of the baseline characteristics of close contacts.
-
Using LTBI status (binary outcome) as the dependent variable and those with statistical significance from the univariate analysis (
Supplementary Table S1 ) as independent variables, the dataset was divided via a random seed method into training and test sets in a 6∶4 ratio. Risk prediction models were developed using the following algorithms: LR: Binomial logistic regression with forward stepwise selection. DT: C5.0 algorithm with default pruning parameters. RF: 100 decision trees (ntree=100) with Gini impurity used for node splitting. SVM: Regularization parameter set to 10, and regression precision tolerance=0.1. MLP: Automatically determined number of hidden layer neurons, hyperbolic tangent activation function for hidden layers, and softmax activation for the output layer. -
The corresponding evaluation metrics were calculated using Python 3.12. MSE and R2 were used to evaluate the prediction accuracy of the models generated using each classifier algorithm. MSE was used to measure the model's prediction error by calculating the square of the difference between the predicted and true values averaged across all samples. A smaller MSE suggests a better prediction performance. R2 measures the variance in the dependent variable accounted for by the model, suggesting its goodness of fit. The R2 values vary between 0 and 1, with values closer to 1 indicating a superior fit and better explanatory ability.
Models with a lower MSE and higher R2 were deemed more precise. The prediction accuracies in descending order were as follows: SVM, RF, C5.0 (DT model), LR, and MLP. Classifier performance was further evaluated using sensitivity, specificity, and accuracy, with higher values indicating better performance. The SVM model outperformed the other algorithms in terms of these metrics (Table 2).
Model Training set Test set MSE R2 Sensitivity Specificity Accuracy Sensitivity Specificity Accuracy LR 0.229 0.086 0.702 0.601 0.627 0.629 0.583 0.591 C5.0 0.197 0.215 0.734 0.730 0.732 0.644 0.689 0.665 RF 0.165 0.342 0.891 0.712 0.779 0.536 0.656 0.665 SVM 0.121 0.517 0.888 0.831 0.859 0.659 0.711 0.683 MLP 0.233 0.073 0.662 0.581 0.602 0.621 0.596 0.624 Abbreviation: MSE=mean squared error; LR=logistic regression; RF=random forest; SVM=support vector machines; MLP=multilayer perceptron. Table 2. Evaluation table of each classifier algorithm prediction model in the training set.
-
The AUC and F1-scores were used as the overall evaluation metrics to assess the model performance. The AUC is used to measure the overall discriminative performance of the classifier. The AUC value ranges from 0 to 1, with values closer to 1 suggesting better model performance. An AUC value of 0.5 indicates that the predictive ability of the model is equivalent to random guessing. The closer the ROC curve is to the upper left corner, the better the predictive value.
The F1-score is the reconciled average of precision (positive predictive value) and recall (sensitivity), offering a comprehensive measure of performance. In the case of an imbalanced dataset, the F1 score accounts for both false positives and false negatives. The score ranges from 0 to 1, with higher values indicating better comprehensive performance.
In this study, the SVM model achieved the highest performance in terms of both AUC and F1 scores, with values of 0.921 and 0.858, respectively, for internal validation, and 0.752 and 0.694, respectively, for external validation. Overall, the SVM model exhibited the best predictive performance (
Supplementary Table S2 ).As shown in Figure 1, the SVM model consistently yielded higher ROC curves in both the training and test datasets, indicating its superior classification performance compared with the other models. The overlapping ROC curves of the MLP and LR models suggest comparable performance. Notably, the RF and C5.0 DT models demonstrated divergent trends; in the training set, RF outperformed C5.0, whereas in the test set, C5.0 outperformed RF. This difference could be attributed to the small sample size of the test set.
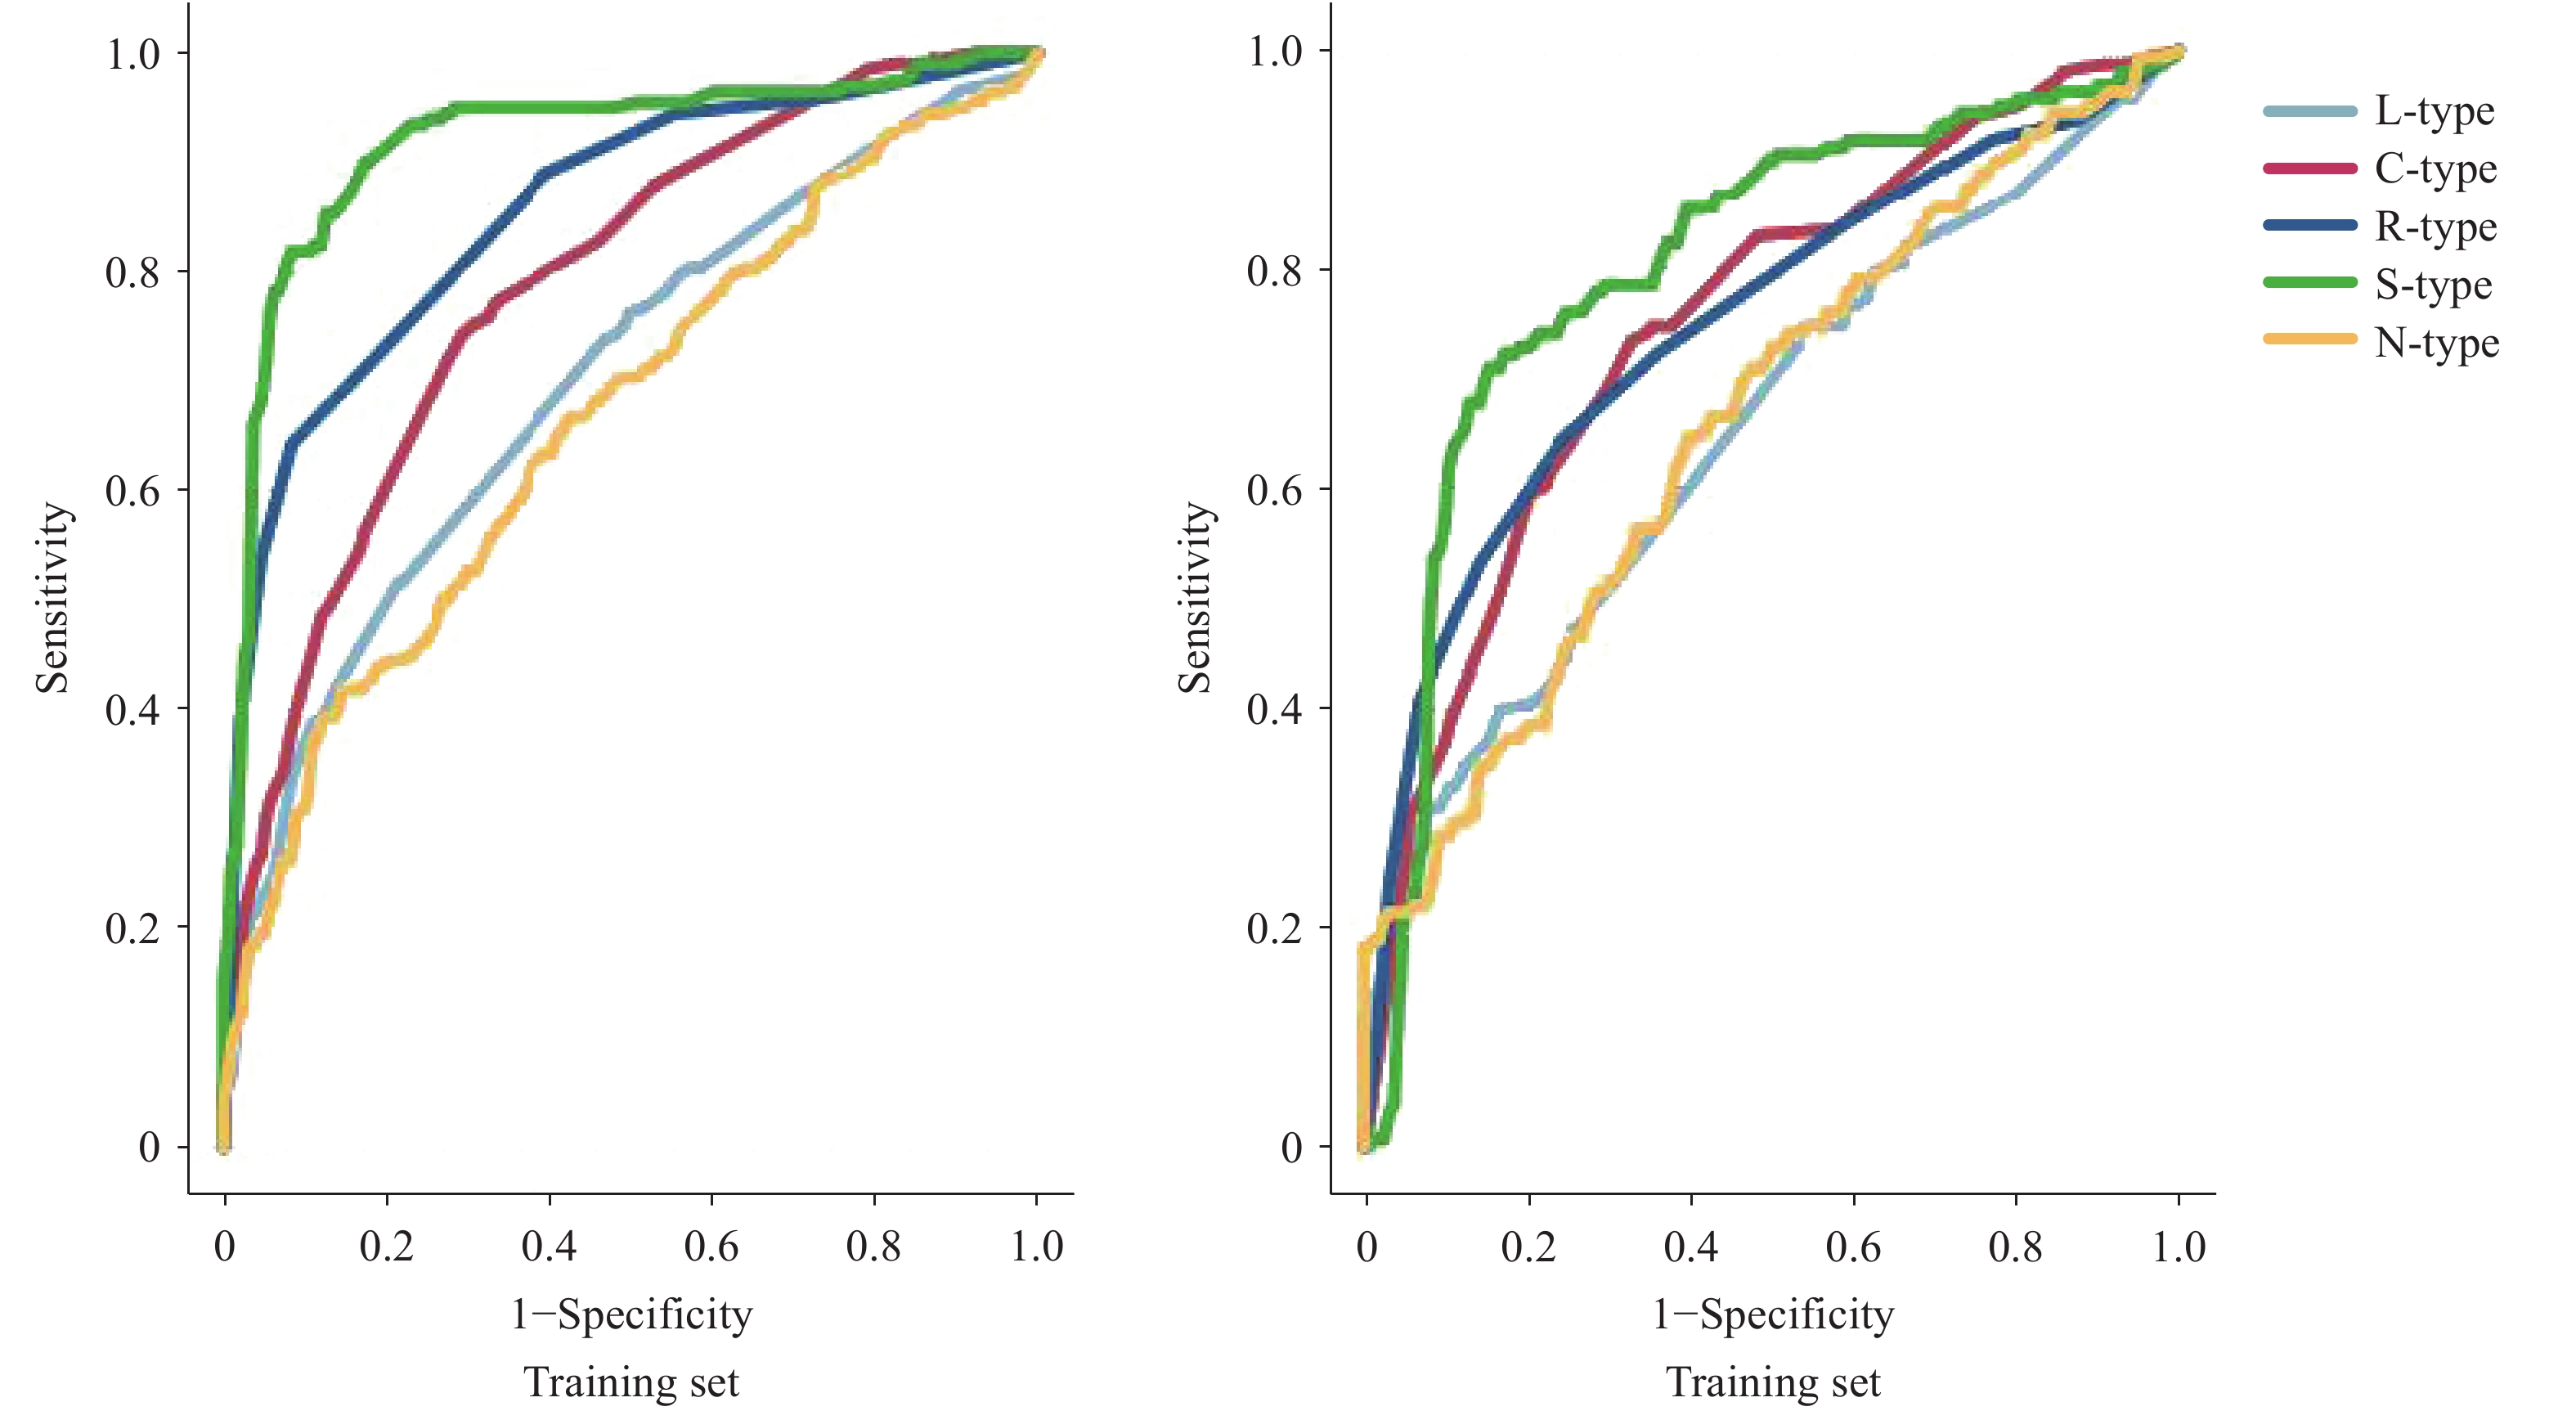 Figure 1.
LTBI risk prediction model based on the SVM algorithm.
Abbreviation: SVM=Support vector machine; LTBI=Latent tuberculosis infection.The SVM-based LTBI risk-prediction model was developed using variables relevant to the univariate analysis. Repeated model iterations demonstrate stable variable importance rankings without considerable fluctuations. The training set showed 85.9% accuracy, and the test set showed 68.3% accuracy (Table 2).
The top five predictors of LTBI onset, ranked by variable importance, were: 1) type of contact with the index case (14.76%); 2) key population classification of the index case (12.36%); 3) residential area of close contacts (12.02%); 4) frequency of participation in group activities (11.25%); 5) etiological results of the index case (10.47%) (Table 3).
Variant Importance of forecasting Variant Importance of forecasting Variant Importance of forecasting Contact type 0.1476 Etiological results of index case 0.1047 Occupation of index case 0.0509 Key population classification of index case 0.1236 Household registration type 0.0891 BCG scar 0.0281 Residential area of close contact 0.1202 Annual household income 0.0712 Frequency of group activity participation 0.1125 Weekly frequency of sleep deprivation 0.0568 Abbreviation: SVM=support vector machines; LTBI=latent tuberculosis infection; BCG=Bacille Calmette–Guérin. Table 3. Importance of input variables in LTBI risk prediction model based on SVM algorithm.
-
Through multi-factor logistic regression analysis, the factors output by the SVM were interpreted. The results showed that the index case was a classmates or colleagues, the index case being a key population with diabetes or silicosis, high frequency of group activity participation per week, the index case having positive etiological results, annual income exceeding 50,000 Chinese Yuan, sleep deprivation more than five times a week, and having scars were risk factors for the occurrence of latent TB infection. Living in an urban or migrant population was a protective factor (
Supplementary Table S3 ).
Baseline Characteristics of Close Contacts
Construction of Machine Learning Algorithm Models
Efficiency Analysis of Machine Learning Models
Machine Learning Model Verification
Result Interpretation
-
Compared with conventional statistical methods, machine learning algorithms offer advantages such as higher accuracy, greater precision, and stronger adaptability. Moreover, they have been widely used for disease screening (7). In this study, data from patients with TB and their close contacts from different areas of Henan Province were analyzed to identify the optimal model for predicting LTBI. The training dataset was analyzed using SVM, RF, DT, MLP, and LR algorithms. The performance of the models were validated using a test dataset. The comparative evaluation indicated the following MSE rankings from lowest to highest: SVM (0.121), RF (0.165), C5.0 (0.197), LR (0.229), and MLP (0.233), confirming the superior predictive performance of SVM. The SVM model achieved an AUC of 0.921, F1-score of 0.858, sensitivity of 0.888, and specificity of 0.831. External validation yielded an AUC of 0.752, F1-score of 0.694, sensitivity of 0.659, and specificity of 0.711. These results demonstrate robust screening performance and strong alignment with accurate LTBI status.
SVM, a supervised binary classification model, excels in high-dimensional data analysis by isolating optimal decision boundaries, making it widely applicable in disease screening (8). Its advantages include reducing structural risk to enhance generalizability, optimizing both empirical risk and confidence intervals concurrently, and the capacity to efficiently learn from small datasets while maintaining statistical validity (9-10).
In this study, repeated iterations of the SVM model yielded stable rankings of variable importance. The top five predictors of LTBI were the type of contact with the index case (14.76%), key population classification of the index case (12.36%), residential area of close contact (12.02%), frequency of participation in group activities (11.25%), and etiological results of the index case (10.47%).
These findings suggest that close contacts who were coworkers or classmates of patients with pulmonary TB demonstrated a significantly higher risk of developing LTBI than contacts who lived in the same household. This observation aligns with the research conducted by Schepisi et al. (11) in school and congregate settings. Furthermore, this aligns with the increased risk of extrapulmonary transmission among nonhousehold contacts in urban African contexts, as reported by Kakaire et al. (12). This study also detected a dose-response relationship between the risk of LTBI and frequency of participation in group activities. Gathering in institutional settings (e.g., classrooms and meetings) prolongs exposure and intensifies interpersonal proximity. In overcrowded environments with poor ventilation, these conditions synergistically increase the risk of aerosol transmission by increasing the density of respiratory droplet exchange, extending the suspension time of M. tuberculosis in confined spaces, and reducing effective air exchange rates.
Additionally, close contact with bacteriologically positive pulmonary TB patients was associated with a greater risk of LTBI, consistent with the findings of Lei et al. (13). Patients with bacteriologically confirmed pulmonary TB have higher levels of M. tuberculosis, leading to stronger pathogenicity. Sputum and respiratory droplets are rich in bacilli, which increases the risk of infection. Finally, close contacts of index cases with severe diseases such as human immunodeficiency virus (HIV) infection are more likely to develop LTBI. HIV co-infection is the most critical risk factor for LTBI reactivation. HIV infection results in a reduction in the number of CD4+T cells in both lymphoid tissues and peripheral blood. Elevated viral loads and rapid progression to acquired immunodeficiency syndrome (AIDS) are associated with an increased risk of LTBI (14). Finally, close contacts in rural areas were at a higher risk of developing LTBI. According to Gao et al., the estimated annual rate of TB in rural areas is 1.5%. The present study provides population-based evidence that older adults in rural China have a high prevalence of LTBI and relatively high risk of new infections (15-16).
In screening with limited data, interpretable models such as LR are often preferred because their advantages readily inform public health strategies. However, this study highlights the potential of machine learning for capturing complex data relationships, thereby laying the foundation for future multimodal integration. Thus, developing and validating advanced machine learning models remain essential for building precise automated screening systems in the long term.
Although machine learning offers advantages such as improved sensitivity, specificity, and diagnostic efficiency, it has some limitations. These shortcomings include the requirement for extensive datasets, poor interpretability of models, dependence on algorithms and technologies, and issues related to data privacy and security. Owing to variations in population distribution, prevalence rates, and other influencing factors that lead to a shift in data distribution, caution should be exercised when applying the model to other populations. As more data can help the model to generalize better, data from the target population will continue to be collected in the future, merged with source data, and used to train the model with a larger dataset. Individuals with LTBI may exert greater effort to recall and report risk factors related to TB. These biases can systematically distort the feature values and obscure the true distribution of certain predictors. Participants may underreport sensitive information, such as smoking or alcohol use, while potentially overreporting behaviors such as physical exercise. The specificity issues of the PPD test due to BCG vaccination and nontuberculous mycobacterial infection, as well as sensitivity issues due to immunosuppression, may have affected the estimation of the latent infection rates and risk factors in this study. Moreover, integrating machine learning models with biomarker-based diagnosis of M. tuberculosis infection may improve the application of prediction tools.
The findings in this report are subject to at least two limitations. First, the cross-sectional design can identify factors associated with LTBI, but cannot establish causality and may be susceptible to survivor bias. Second, despite controlling for multiple known risk factors, residual unmeasured confounding factors such as genetic factors and subtle environmental exposures may affect the model’s feature importance and generalizability. Therefore, our findings should be regarded as an initial step toward more accurate identification of LTBI using machine learning. Future studies should establish longitudinal cohorts with long-term follow-up for active TB outcomes to develop prognostic models that truly predict progression risk. Only through such efforts can artificial intelligence realize its full potential for optimizing TB prevention and enabling precision in public health.
In conclusion, this study suggests an SVM model constructed using machine learning algorithms focused on five predictors: types of close contacts, occupational types of the index case, residential locations of close contacts, frequency of participation in group activities, and etiological results of the index case. These factors showed strong predictive power for assessing the risk of LTBI. Through precise stratification, costly testing and treatment resources can be concentrated on those most in need, thereby avoiding wastage of low-risk populations. In large-scale community screenings, the rapid prioritization of a large number of individuals can be achieved, allowing limited human and material resources to maximize their effectiveness. Our next step will be to validate the model's performance across heterogeneous populations using multicenter data and explore hybrid models that integrate clinical variables with biomarkers.
| Citation: |

|