
 Download:


-
Introduction: Urban landscape patterns impact population health; however, traditional indices are limited by single-dimensional focus, multicollinearity, and weak health relevance. Developing a holistic Landscape Pattern Health Index (LPHI) is critical for planning healthy cities.
Methods: Using data from Ningbo (China), this study integrated 2001–2023 land use data (reclassified into 7 types) and 2009–2016 street-level stroke mortality data. A two-stage Generalized Weighted Quantile Sum (GWQS) regression addressed the temporal data discrepancy, first deriving weights from 2009–2016 health data, then calculating the LPHI for the full 2001–2023 period. Quasi-Poisson regression was used to validate the association between the LPHI and stroke mortality.
Results: An interquartile-range increase in the Protective Composite Index reduced stroke mortality by 20% (warm seasons) and 22% (cold seasons), while the Hazard Composite Index increased risk by 29% (warm) and 20% (cold). The LPHI demonstrated significant associations with stroke mortality, with the Protective Composite Index reducing risk and the Hazard Composite Index increasing it across both seasons.
Conclusion: The study suggests that the LPHI can serve as a bridge between landscape ecology and public health, with the potential to identify high-risk areas and seasonal priorities. This approach could guide targeted interventions through landscape optimization, supporting evidence-based healthy urban planning.
-
Urban landscape patterns influence population health through the spatial distribution of green spaces (1) and water bodies (2) that mitigate pollution and promote physical activity, whereas industrial land use increases cardiovascular risks (3). Configurations such as high edge density in green spaces may facilitate physical activity and social cohesion, whereas impervious surface complexity may exacerbate urban heat island effects and pollutant accumulation, indirectly influencing stroke risk via microclimatic and physiological pathways. Landscape patterns are typically quantified using indices; however, existing indices often focus on a single dimension and face challenges, such as multicollinearity and limited relevance. Inspired by the Air Quality Health Index (AQHI)(4), we developed the Landscape Pattern Health Index (LPHI) that integrates statistical robustness, practical utility, and public health guidance, all critical for Healthy City initiatives.
In environmental health, generalized weighted quantile sum (GWQS) regression models can assess the health impacts of exposure to mixed air pollutants and chemicals, effectively reducing collinearity among components. Unlike dimension-reduction techniques such as Principal Component Analysis (PCA), which create latent factors not tied directly to health outcomes, GWQS regression derives component weights explicitly from associations with health, generating more interpretable and health-relevant composite indices, reducing multicollinearity among correlated indicators, enabling integrated health-oriented indices creation, and advancing evidence-based strategies for urban landscape optimization. Based on data from Ningbo, we employed GWQS regression to construct an LPHI, offering a tool for planning healthy cities.
We collected annual land use data (500m resolution) from the MCD12Q1 land cover dataset (https://earthexplorer.usgs.gov/) from 2001–2023, reclassified into seven major categories: impervious surface, grassland, cropland, bare land, wetland, waterbody, and forest/shrubland. Stroke was chosen as the outcome as it is the leading cause of death in China (5), and existing literature suggests its susceptibility to environmental influences mediated by landscape patterns, including air quality, temperature extremes, and opportunities for physical activity (6). Daily street-level stroke mortality data from the Ningbo CDC were aggregated into annual counts at the street-unit level to achieve spatiotemporal alignment with landscape and covariate data. However, owing to data availability, these data were sourced from 2009–2016. To reconcile the temporal mismatch between the landscape (2001–2023) and health (2009–2016) data, a two-stage analytical approach was employed (
Supplementary Material ). Briefly, Stage 1 established metric-health associations and derived weights using 2009–2016 data; Stage 2 applied these weights to calculate the LPHI for the 2001–2023 period. Meteorological and pollutant (e.g., PM2.5) data were sourced from the China Meteorological Forcing Dataset (7) and China High Air Pollutants Datasets (8), respectively. Data on key meteorological and air quality confounders were incorporated as covariates in subsequent regression models to isolate independent associations between landscape patterns and stroke risk, following adjustment to a 1 km resolution using bilinear interpolation. Nighttime-light data (500m resolution) were applied to reflect economic disparities across streets. Summary statistics for stroke deaths, pollutant concentrations, meteorological factors, and nighttime light intensity across street-units during warm and cold seasons (2009–2016) are provided inSupplementary Table S1 .For urban landscape patterns, we selected six indices: one composition metric (Percentage of Landscape, PLAND) and five configuration metrics [patch density ( PD), largest patch index (LPI), edge density (ED), mean shape index (SHAPE_MN), and aggregation index (AI)]. The selection was based on the rationale that these metrics quantify fundamental spatial characteristics, such as the abundance, size, shape, and connectivity of landscape elements, which are theorized to influence environmental exposure (e.g., pollution and heat) and health-promoting opportunities (e.g., physical activity), thereby constituting plausible pathways to population health.
The analysis applied a two-stage GWQS regression. First, landscape metrics were scaled into quartiles, and bootstrap sampling (100 iterations) was applied to estimate weights linking metrics to health outcomes, generating a land use-specific health index classified as protective or hazardous based on their association direction. Second, metrics sharing consistent protective or hazardous associations were aggregated via GWQS to derive composite LPHIs (protective and hazardous), thereby enabling a holistic assessment of the health impacts of landscape patterns. To validate the effectiveness of the constructed LPHIs, a separate quasi-Poisson regression was applied, modeling stroke mortality as a function of the LPHI scores, while including the same set of covariates for adjustment. Statistical analyses were conducted using R software (version 4.2.3; R Core Team, R Foundation for Statistical Computing, Vienna, Austria).
Supplementary Table S2 details the health indices constructed for each land-use type, revealing harmful associations between stroke mortality and indices for impervious surfaces and bare land. Protective associations were identified for grassland, cropland, wetland, waterbody, and forest/shrubland. Spatial configuration metrics (e.g., PD) outweighed landscape composition by weighting the components of health indices, underscoring their predominant influence on health (Supplementary Table S3 ).Figure 1 shows the constituent weights of protective and hazardous composite indices. The warm-season Protective Composite Index prioritized grassland-PD (20.04%), grassland-AI (17.81%), and forest/shrubland-LPI (15.88%), emphasizing the importance of fragmented green spaces. In contrast, the cold-season Protective Composite Index relied on grassland-AI (23.42%), grassland-PD (21.14%), and waterbody-ED (13.96%), reflecting enhanced natural vegetation and water connectivity during colder months. The Hazard Composite Index was overwhelmingly driven by impervious surface ED (warm: 72.86%; cold: 69.07%) and SHAPE_MN (warm: 9.04%; cold: 10.20%), indicating that irregular impervious patches posed a year-round risk.
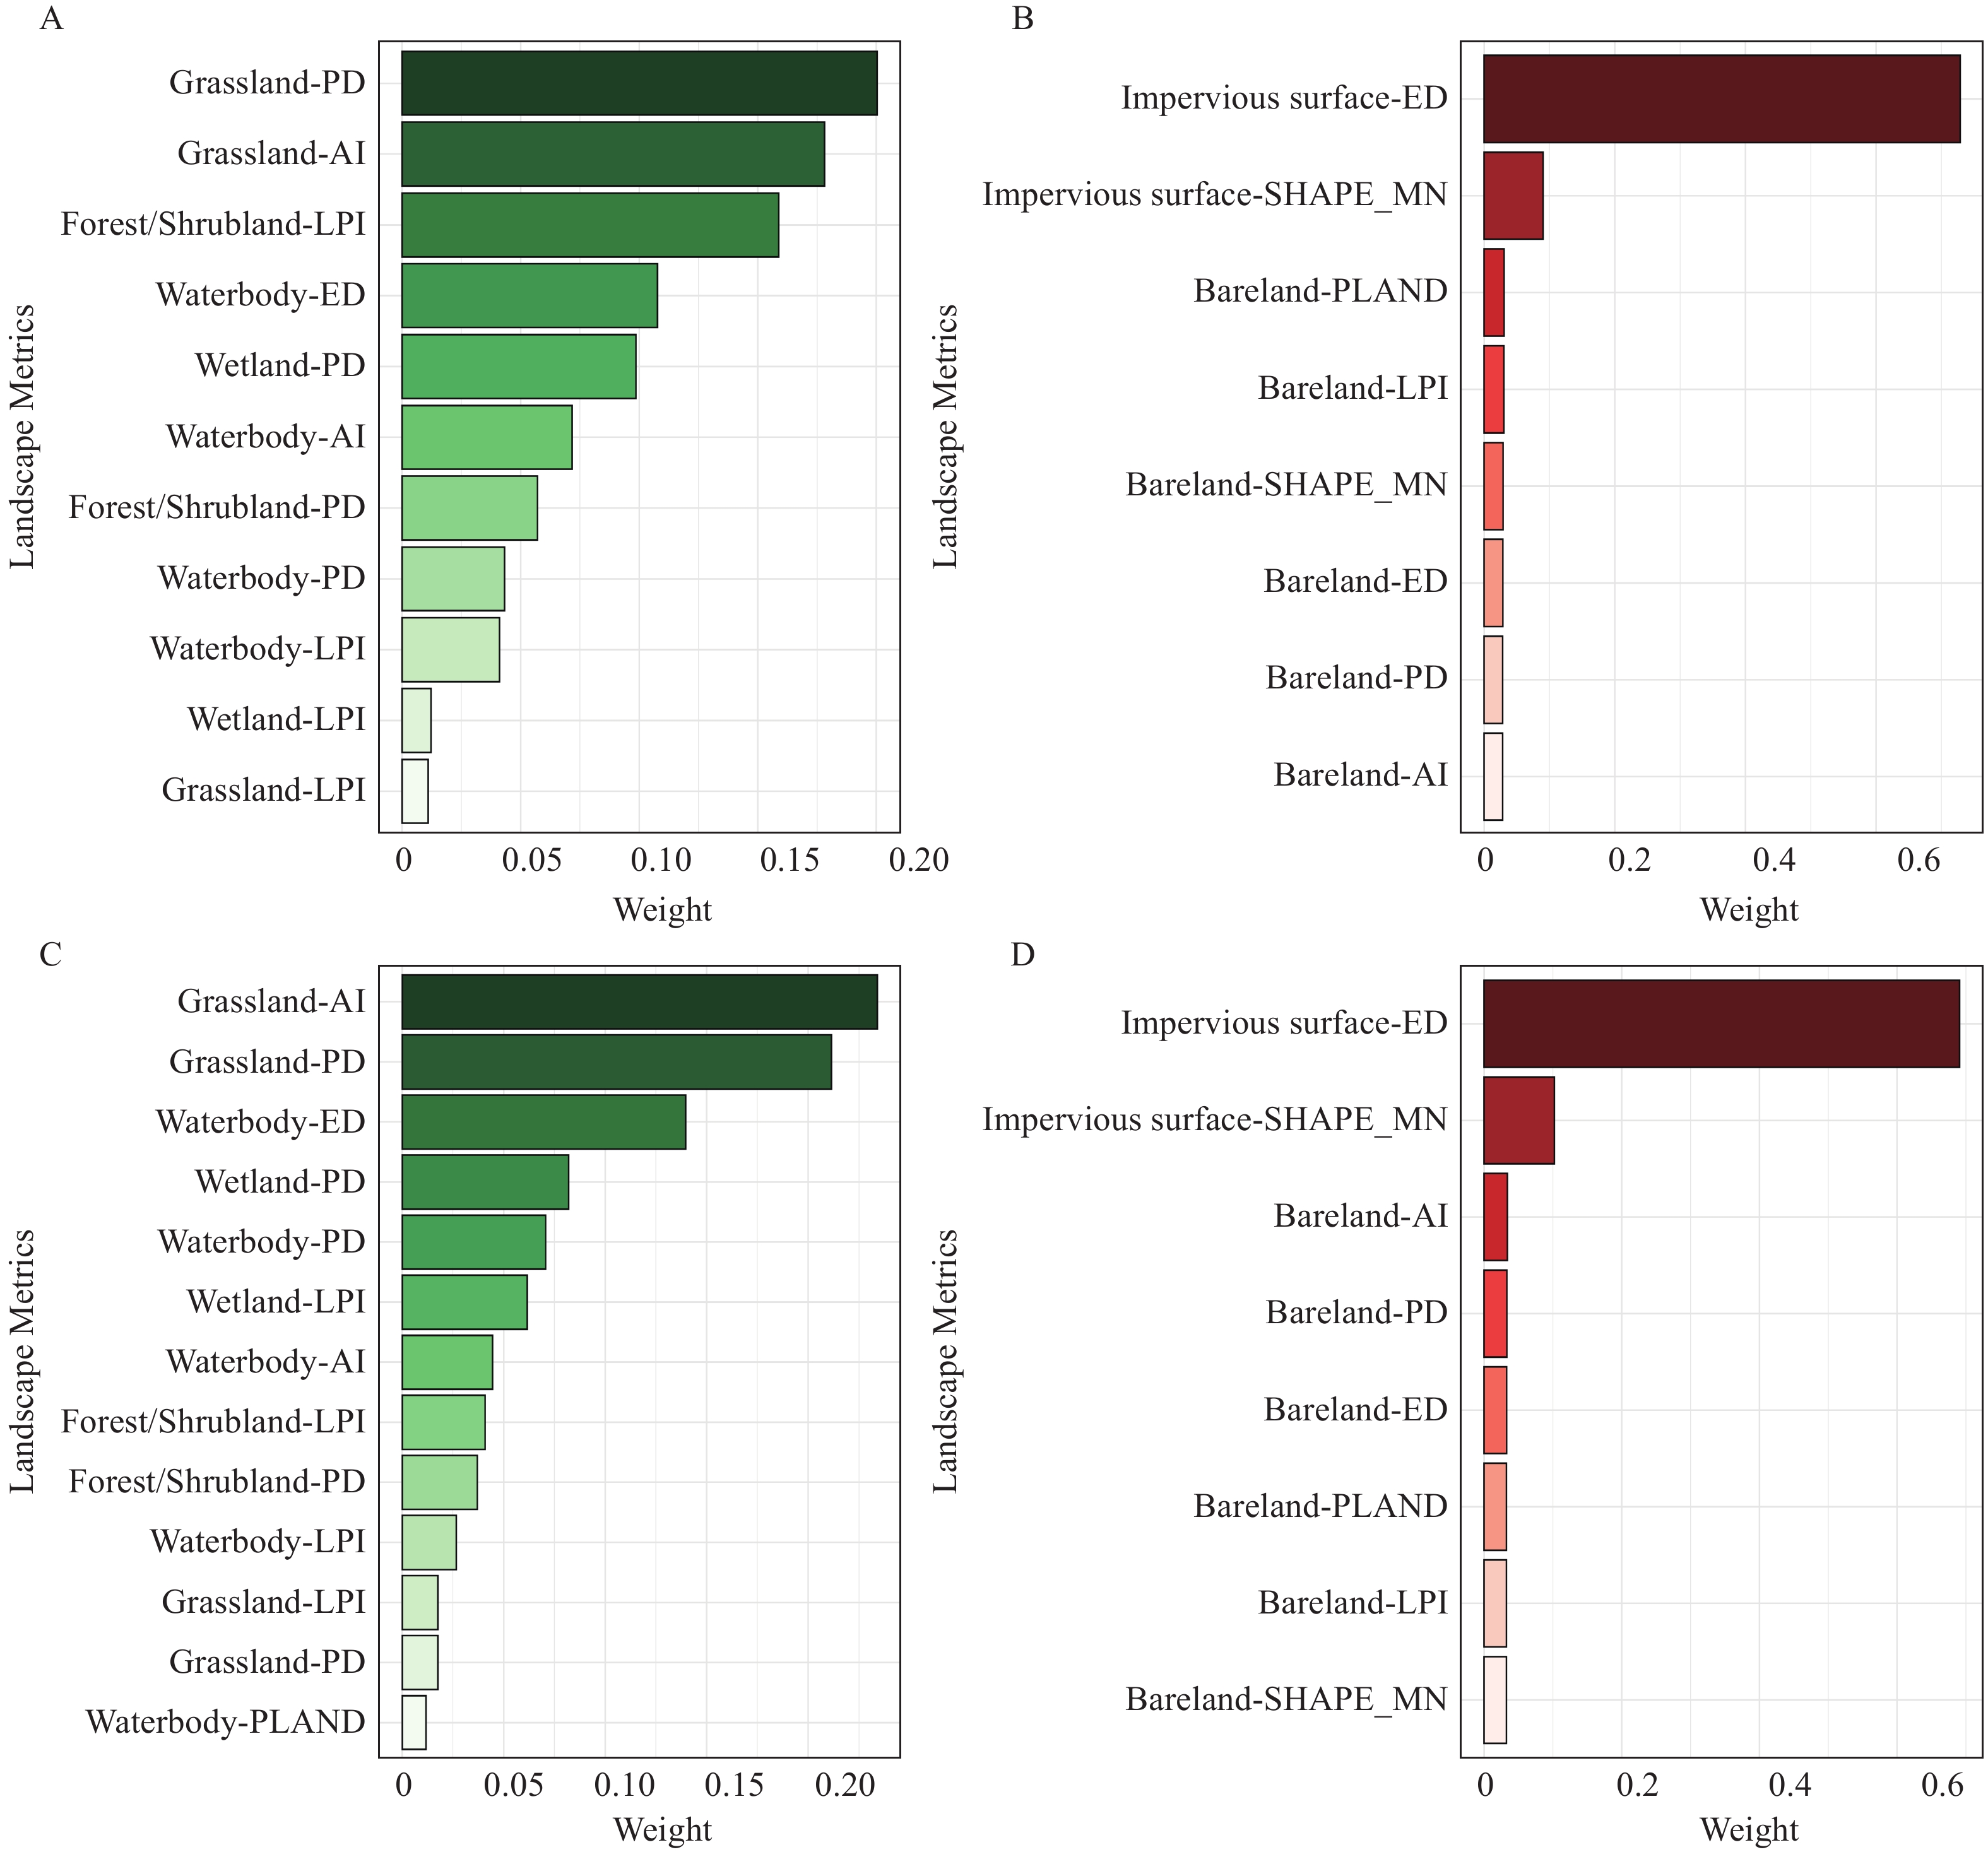 Figure 1.
Weights of the constituent factors of the season-specific LPHI.
Note: Weights represent the relative contribution of each landscape metric derived from the GWQS regression for the (A) Protective Composite Index (Warm); (B) Hazard Composite Index (Cold); (C) Protective Composite Index (Warm); (D) Hazard Composite Index (Cold). The sum of the weights for each composite index is 100%. The metrics are sorted in descending order of their weights.
Abbreviation: Grassland-PD=Grassland Patch Density; Grassland-AI=Grassland Aggregation Index; Forest/Shrubland-LPI=Forest/Shrubland Largest Patch Index; Waterbody-ED=Waterbody Edge Density; Wetland-PD=Wetland Patch Density; Forest/Shrubland-PD=Forest/Shrubland Patch Density; Waterbody-PD=Waterbody Patch Density; Waterbody-LPI=Waterbody Largest Patch Index; Wetland-LPI=Wetland Largest Patch Index; Grassland-LPI=Grassland Largest Patch Index; Waterbody-PLAND=Waterbody Percentage of Landscape; Impervious surface-ED=Impervious Surface Edge Density; Impervious surface-SHAPE_MN=Impervious Surface Mean Shape Index; Bareland-PLAND=Bareland Percentage of Landscape; Bareland-LPI=Bareland Largest Patch Index; Bareland-SHAPE_MN=Bareland Mean Shape Index; Bareland-ED=Bareland Edge Density; Bareland-PD=Bareland Patch Density; Bareland-AI=Bareland Aggregation Index.
For the composite LPHIs (Table 1), the Hazard Composite Index had higher mean values in warm (1.16, IQR=1.64) than cold (1.13, IQR=1.58) seasons, with extreme ranges spanning 0.00–2.47. The Protective Composite Index exhibited similar means across seasons (warm: 0.90; cold: 0.94), but a higher maximum in cold seasons (2.03 compared to 1.66), suggesting a stronger protective potential of natural landscapes in winter. Regression results confirmed the validity of the LPHI: each IQR increase in the Protective Composite Index reduced the stroke mortality risk by 20% (13%–26%) in warm seasons and 22% (16%–28%) in cold seasons. Conversely, the Hazard Composite Index increased risk by 29% (19%–40%) and 20% (11%–29%), respectively (all P < 0.001). Together, these findings demonstrate a robust association between the LPHI and stroke mortality, supporting its validity as a framework for assessing the health effects of urban landscape patterns.
Seasons LPHI Descriptive Statistics Stroke mortality (%) P Mean IQR Median Min Max Warm Protective Composite Index 0.90 0.48 0.92 0.01 1.66 −20 (−26, −13) <0.001 Hazard Composite Index 1.16 1.64 1.46 0.00 2.47 +29 (+19, +40) <0.001 Cold Protective Composite Index 0.94 0.46 0.92 0.02 2.03 −22 (−28, −16) <0.001 Hazard Composite Index 1.13 1.58 1.38 0.00 2.41 +20 (+11, +29) <0.001 Note: ‘+’ indicates a percentage increase in stroke mortality associated with an IQR increase in LPHI, whereas ‘−’ represents a percentage decrease linked to an IQR increase in LPHI.
Abbreviation: LPHI=Landscape Pattern Health Index; IQR=interquartile range.Table 1. Descriptive statistics of the constructed LPHI (2001−2023) and Percentage change (mean and 95% posterior intervals) in stroke mortality associated with an interquartile range (IQR) increase in LPHI.
-
Regarding the associations between indices constructed for individual land use types and stroke mortality, grassland, cropland, wetland, waterbodies, and forest/shrubland reduced risks in both seasons, whereas impervious surfaces and bare land increased risks. This aligns with the known benefits of green (1) and blue spaces (2). Vegetated areas are likely to mitigate the risk through pollutant absorption, microclimate regulation, and stress reduction. Although no direct studies have linked impervious surfaces or bare land to stroke mortality, built environment density is positively correlated with stroke risk (6). Impervious surfaces, particularly those with complex shapes and extensive edges, intensify the urban heat island effect (9). This can elevate stroke risk through temperature-dependent pathways such as exacerbated heat stress, which reduces cerebral perfusion in warm seasons and heightens cold-induced hemodynamic instability in cold seasons (10). Barelands lacking vegetation may similarly experience extreme temperature exposure.
The LPHI, developed through GWQS regression, addresses the key limitations of traditional indices, including single-dimensional focus, multicollinearity, and weak health linkages, by systematically integrating both landscape composition (e.g., impervious surfaces and green space coverage) and configuration metrics (e.g., patch density and aggregation). Its dual protective-hazardous index design provides a holistic framework to assess both risk-mitigating and risk-amplifying landscape features, revealing that the protective effects of grasslands and water bodies depend on features such as fragmented green spaces (facilitating activity) in warm seasons, whereas hazardous risks from impervious surfaces relate to edge complexity, whose irregular configurations may exacerbate the heat island effect or pollutant accumulation, thereby increasing the risk of stroke. By prioritizing metrics with strong health associations, the LPHI bridges landscape ecology and public health and offers a robust tool for quantifying the impact of urban forms on health outcomes.
A key innovation of this study is the development of the LPHI via GWQS regression. Our findings suggest that this approach can translate complex landscape patterns into a composite tool with potential public health utility. The significant associations observed support the idea that the LPHI can holistically assess health risks and benefits from urban landscapes, which could enable better prioritization of interventions, such as enhancing green space connectivity or managing impervious surface expansion, to mitigate population health risks.
However, the LPHI framework has several limitations. Validated in Ningbo, its generalizability may face challenges owing to varying local land use, climate, and health contexts. The 500m resolution remote sensing data may overlook microscale features with neighborhood-level health impacts, such as small park accessibility. Socioeconomic factors, such as income inequality, indirectly inferred from nighttime light data, should be explicitly integrated. Relying solely on stroke mortality restricted the study's scope. Stroke, a chronic disease with acute manifestations, requires the precise alignment of long-term landscape exposures (e.g., pre-2009 data gaps) with acute triggers (partially addressed here). Different diseases (e.g., asthma and tumors) exhibit distinct environmental sensitivities (e.g., tumors to industrial pollution), necessitating multi-disease validation. Static residential assumptions ignore migration (e.g., rural-to-urban moves) and biased associations for chronic diseases, such as stroke, influenced by past exposure. These gaps highlight the need for higher-resolution data, explicit socioeconomic indicators, multiple diseases, and longitudinal analyses to enhance LPHI’s utility.
Despite these limitations, the LPHI bridges landscape ecology and public health, offering a scalable tool for healthy urban planning. In the big data era, real-time sensing (e.g., Sentinel-2) and machine learning may be integrated to predict landscape health risks (e.g., impervious surface growth) and guide smart interventions, such as green corridor prioritization. This aligns with the need to deepen LPHI public health applications using data-driven insights for enhanced risk control. Given the burden of stroke and environmentally sensitive diseases, integrating LPHI into policies fosters proactive place-based strategies. This ensures that landscape design matches health priorities, supports sustainability and population health while leveraging technology for precision public health.
-
This study, which involved human subjects, was conducted in accordance with the Declaration of Helsinki, the International Ethical Guidelines for Biomedical Research Involving Human Subjects, and relevant Chinese regulations, including the “Ethical Review Measures for Life Sciences and Medical Research Involving Humans.” The study protocol was reviewed and approved by the Biomedical Ethics Committee of the Peking University (approval number: PURB-TYS2025175).
HTML
| Citation: |

|