
 Download:


-
Introduction: Pulse pressure (PP), an indicator of aortic stiffening, may be associated with adverse cardiovascular outcomes. However, the relationship between PP levels and mortality risk in the Chinese population remains unclear.
Methods: A total of 102,311 participants aged 40 and above were recruited in this prospective study in Beijing during 2010–2012, and followed up until 2021. Blood pressure measurements and related factors were collected at baseline. All-cause and cardiovascular or cerebrovascular disease (CCVD) related deaths were identified as endpoints.
Results: Compared with the lowest quartile of PP (<40 mmHg), mortality risk increased by 9.8%–23.9% among individuals with PP in the second through fourth quartiles, with particularly elevated risk among females, adults aged 60–74 years, and overweight or obese individuals. The association between PP and CCVD-specific mortality risk was attenuated but remained statistically significant among people with PP ≥60 mmHg.
Conclusions: Death risk increased with rising PP levels in middle-aged and elderly populations in Beijing. These findings emphasize the need to develop comprehensive and effective PP management strategies to reduce mortality.
-
With advancing age, higher pulse pressure (PP) as an indicator of aortic stiffening has been shown to be predictive of adverse cardiovascular outcomes, particularly in middle-aged and older adults (1). The risk level of PP in the Chinese population has yet to be fully verified. In response to this knowledge gap, we explored the association between PP and all-cause and cardiovascular or cerebrovascular disease (CCVD) specific mortality. In this study, a total of 102,311 participants in Beijing were included in this community-based prospective study during 2010–2012 and followed up until 2021. Findings indicated positive correlations between higher PP (≥40 mmHg) and risk of all-cause and CCVD-specific mortality. Moreover, the increased risk of death due to elevated PP was more pronounced in women, people aged 60–74, and overweight or obese individuals. These results suggest that controlling PP levels in high-risk groups may reduce mortality risk.
The Beijing Community Stroke Screening and Prevention Project is a population-based, prospective study of permanent residents aged 45 and above at baseline recruitment (August 2010–December 2012). Details regarding participant recruitment methods and baseline surveys have been published elsewhere (2). Briefly, information about demographic characteristics, related risk factors of chronic disease, and physical examinations was collected at the baseline interview. The confirmation of death events from 2010 to 2021 was primarily derived from death certificates from the Beijing Population Death Information Registration Management System (3) and supplemented by self-reported deaths from subjects’ family members. According to ICD-10, endpoint events were classified as deaths from all causes and CCVD (ischemic heart disease, IHD: I20–I25; cerebrovascular diseases, CVD: I60–I69). After excluding participants with incomplete basic information, this study included 102,311 individuals from the cohort.
Baseline PP was calculated as the difference between the mean systolic blood pressure (SBP) and diastolic blood pressure (DBP), and subdivided into quartiles. An unhealthy dietary habit is defined as either having an insufficient intake of fresh vegetables or having an excessive intake of red meat, or both (4). Low-level physical activity was defined through the International Physical Activity Questionnaire short form. Incidence density of outcome events according to PP was displayed in a dot plot. Kaplan-Meier curves were plotted and cumulative survival rates of the PP groups were compared with the Log-rank test. Non-linear associations were investigated using penalized cubic splines. Multivariate Cox proportional-hazard models were used to estimate the risk of PP for endpoint events. All analyses were performed using SPSS (version 21.0, IBM, Armonk, New York, USA) and R (version 4.3.0, R Foundation for Statistical Computing, Vienna, Austria).
The average age of all subjects was 62.24±8.64 years and 35.56% were males. During an average follow-up of 9.43±1.59 years, totaling 964,343 person-years, the median PP was 50 mmHg (IQR: 40 mmHg, 60 mmHg). Table 1 presents the baseline characteristics across the four PP groups.
Subjects Total
(102,311)Quartiles of PP (mmHg) First quartile (n=13,318) Second quartile (n=33,020) Third quartile (n=29,244) Fourth quartile (n=26,729) Pfor trend Age (Mean±SD) 62.24±8.64 58.77±7.38 61.48±8.08 62.59±8.55 65.76±8.72 <0.001 Gender (n, %) Male 36,383 (35.56) 4,441 (33.35) 11,676 (35.36) 10,678 (36.51) 9,588 (35.87) <0.001 Female 65,928 (64.44) 8,877 (66.65) 21,344 (64.64) 18,566 (63.49) 17,141 (64.13) Education level (n, %) Junior high school and below 65,089 (63.62) 7,664 (57.55) 19,524 (59.13) 18,516 (63.32) 19,385 (72.52) <0.001 Senior middle school 24,054 (23.51) 3,738 (28.07) 8,772 (26.57) 6,882 (23.53) 4,662 (17.44) University and above 13,168 (12.87) 1,916 (14.39) 4,724 (14.31) 3,846 (13.15) 2,682 (10.03) Lifestyle behavior (n, %) Current smoking 18,450 (18.03) 2,535 (19.03) 5,946 (18.01) 5,252 (17.96) 4,717 (17.65) 0.003 Excessive drinking (≥25 g/d for male and ≥15 g/d for female) 3,937 (3.85) 557 (4.18) 1,119 (3.39) 1,143 (3.91) 1,118 (4.18) 0.013 Unhealthy diet 48,658 (47.56) 6,346 (47.65) 15,534(47.04) 13,759 (47.05) 13,019 (48.71) 0.005 Low level PA 9,710 (9.49) 1,283 (9.63) 3,072 (9.30) 2,755 (9.42) 2,600 (9.73) 0.354 Chronic disease (n, %) D2M 17,468 (17.07) 1,620 (12.16) 4,828 (14.62) 5,168 (17.67) 5,852 (21.89) <0.001 AF 3,056 (2.99) 400 (3.00) 920 (2.79) 855 (2.92) 881 (3.30) 0.008 Physical examination (n, %) BMI ≥28.0 kg/m2 22,911 (22.93) 2,519 (18.19) 6,582 (19.93) 6,813 (23.30) 6,997 (26.18) <0.001 BP ≥140/90 mmHg 33,222 (32.47) 1,736 (13.03) 4,034 (12.22) 7,216 (24.68) 20,236 (75.71) <0.001 Abbreviation: PP=pulse pressure; PA=physical activity; D2M=self-reported type 2 diabetes mellitus; AF=self-reported atrial fibrillation; BMI=body mass index; BP=blood pressure. Table 1. Baseline characteristics of follow-up participants between the PP groups.
At the end of the follow-up, 10,101 participants had died, with 4,166 deaths attributed to CCVD (IHD: 1,831; CVD: 2,335). The mortality rates according to PP values are shown in
Supplementary Figure S1 . Cumulative survival rates for adverse outcomes differed significantly between PP groups, and non-linear relationships were observed between PP and both all-cause (χ2=9.80, Pfor non-linear=0.0203) and CCVD-specific mortality risks (χ2=8.00, Pfor non-linear=0.046) (Figure 1).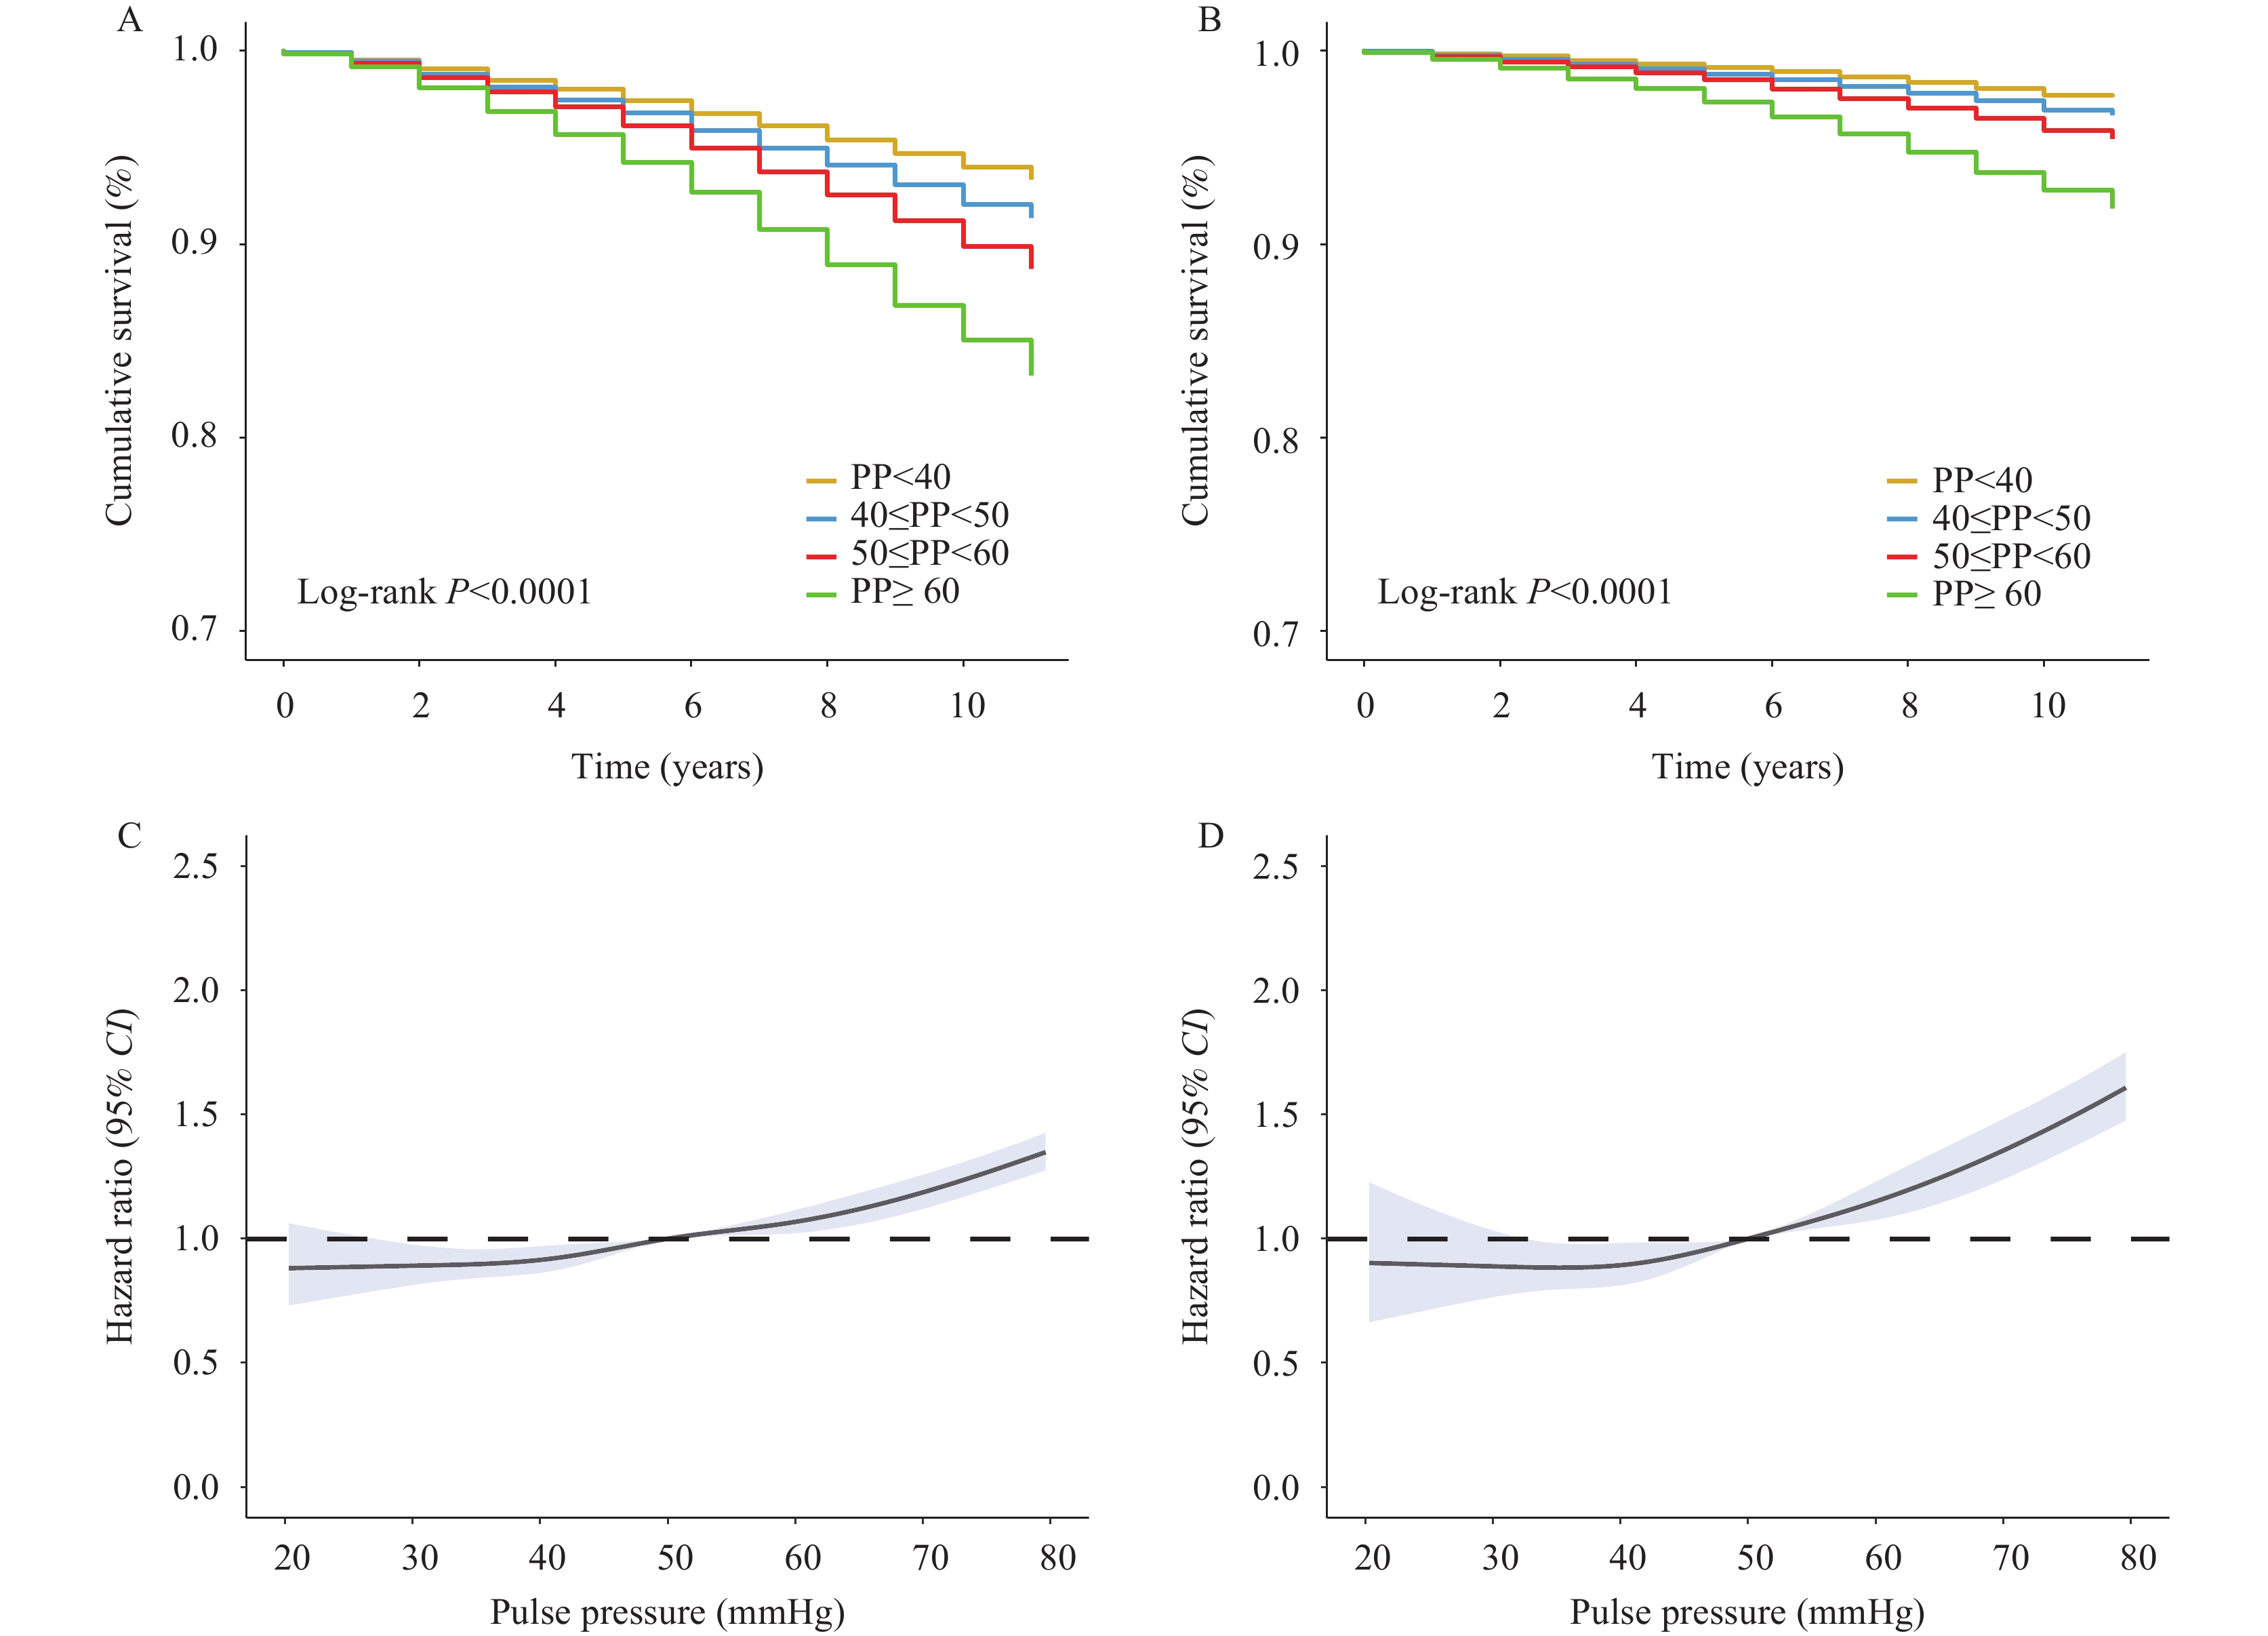 Figure 1.
The association between baseline PP and all-cause and CCVD-specific mortality risks. (A) Cumulative survival rate for all-cause mortality across four PP groups; (B) Cumulative survival rate for CCVD mortality across four PP groups; (C) Non-linear relationships between PP and all-cause mortality risk; (D) Non-linear relationships between PP and CCVD-specific mortality risk.
Note: In panels (C) and (D), solid lines represent HR values and shaded areas represent 95% CI for mortality risk. Abbreviation: PP=pulse pressure; CCVD=cardiovascular and cerebrovascular diseases; HR=hazard ratio; CI=confidence interval.After adjusting for covariates, PP in the second, third, and fourth quartiles showed significant increases in all-cause mortality risk of 9.8%, 14.4%, and 23.9%, respectively, compared with PP <40 mmHg (Z=26.660, P<0.001). The association between PP and CCVD-related death events was attenuated but remained statistically significant among people with PP ≥60 mmHg [hazard ratio (HR)=1.268, 95% confidence interval (CI): 1.102, 1.459] (Table 2). Subgroup analysis revealed that higher PP might increase all-cause mortality risk in women, elderly people aged 60–74, and overweight and obese individuals over the past decade (
Supplementary Table S1 ).Death
eventsVariables Pulse pressure (mmHg) <40 40 to <50 50 to <60 ≥60 All-cause Person-years of follow up 126,558 313,021 275,829 248,935 No. of events 773 2,525 2,868 3,935 Rate per 1,000 person-years 6.11 8.07 10.40 15.81 Original model, HR (95% CI) 1 (ref) 1.102 (1.017, 1.195)* 1.167 (1.078, 1.264)** 1.388 (1.284, 1.502)** Multivariable model, HR (95% CI) 1 (ref) 1.098 (1.011, 1.192)* 1.144 (1.054, 1.241)** 1.239 (1.136, 1.351)** Pfor trend <0.001 CCVD Person-years of follow up 126,558 313,021 275,829 248,935 No. of events 281 937 1,124 1,824 Rate per 1,000 person-years 2.22 2.99 4.07 7.33 Original model, HR (95% CI) 1 (ref) 1.096 (0.959, 1.252) 1.193 (1.046, 1.361)* 1.628 (1.433, 1.849)** Multivariable model, HR 95% (CI) 1 (ref) 1.087 (0.948, 1.246) 1.138 (0.994, 1.302) 1.268 (1.102, 1.459)** Pfor trend <0.001 Note: Original models adjusted for age groups and sex. Multivariable models adjusted for age groups, sex, education status, current smoking status, excessive drinking consumption, unhealthy dietary habits, diabetes, atrial fibrillation, obesity, and excessive blood pressure.
Abbreviation: CCVD=cardiovascular and cerebrovascular diseases; ref=reference; HR=hazard ratio; CI=confidence interval.
* P<0.05.
** P<0.001.Table 2. HR of all-cause and CCVD-specific mortality risks by 4 levels of pulse pressure.
-
In this population-based prospective study, higher PP levels in middle-aged and elderly populations were positively associated with all-cause and CCVD specific mortality risks during almost 10 years of follow-up, particularly among females, individuals aged 60–74 years, and those who were overweight or obese.
Previous cohort studies among high-risk vascular disease populations have reported that elevated baseline PP was associated with increased risk of death, myocardial infarction, and stroke (5). These findings are consistent with our results, suggesting that PP should be incorporated as a routine screening indicator in middle-aged and elderly populations (6).
In this study, women with higher PP represented a high-risk group with increased all-cause mortality risk, and those with PP≥60 mmHg demonstrated higher CCVD-specific mortality risk. A previous study among Chinese women reported that PP had a more significant impact on stroke and coronary heart disease mortality than on all-cause mortality (7). The inconsistencies between these results may be attributed to differences in baseline age (62.2 years versus 55.1 years), endpoint definitions (CCVD versus stroke and CHD), and follow-up durations (9.43 years versus 5.1 years).
Our findings on PP and mortality in elderly people under 75 years of age are comparable with prior reports (8). Widening PP is a normal consequence of senescence (9), which may explain why increased PP in elderly individuals over 75 was not significantly associated with mortality risk. Notably, we found that among participants with PP≥60 mmHg, approximately one-quarter did not meet the diagnostic criteria for hypertension (<140/90 mmHg). This suggests that in addition to focusing on hypertensive patients, attention should also be directed toward non-hypertensive individuals with elevated PP, which could be of significant importance for preventing CCVD mortality.
Beyond the well-established impact of PP on all-cause and CCVD mortality, evidence suggests that individuals with obesity exhibit insulin resistance, atherogenic dyslipidemia, inflammation, and increased blood pressure, while higher PP levels may be associated with vascular wall damage and atherosclerosis (10). The potential interactions among these factors might amplify the risk of adverse outcomes, indicating that obese individuals should be prioritized for PP level management.
This study has several limitations, including incomplete collection of certain factors such as aortic valve regurgitation, secondary hypertension, and psychological factors that might influence baseline PP levels and changes during follow-up. These limitations highlight the need for future research with more comprehensive medical history collection and physical examinations to validate these findings and improve blood pressure management strategies.
In conclusion, we identified the potential role of PP as a predictor of mortality in middle-aged and elderly populations in Beijing, highlighting the importance of early screening for elevated PP (≥40 mmHg), especially among women, individuals aged 60–74 years, and those who are overweight or obese. Our study emphasizes the need to develop comprehensive and effective PP management strategies to reduce mortality in these high-risk populations.
-
All residents who participated in this study and all research personnel from participating Centers for Disease Control and Prevention and health centers for their valuable contributions to this project.
-
Ethical approval was obtained from the Beijing Center for Disease Prevention and Control (BJCDC) Institutional Review Board (Approval No.2019-12).
HTML
| Citation: |

|