
 Download:


-
Introduction: Malaria is a mosquito-borne infectious disease that poses a serious threat to human health. Although Anhui Province achieved malaria elimination in 2019, the risk of retransmission from imported cases persists due to cross-border human mobility. Given the strong correlation between meteorological and environmental factors and malaria transmission, this study selected four distinct geographic regions in Anhui Province to investigate the relationship between these factors and malaria vector abundance using remote sensing technology.
Methods: We collected density data of Anopheles sinensis (An. sinensis), meteorological parameters (temperature, humidity, rainfall), and normalized difference vegetation index (NDVI) from 18 surveillance sites in Anhui Province from 2019 to 2023. The data underwent preprocessing through multi-band composition, image mosaicking, and surface reflectance calibration to construct a spatiotemporal database. A generalized additive model (GAM) was developed using data from 2019 to 2022 and subsequently validated by predicting mosquito vector density in 2023.
Results: Univariate GAM analysis revealed that nonlinear models provided a better fit than linear models based on Akaike Information Criterion (AIC) values. Temperature, lagged temperature (temperature_1), humidity, lagged humidity (humidity_1), rainfall, lagged rainfall (rainfall_1), NDVI, and lagged NDVI (NDVI_1) all demonstrated significant nonlinear relationships with An. sinensis density (P<0.05). Specifically, NDVI (0.34–0.81), temperature (10.55 ℃–30.68 ℃), humidity (46.82%–97.61%), and rainfall (9.67 mm–440.52 mm) showed significant positive correlations with An. sinensis density. The optimal multivariate GAM incorporated lagged variables: humidity_1, NDVI_1, rainfall_1, and temperature_1. This model achieved an R² value of 0.76 on the test set, with a mean squared error (MSE) of 0.19 and a mean absolute error (MAE) of 0.28.
Conclusions: NDVI, temperature, humidity, and rainfall constitute the key environmental drivers influencing temporal patterns of An. sinensis density in Anhui Province. The GAM-based prediction model provides quantitative decision support for dynamic mosquito vector monitoring and resource allocation for malaria control.
-
Malaria is a significant global health challenge, currently endemic in 83 countries that collectively represent 40% of the world's population (1). In recent years, the gradual resumption of cross-border human mobility has led to continued occurrences of imported malaria cases in Anhui Province. Despite the achievement of local elimination, environmental conditions conducive to malaria transmission remain unchanged, creating a persistent risk of re-establishment (2–3). Malaria is fundamentally an environment-related disease, with transmission dynamics directly influenced by environmental factors such as rainfall, temperature, and humidity. Advancements in remote sensing technology now enable these environmental parameters to be derived from satellite data, providing valuable support for malaria epidemiological studies and control efforts (4–5). This study aims to explore the relationship between meteorological and environmental factors and malaria vector abundance using remote sensing technology. By leveraging these capabilities, we seek to enhance spatial risk modeling and identify reliable predictors of malaria receptivity, ultimately assisting policymakers in more effective allocation of limited resources.
Anhui Province is located in the transitional zone between warm temperate and subtropical climates, characterized by a typical monsoon climate. The annual average temperature ranges from 14 °C to 17 °C, with average annual precipitation between 800 mm and 1,800 mm. The Yangtze and Huai Rivers flow from west to east across the province, dividing Anhui into four distinct natural geographic regions: the area north of the Huai River, the Jianghuai Hills, the southern Anhui mountainous area, and the Yangtze River Plain. Based on historical malaria prevalence, Anopheles mosquito distribution, imported case incidence, and re-transmission risk, 18 counties and districts from 16 cities were selected as surveillance sites. At each site, a representative natural village was chosen as the survey point, considering factors such as natural geographic environment, crop distribution, and livestock farming (
Supplementary Table S1 ). Mosquito surveillance was conducted biweekly from May to October during 2019–2023, with each session lasting overnight (from 18:00 to 07:00 the following day). The outdoor human-baited double net trap was used for mosquito collection. An unsealed single-layer mosquito net was suspended in a residential area near an Anopheles mosquito breeding site, with its base touching the ground. One individual sat inside the inner net to attract mosquitoes. A larger open mosquito net was placed outside the inner net, and another individual entered the outer net for 15 minutes per hour to capture Anopheles mosquitoes resting on or around the inner and outer nets using a mosquito aspirator. Surveillance activities were conducted under standardized conditions, including fixed personnel, time, and locations. Data on the normalized difference vegetation index (NDVI) and humidity were obtained from the Sentinel-2A remote sensing dataset. The raw satellite data were processed through multi-band composition, image mosaicking, and surface reflectance calibration, and all bands were resampled to a uniform spatial resolution of 10 meters. A 2-km radius buffer zone was created around each surveillance site, within which environmental variables were extracted. Temperature and precipitation data were obtained from the National Meteorological Information Center of the China Meteorological Administration (http://data.cma.cn) and the Anhui Provincial Meteorological Bureau (http://ah.cma.gov.cn). To study the lag effect of environmental variables, data from the preceding surveillance cycle (approximately two weeks prior) were also collected.A generalized additive model (GAM) was used to model the data, with a negative binomial regression link function selected to address the issue of overdispersion in the data. The model was trained using data from 2019 to 2022 and then used to predict data for 2023. First, univariate analyses were conducted for each explanatory variable to identify those with a significant impact on mosquito density. Explanatory variables that showed statistical significance in univariate analyses and had relatively lower Akaike Information Criterion (AIC) values were included in the multivariate model. Stratified analyses were performed based on different geographic types. The full multivariate regression model is expressed as follows:
$$ \begin{aligned} Y= & {f}_{1}\left({Rainfall}_{-1}\right)+{f}_{2}\left({Temperature}_{-1}\right)+{f}_{3}\left({Humidity}_{-1}\right)\\ &+{f}_{4}\left({NDVI}_{-1}\right)+{\beta }_{0} \end{aligned} $$ Where the function Y is the negative binomial link function, β0 is the constant intercept term, and f is the spline smoothing function that connects the explanatory variables. All analyses were conducted in R software (version 4.4.3; R Core Team, Vienna, Austria).
From May 2019 to October 2023, a total of 12,094 female An. sinensis mosquitoes were captured. The highest number was recorded in early July, with 2,674 specimens accounting for 22.11% of the total catch. In the univariate GAM analysis, nonlinear models demonstrated a better fit than linear models based on the AIC. Results showed that temperature, lagged temperature (temperature_1), humidity, lagged humidity (humidity_1), rainfall, lagged rainfall (rainfall_1), NDVI, and lagged NDVI (NDVI_1) were all significant nonlinear explanatory variables for An. sinensis density (P<0.05). Among these, NDVI (0.34–0.81), temperature (10.55 ℃–30.68 ℃), humidity (46.82%–97.61%), and rainfall (9.67 mm–440.52 mm) showed significant positive correlations with An. sinensis density (
Supplementary Figure S1 andSupplementary Table S2 ). The optimal parameters for the multivariate GAM model were lagged humidity (humidity_1), lagged NDVI (NDVI_1), lagged rainfall (rainfall_1), and lagged temperature (temperature_1). The model’s AIC value was 7764.05, explaining 56% of the deviance. When tested, the model achieved an R² value of 0.76, with a mean squared error (MSE) of 0.19 and a mean absolute error (MAE) of 0.28 (Table 1 and Figure 1). The changes in An. sinensis density across different geographical regions of Anhui Province in relation to environmental factors are shown in Figure 2 andSupplementary Figure S2 .Variable Estimate edf χ2 P Intercept −4.43 <0.001 s (NDVI_1) Smooth 3 5.43 <0.01 s (Rainfall_1) Smooth 3 4.50 <0.001 s (Temperture_1) Smooth 3 7.69 <0.001 s (Humidity_1) Smooth 3 5.25 <0.5 Abbreviation: s( )=Smooth( ); edf=effective degrees of freedom; GAM=generalized additive model. Table 1. Outputs of multivariate regression from the GAM.
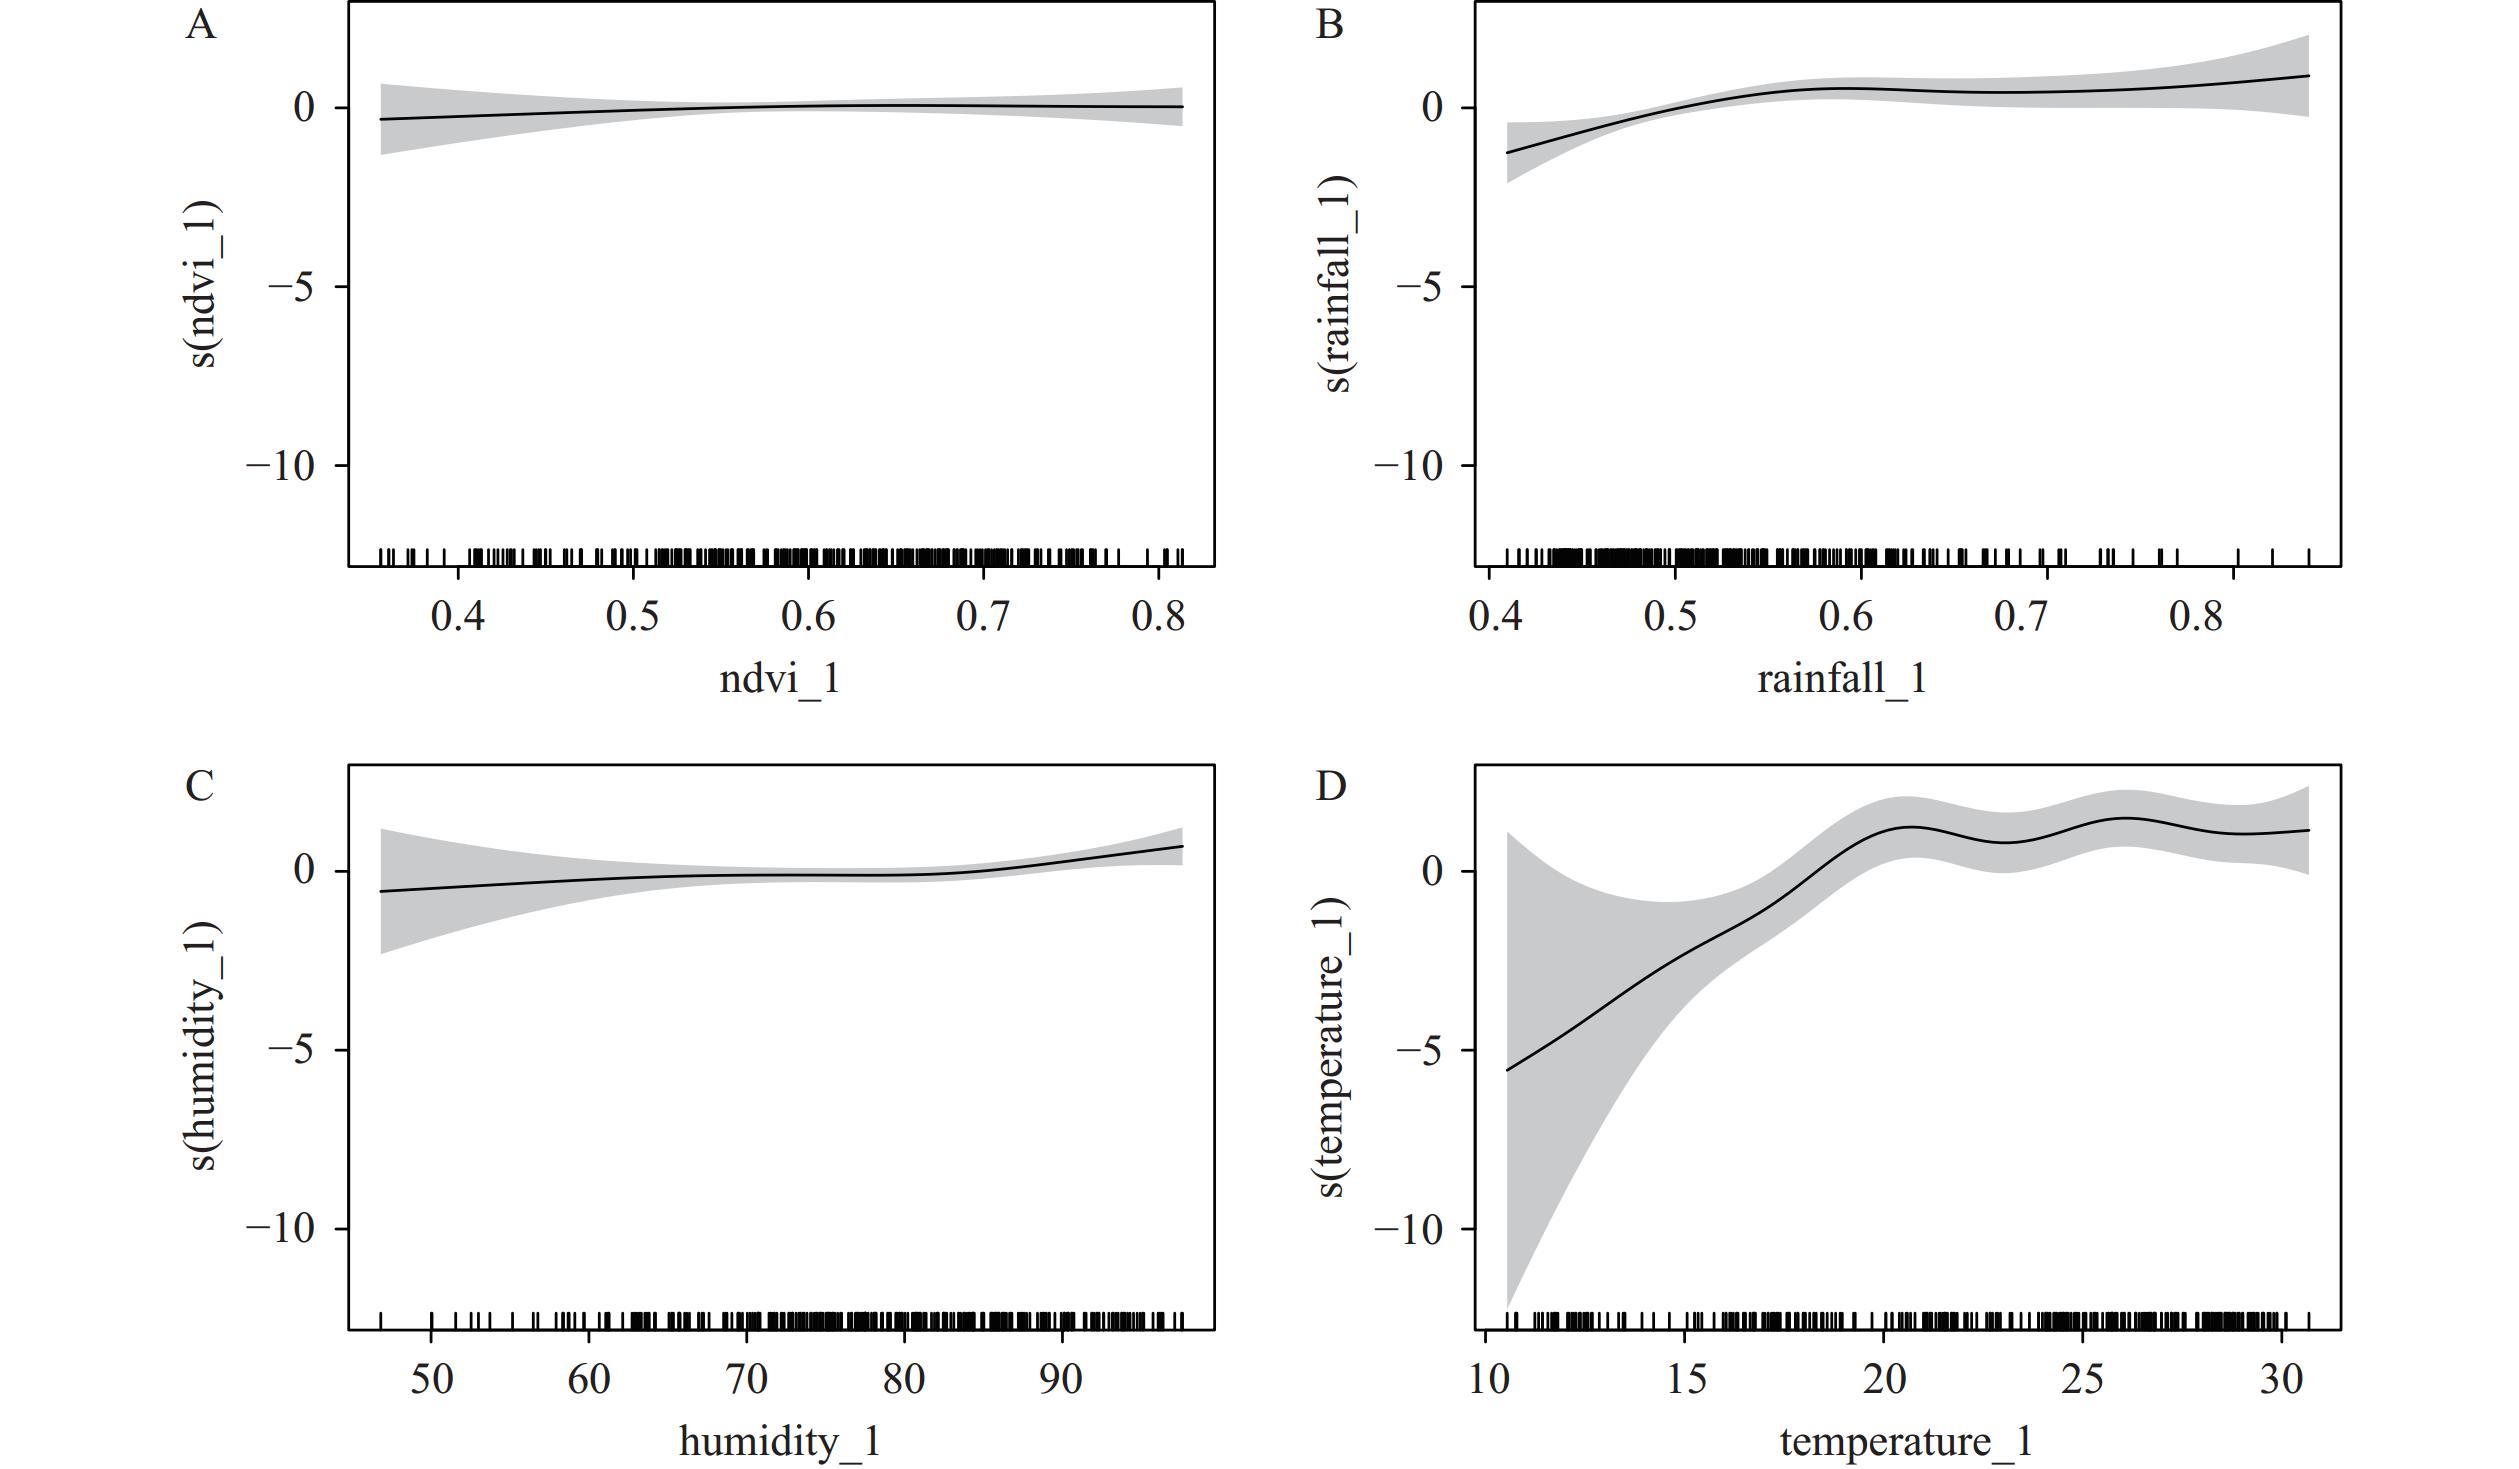 Figure 1.
Multifactor analysis of environmental factors' impact on Anopheles density. (A) impact of lagged NDVI (ndvi_1); (B) impact of lagged rainfall (rainfall_1); (C) impact of lagged humidity (humidity_1); (D) impact of lagged temperature (temperature_1).
Note: The vertical axis represents the smoothed effect value, indicating the magnitude of impact on Anopheles density.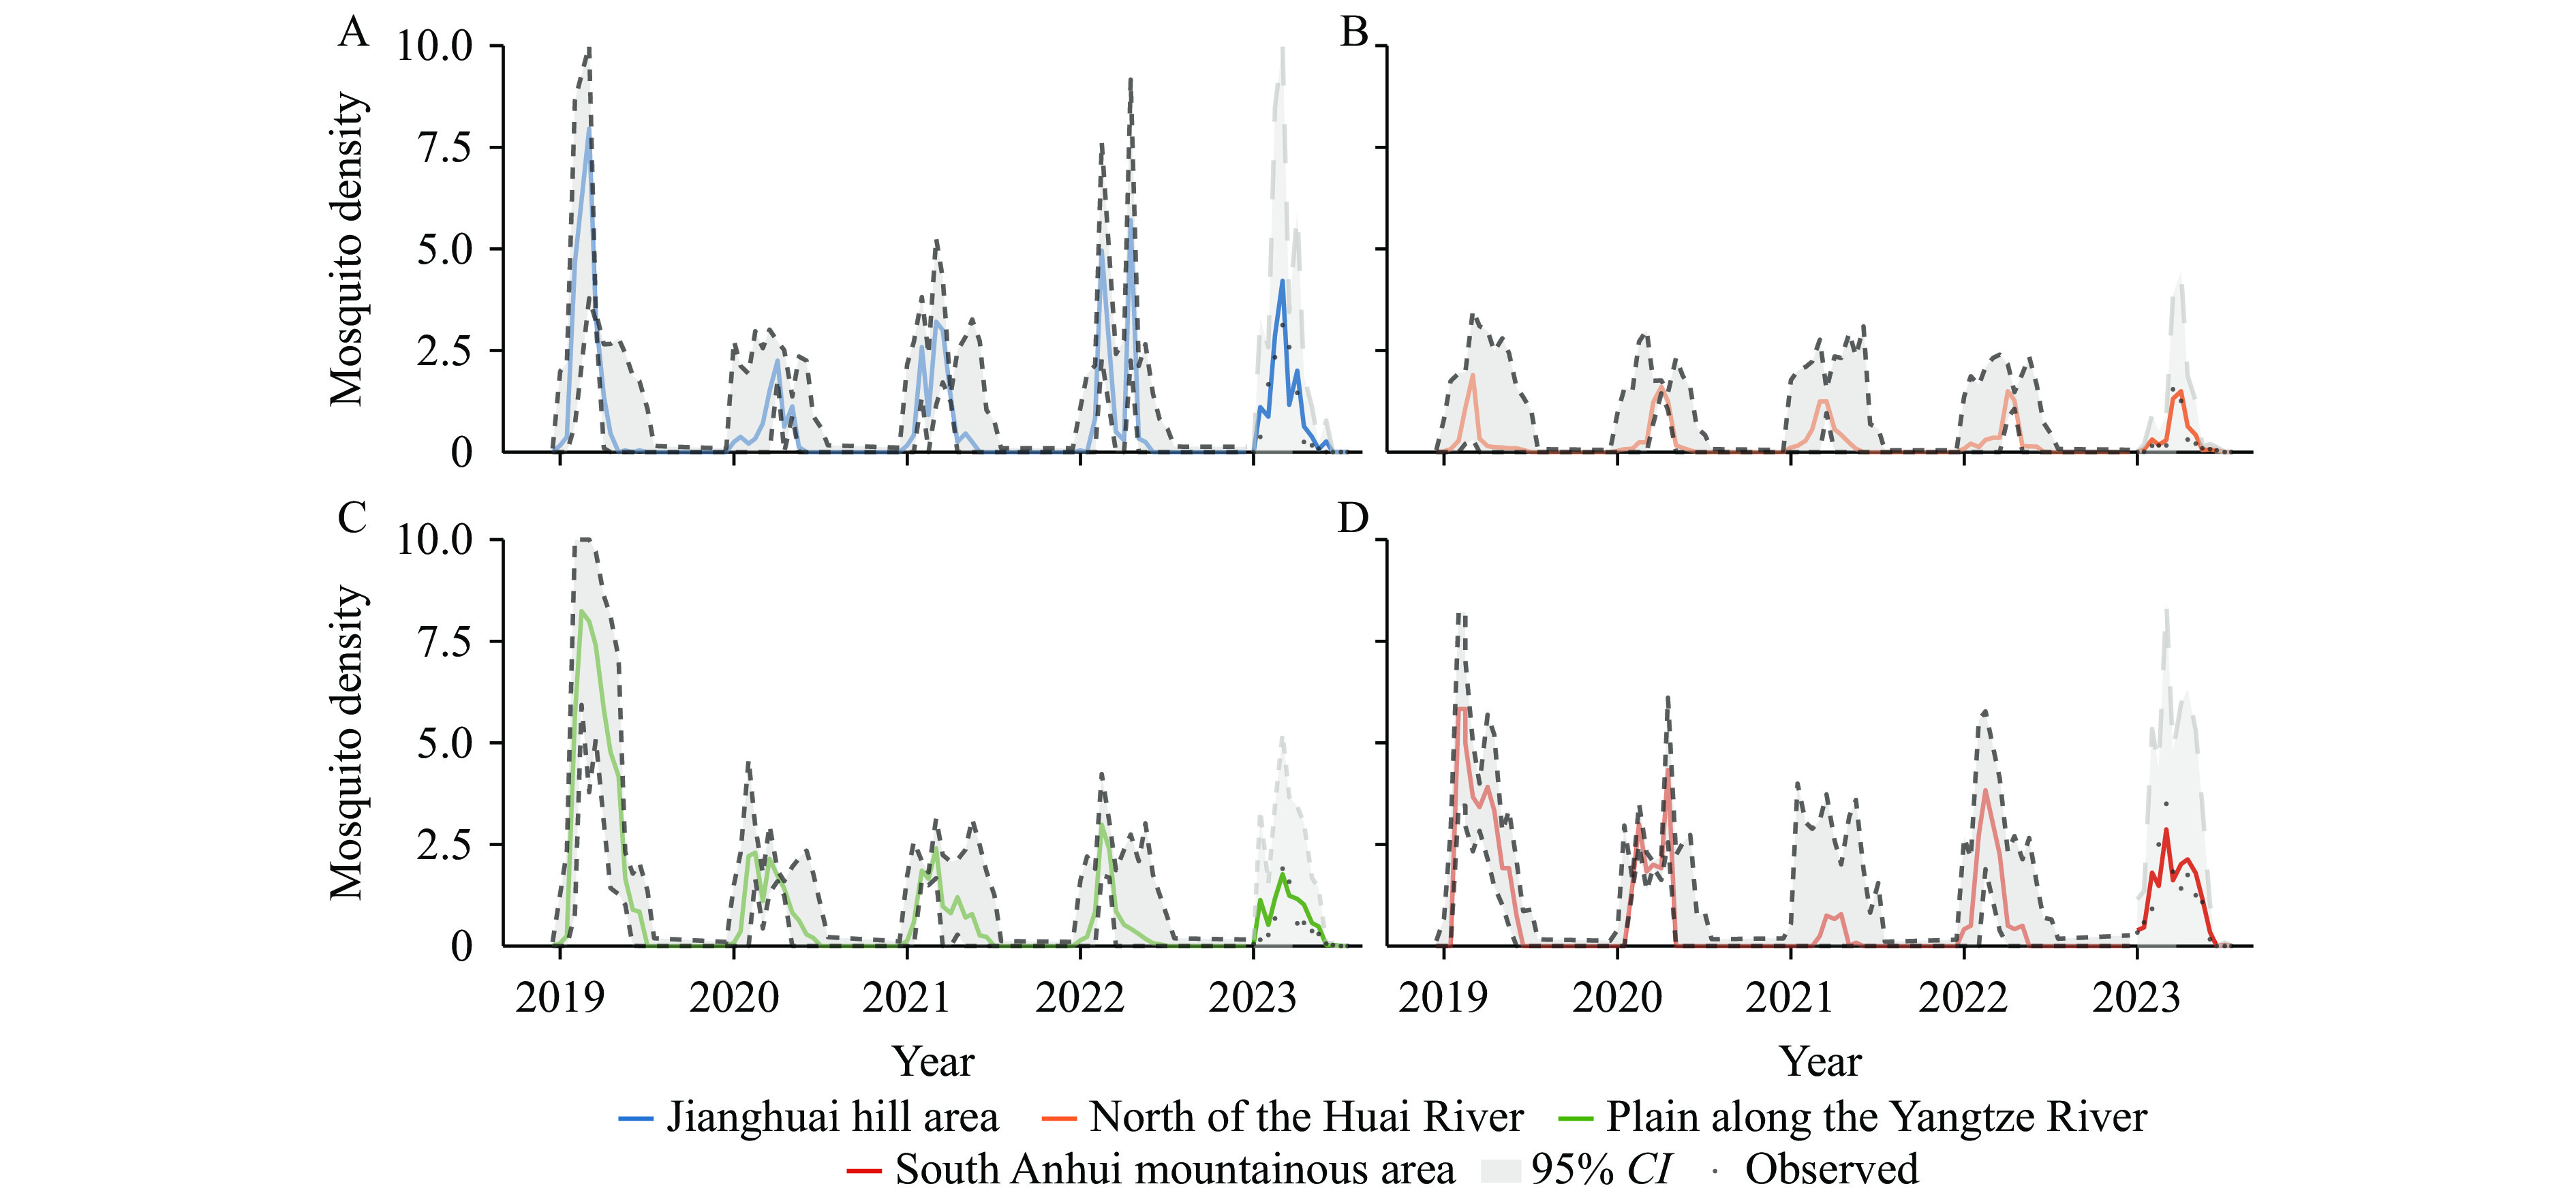 Figure 2.
Comparison of observed Anopheles density values from 2019 to 2022 with fitted and predicted values for 2023. (A) Jianghuai hill area; (B) North of the Huai River; (C) Plain along the Yangtze River; (D) South Anhui mountainous area.
Abbreviation: CI=confidence interval. -
In this study, we identified NDVI, temperature, humidity, and rainfall as the key factors influencing the temporal patterns of An. sinensis density in Anhui Province. The seasonal pattern of mosquito infestation closely correlates with seasonal variations in these environmental parameters. Low temperatures adversely affect An. sinensis survival, significantly reducing adult mosquito infestation rates and egg hatching rates, which leads to substantial population decline (6). Nevertheless, mosquito populations rebound during summer months.
David Roiz et al. (7) suggested that environmental data from weeks preceding the emergence of high-risk populations should be prioritized to facilitate effective vector control strategies and malaria prevention planning. Accordingly, we incorporated the nonlinear effects of NDVI, temperature, humidity, and rainfall with a two-week lag into our multivariable GAM. The model demonstrated that Anopheles mosquito density exhibits an overall increasing trend with NDVI. Additionally, mosquito density increases with rainfall, but this effect gradually diminishes after rainfall exceeds 190 mm. Previous studies have indicated that NDVI can serve as an indicator of suitable mosquito habitat conditions. Increased rainfall and NDVI may create more favorable breeding sites and reduce human activity, thereby contributing to higher mosquito densities (8).
When temperature falls below 20 °C, even slight variations have a markedly pronounced effect on Anopheles density. As temperature increases, the number of Anopheles rises sharply. Above 20 °C, the relationship between temperature and mosquito density is approximately linear and positive. However, when maximum temperature reaches around 28 °C, the influence of temperature fluctuations on Anopheles density becomes less apparent. This phenomenon may be attributed to the mosquito population already achieving a relatively high density in the environment. Under optimal thermal conditions, Anopheles density tends to stabilize, thereby diminishing the impact of temperature variations on population dynamics. When humidity ranges between 70% and 80%, it exhibits a roughly linear negative effect on mosquito populations. Both temperature and humidity are known to influence mosquito biting rates (9) and survival rates (10). The observed negative impact of humidity in this range may result from complex interactions among multiple climatic factors (11). Our multivariable model explained 56% of the deviance, indicating that it captured over half of the variability in the target variable. The predictive performance, assessed using the coefficient of determination (R²), yielded an R² value of 0.76, demonstrating a strong correlation between predicted and observed values. Furthermore, through regional faceted visualizations, the model effectively captured the spatial heterogeneity and temporal dynamics of Anopheles density. The banded regions of the confidence intervals further validated that the model’s uncertainty was within a reasonable range, providing reliable predictions of mosquito density dynamics. These results offer valuable insights for informing malaria control strategies. The strength of this study lies in our use of high-resolution remote sensing imagery to extract environmental factors, ensuring the reliability and accuracy of the independent variables. Additionally, we have accounted for lag effects. However, this study did not account for other factors that influence malaria transmission, such as agricultural irrigation, urbanization, and human mobility.
This study highlights the importance and usefulness of remote sensing technology in vector population monitoring, which will benefit efforts to prevent the re-establishment of malaria transmission. It investigates trends in vector population dynamics and the combined effects of environmental factors, emphasizing their significance in predicting and assessing the risk of local malaria re-introduction. The application of multivariate models and an understanding of climate impacts on the mosquito life cycle provide valuable insights for malaria control managers, aiding in the spatial and temporal allocation of resources to formulate cost-effective decisions and policies. In areas where an abnormal surge in malaria vector populations is forecasted, it is imperative to increase investment in managing mosquito breeding sites. This encompasses removing stagnant water and enhancing environmental sanitation. Furthermore, efforts should be intensified to improve the diagnostic capabilities of local primary healthcare institutions. Concurrently, targeted awareness-raising campaigns should be launched to heighten preventive awareness among residents.
HTML

| Citation: |

|