
 Download:


-
Introduction: Esophageal squamous cell carcinoma (ESCC) and adenocarcinoma (EAC) are the two primary subtypes of esophageal cancer. Historically, ESCC incidence has exceeded EAC, particularly in East Asia, Southern Africa, and parts of South America. However, in recent decades, EAC incidence has risen markedly in high-income countries due to lifestyle changes. Using the latest Cancer Incidence in Five Continents (CI5) data, we aimed to analyze global temporal trends and sex differences in the burden of ESCC and EAC.
Methods: We extracted ESCC and EAC incidence data from 25 countries in CI5 Volumes VIII-XII (1993–2017) for trend analysis. Age-standardized incidence rates (ASIRs) and ESCC-to-EAC ASIR ratios were calculated using Segi’s World Standard Population, and annual percentage changes were estimated using Joinpoint regression. Additionally, we evaluated male-to-female ASIR ratios using data from 53 countries in CI5 Volume XII (2013–2017).
Results: Between 1993–2017, ESCC ASIRs declined in 19 countries but increased in Japan, the Czech Republic, Latvia, Denmark, and Lithuania. Conversely, EAC ASIRs increased in 17 countries, with the Republic of Korea being the only country reporting a decline. ESCC-to-EAC ASIR ratios narrowed in most countries, with EAC surpassing ESCC among males in 10 countries, including the United States, and among females only in the Philippines. From 2013–2017, males exhibited consistently higher ASIRs than females for both subtypes, with more pronounced sex differences observed for EAC.
Conclusions: This study highlights the changing epidemiology of ESCC and EAC globally and provides important scientific evidence for tailoring prevention and control strategies based on regional and histological-specific trends.
-
Esophageal cancer (EC) is among the top ten causes of cancer-related mortality worldwide, with notable geographical and histological variation. The two primary subtypes, esophageal squamous cell carcinoma (ESCC) and adenocarcinoma (EAC) (1), differ significantly in risk factors, incidence trends, and regional distribution. Historically, ESCC has been the predominant subtype globally, particularly in the East Asia, Southern Africa, and parts of South America. In contrast, EAC incidence has risen markedly in high-income countries over recent decades (2), driven by lifestyle changes and raising public health concerns. Using data from Cancer Incidence in Five Continents (CI5) Volumes VIII–XII (1993–2017), this study provides a detailed analysis of ESCC and EAC trends across 25 countries, focusing on age-standardized incidence rates (ASIRs), sex differences, and the evolution of ESCC-to-EAC ASIR ratios. Between 1993 and 2017, ESCC ASIRs declined in 19 countries but increased in others, including Japan, the Czech Republic, Latvia, Denmark, and Lithuania. Conversely, EAC ASIRs increased in 17 countries, with the Republic of Korea being the only country to report a decline. Narrowing ESCC-to-EAC ASIR ratios were observed in most countries, with EAC surpassing ESCC among males in 10 countries, including the United States, the United Kingdom, and Germany, and among females only in the Philippines. From 2013 to 2017, males consistently exhibited higher ASIRs than females for both subtypes, with more pronounced sex differences in EAC. These findings highlight the evolving epidemiology of EC subtypes and offer valuable insights for tailoring prevention and control strategies to regional and histological-specific trends.
We extracted data on the incidence of ESCC and EAC by year of diagnosis, sex, and 5-year age group from national and regional population-based cancer registries included in CI5 VIII to XII (3). From 103 cancer registries across 39 countries reporting 25 consecutive years of data (1993–2017), we excluded registries with fewer than five ESCC/EAC cases (n=50), populations below 500,000 (n=0), or over 75% of EC cases are classified as unspecified (n=0) in each volume (
Supplementary Figure S1 ). When national data were unavailable, we aggregated regional registries. In total, 53 registries from 25 countries were included in trend analysis from 1993 to 2017. Additionally, we analyzed 248 registries from 53 countries in CI5 Volume XII (2013–2017) to evaluate sex differences at the country level. ASIRs were calculated using Segi’s World Standard Population, and annual percentage changes (APCs) were estimated using Joinpoint regression. Statistical analyses were performed using R, version 4.2.3 (R Foundation for Statistical Computing, Vienna, Austria) and the Joinpoint Regression Program, version 5.2.0.0 (Statistical Methodology and Applications Branch, Surveillance Research Program, National Cancer Institute).From 1993 to 2017, the ASIRs for ESCC declined significantly in 19 countries, with the most substantial decline observed in the Philippines [APC −6.71%, 95% confidence interval (CI): −10.42% to −3.53%]. However, significant increasing trends were identified in five countries, with Latvia showing the highest increase (APC 4.92%, 95% CI: 2.11% to 8.60%) (Table 1). For EAC, ASIRs increased significantly in 17 countries, with the Czech Republic experiencing the most dramatic rise (APC 6.27%, 95% CI: 4.86% to 8.19%). In contrast, the Republic of Korea was the only country to report a significant decline in EAC incidence (APC −3.84%, 95% CI: −4.86% to −2.77%). Among males, notable reductions in ESCC ASIRs were observed in Italy (APC −4.83%, 95% CI: −5.31% to −4.34%), while the most pronounced increase in EAC ASIRs was reported in Norway (APC 5.18%, 95% CI: 4.28% to 6.37%). Similarly, females in the Philippines demonstrated the most significant reduction in ESCC ASIRs, whereas females in the Czech Republic exhibited the largest rise in EAC ASIRs (Table 1).
Country APC, % (95% CI) ESCC EAC Both Males Females Both Males Females Australia –1.83
(–2.44, –1.22)*–1.68
(–2.65, –0.66)*–2.03
(–3.14, –0.91)*1.81
(0.62, 3.26)†1.77
(0.49, 3.32)†1.29
(–0.04, 2.82)Canada –2.53
(–4.06, –1.01)*–2.61
(–4.67, –0.53)*–2.35
(–4.19, –0.55)*2.54
(1.77, 3.50)†2.29
(1.17, 3.68)†3.43
(1.85, 5.52)†Colombia –4.90
(–10.25, 0.35)–4.25
(–7.51, –1.20)*–5.37
(–10.23, –0.62)*–1.85
(–5.21, 1.91)–1.42
(–5.01, 2.79)–1.63
(–8.10, 6.31)Croatia –1.77
(–2.75, –0.88)*–2.00
(–3.27, –0.82)*–1.20
(–6.20, 3.53)3.59
(1.54, 6.00)†3.99
(1.18, 7.55)†0.21
(–4.27, 4.88)Czech Republic 1.38
(0.96, 1.84)†0.73
(0.56, 0.91)†4.91
(2.25, 8.38)†5.07
(3.17, 7.62)†4.67
(2.95, 7.00)†6.27
(4.86, 8.19)†Denmark 0.73
(–0.41, 2.00)0.72
(–0.98, 2.64)0.65
(0.39, 0.95)†2.28
(1.56, 3.13)†1.90
(1.43, 2.47)†3.26
(2.34, 4.38)†France –3.37
(–4.28, –2.55)*–4.20
(–4.90, –3.57)*0.55
(–0.54, 1.75)1.75
(1.11, 2.44)†1.75
(1.33, 2.22)†0.56
(–2.98, 4.60)Germany –2.85
(–3.95, –1.85)*–3.46
(–4.36, –2.59)*–0.83
(–3.67, 1.84)4.99
(1.41, 9.50)†4.76
(–0.79, 11.74)4.72
(0.58, 9.96)†India –3.65
(–4.41, –2.94)*–3.71
(–6.59, –1.02)*–3.51
(–4.42, –2.62)*–2.26
(–10.79, 6.30)–1.17
(–12.14, 10.76)–4.63
(–14.13, 4.74)Ireland –1.16
(–1.85, –0.38)*–1.16
(–2.43, 0.25)–1.14
(–1.68, –0.56)*1.36
(0.39, 2.51)†1.39
(0.16, 2.90)†0.49
(–1.16, 2.43)Israel –1.80
(–3.36, –0.24)*–2.66
(–3.70, –1.65)*–0.89
(–2.64, 0.91)–0.93
(–1.95, 0.14)–1.24
(–2.82, 0.41)–0.24
(–2.24, 1.92)Italy –4.02
(–4.33, –3.69)*–4.83
(–5.31, –4.34)*–1.35
(–3.16, 0.96)1.64
(1.01, 2.48)†1.50
(0.62, 2.63)†–0.04
(–2.69, 3.95)Japan 2.50
(1.62, 3.48)†2.23
(1.40, 3.15)†3.49
(2.10, 5.05)†4.46
(2.16, 7.15)†4.46
(2.59, 6.65)†3.15
(0.99, 5.63)†Latvia 1.90
(0.25, 3.54)†1.52
(–0.64, 3.64)4.92
(2.11, 8.60)†3.97
(–0.13, 8.60)4.36
(2.83, 6.23)†2.11
(–7.25, 11.66)Lithuania 2.65
(–0.67, 6.40)2.46
(–0.46, 5.79)4.06
(2.63, 5.65)†0.51
(–6.22, 7.50)0.68
(–4.46, 5.89)–0.39
(–4.78, 3.89)New Zealand –1.52
(–1.85, –1.18)*–2.46
(–3.21, –1.73)*–0.50
(–2.36, 1.53)1.53
(–0.23, 3.62)1.29
(–1.17, 4.26)2.42
(1.64, 3.28)†Norway –1.50
(–2.20, –0.79)*–2.16
(–2.79, –1.55)*–0.20
(–1.25, 0.91)5.37
(3.82, 7.58)†5.18
(4.28, 6.37)†4.96
(0.49, 11.10)†Philippines –4.52
(–7.34, –1.94)*–3.68
(–7.28, –0.29)*–6.71
(–10.42, –3.53)*–0.28
(–3.59, 3.71)–0.76
(–5.09, 4.19)0.79
(–4.21, 7.60)Slovenia –2.13
(–3.17, –1.13)*–2.83
(–3.82, –1.91)*0.70
(–2.51, 4.09)2.90
(–0.82, 7.32)3.26
(1.08, 6.04)†–1.40
(–12.64, 9.02)Republic of Korea 0.10
(–0.63, 1.02)–0.29
(–1.35, 1.00)0.20
(–2.11, 3.13)–3.84
(–4.86, –2.77)*–4.05
(–7.71, 0.11)–4.47
(–9.72, 0.52)Spain –2.81
(–4.84, –0.98)*–3.18
(–5.28, –1.34)*1.56
(–4.02, 7.51)3.48
(0.80, 6.56)†3.52
(0.77, 6.83)†0.80
(–1.61, 3.27)Switzerland –2.55
(–3.30, –1.84)*–3.05
(–3.16, –2.95)*–1.45
(–4.28, 1.39)1.58
(–0.03, 3.40)1.44
(–0.82, 4.07)0.63
(–0.19, 1.50)The Netherlands –0.34
(–1.27, 0.69)–0.96
(–1.68, –0.19)*0.52
(–0.08, 1.19)4.57
(2.84, 6.97)†4.39
(1.92, 7.82)†4.28
(3.51, 5.24)†United Kingdom –1.41
(–1.75, –1.08)*–1.57
(–2.07, –1.09)*–1.30
(–2.06, –0.56)*1.32
(0.98, 1.69)†1.41
(0.99, 1.85)†0.38
(0.06, 0.70)†United States –3.47
(–3.94, –3.06)*–3.73
(–3.97, –3.52)*–3.09
(–4.21, –2.04)*1.42
(–0.33, 3.44)1.27
(–0.47, 3.29)1.55
(–0.57, 3.99)Abbreviation: APC=annual percentage change; ESCC=esophageal squamous cell carcinoma; EAC=esophageal adenocarcinoma; CI=confidence interval.
* indicates significant decreasing trends.
† indicates significant increasing trends.Table 1. The trends in age-standardized incidence rates of esophageal squamous cell carcinoma and esophageal adenocarcinoma by sex and country from 1993 to 2017.
Although ASIRs for ESCC have historically been higher than those for EAC, the ESCC-to-EAC ASIR ratios gradually and significantly narrowed in most countries from 1993 to 2017, driven by declining ASIRs for ESCC and rising ASIRs for EAC. Exceptions to this trend were observed in Lithuania, where the ratio increased from 6.07 to 10.22, and in the Republic of Korea, where it rose substantially from 15.87 to 39.25. By 2017, EAC ASIRs surpassed ESCC ASIRs among males in 10 countries, including Australia, Canada, Denmark, Germany, Ireland, Israel, Norway, the Netherlands, the United Kingdom, and the United States. Among females, this transition occurred only in the Philippines. In contrast, Asian countries such as India, Japan, and the Republic of Korea continued to report ESCC ASIRs more than ten times higher than those for EAC (Figure 1).
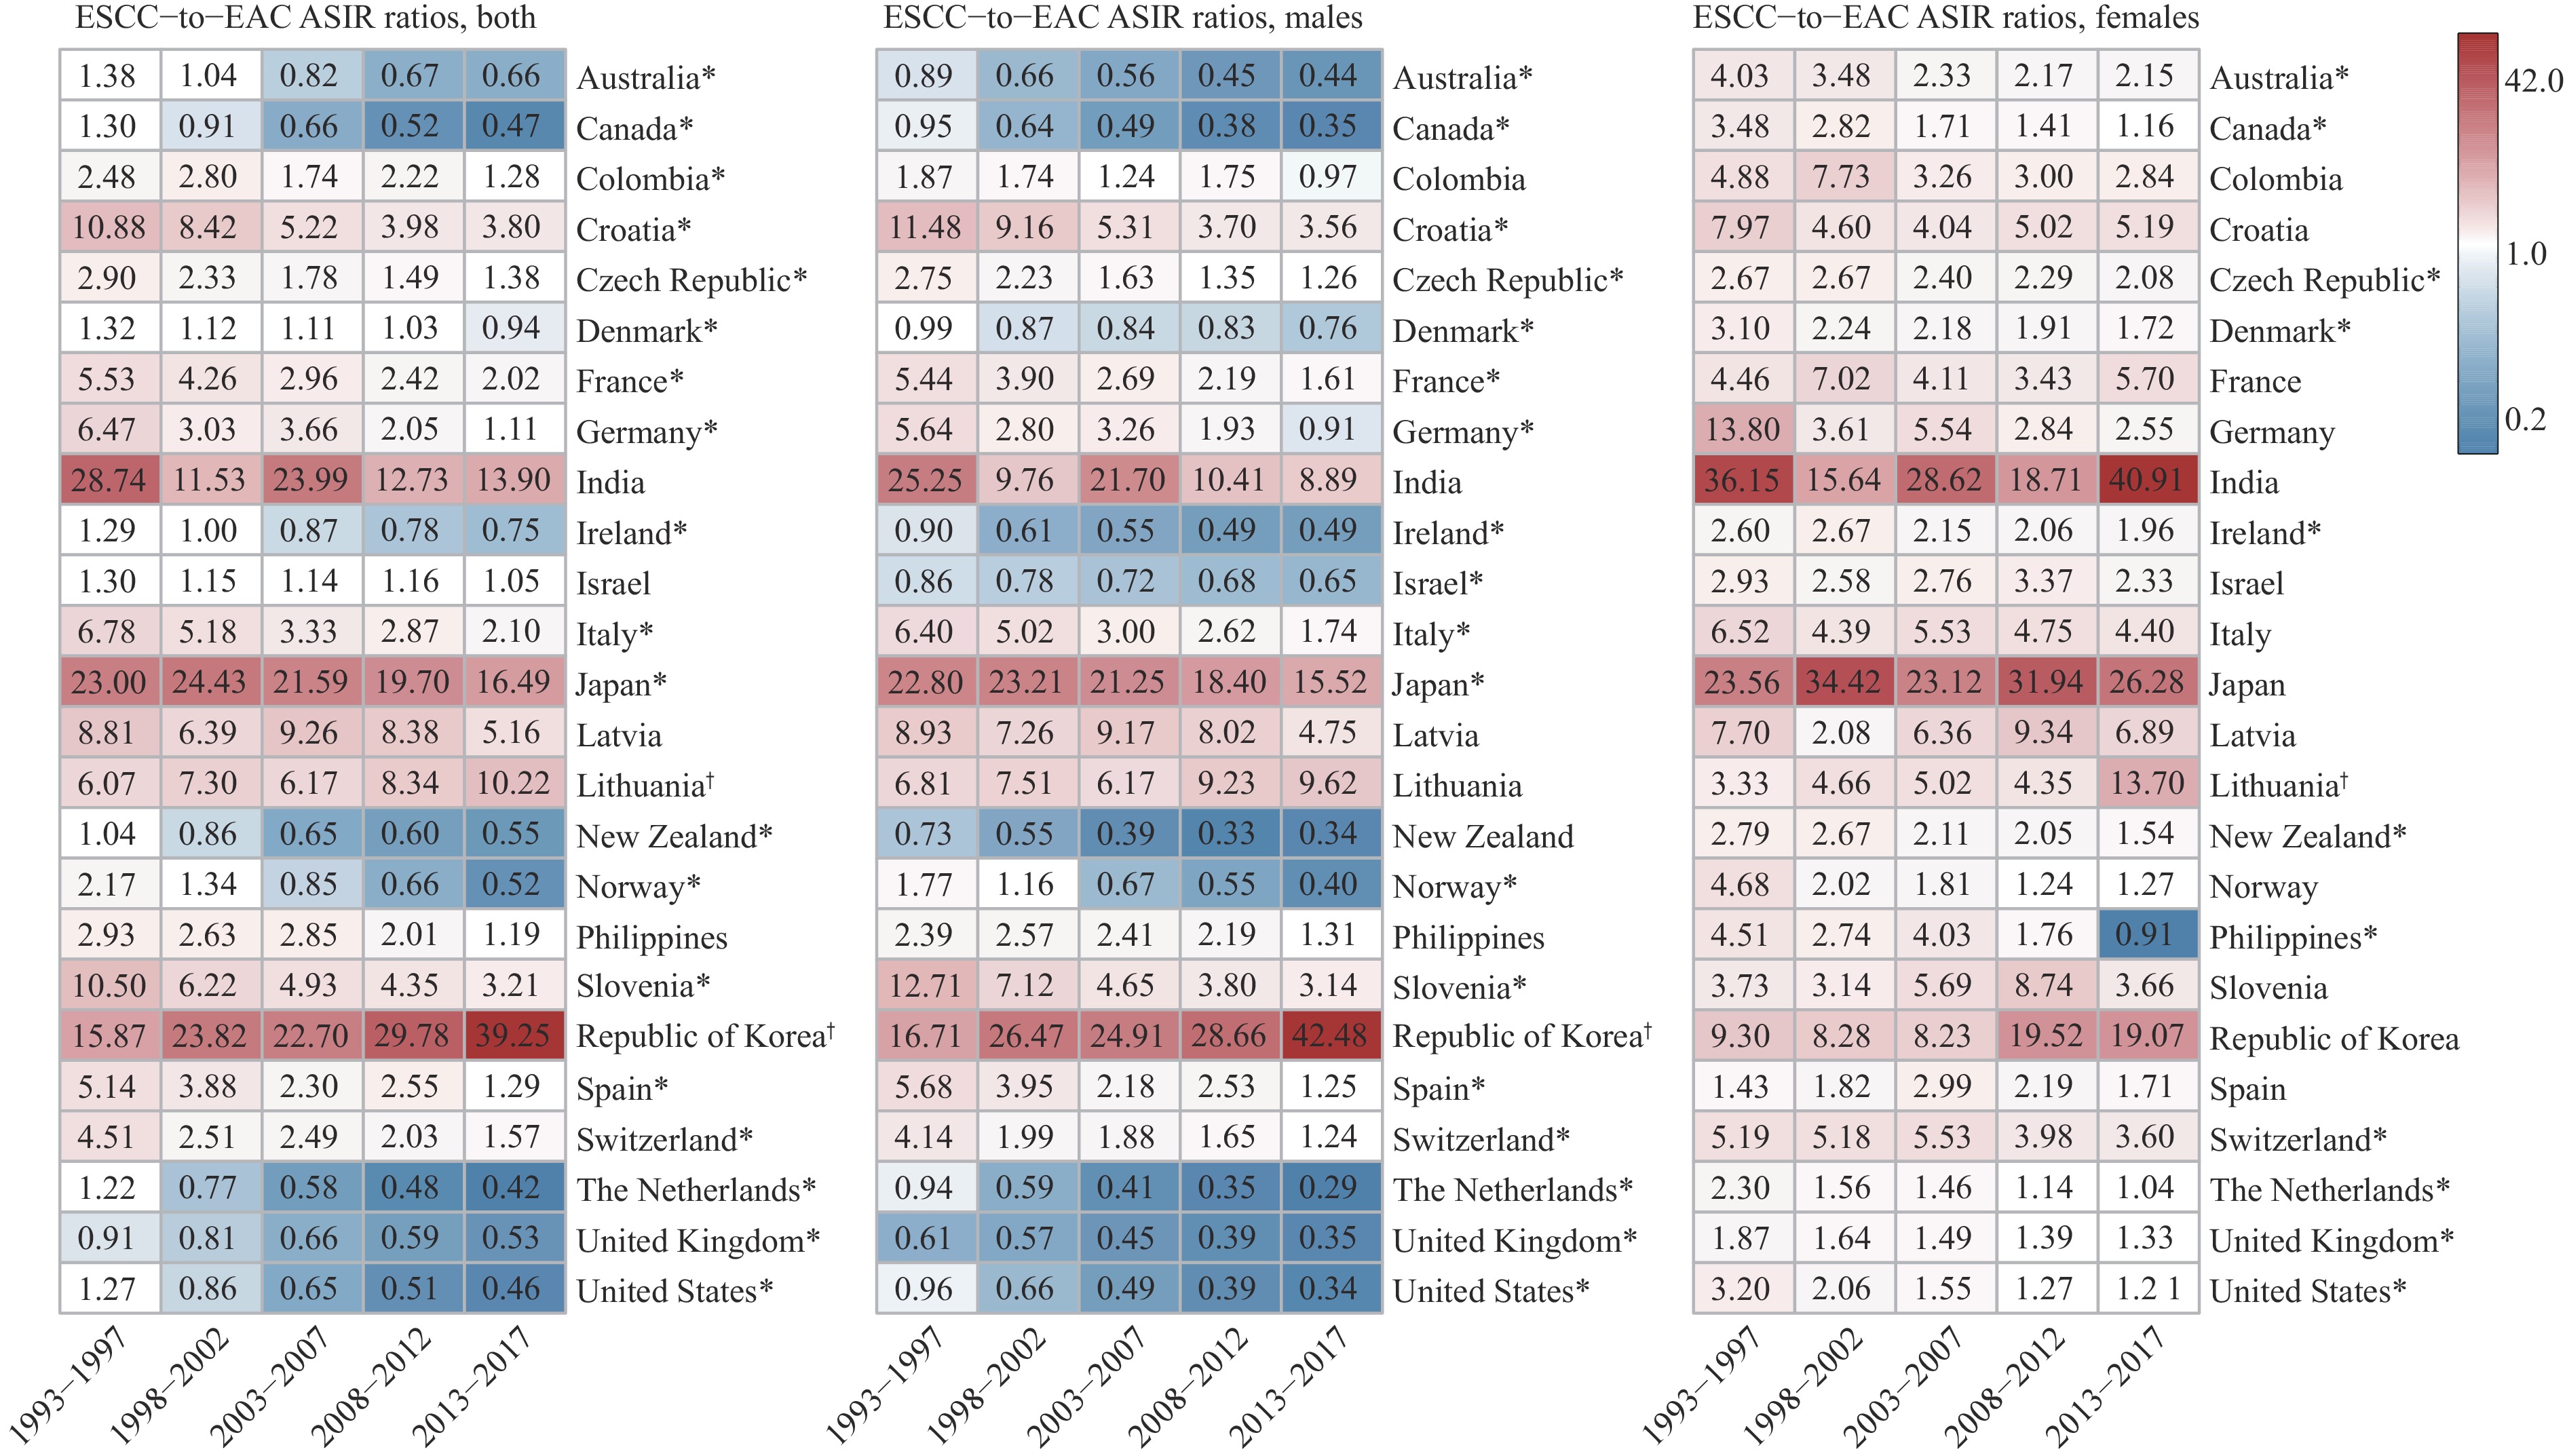 Figure 1.
The ratios of age-standardized incidence rates for esophageal squamous cell carcinoma and esophageal adenocarcinoma by sex and country from 1993 to 2017.
Note: Blue represents ESCC<EAC, and red represents ESCC>EAC.
Abbreviation: ASIR=age-standardized incidence rates; ESCC=esophageal squamous cell carcinoma; EAC=esophageal adenocarcinoma.
* indicates significant decreasing trends.
† indicates significant increasing trends.
Sex-specific analyses showed that males consistently had higher ASIRs for both ESCC and EAC compared to females across most countries, with more pronounced sex differences observed for EAC, as shown in Figure 2. Particularly striking disparities were observed in countries such as Ukraine, Spain, Poland, Lithuania, Latvia, and France, where male-to-female ASIR ratios exceeded 10.0∶1. However, even greater sex disparities were noted in specific countries for ESCC, including Ukraine, the Republic of Korea, and Belarus, with male-to-female ASIR ratios of 16.67∶1, 13.37∶1, and 15.58∶1, respectively.
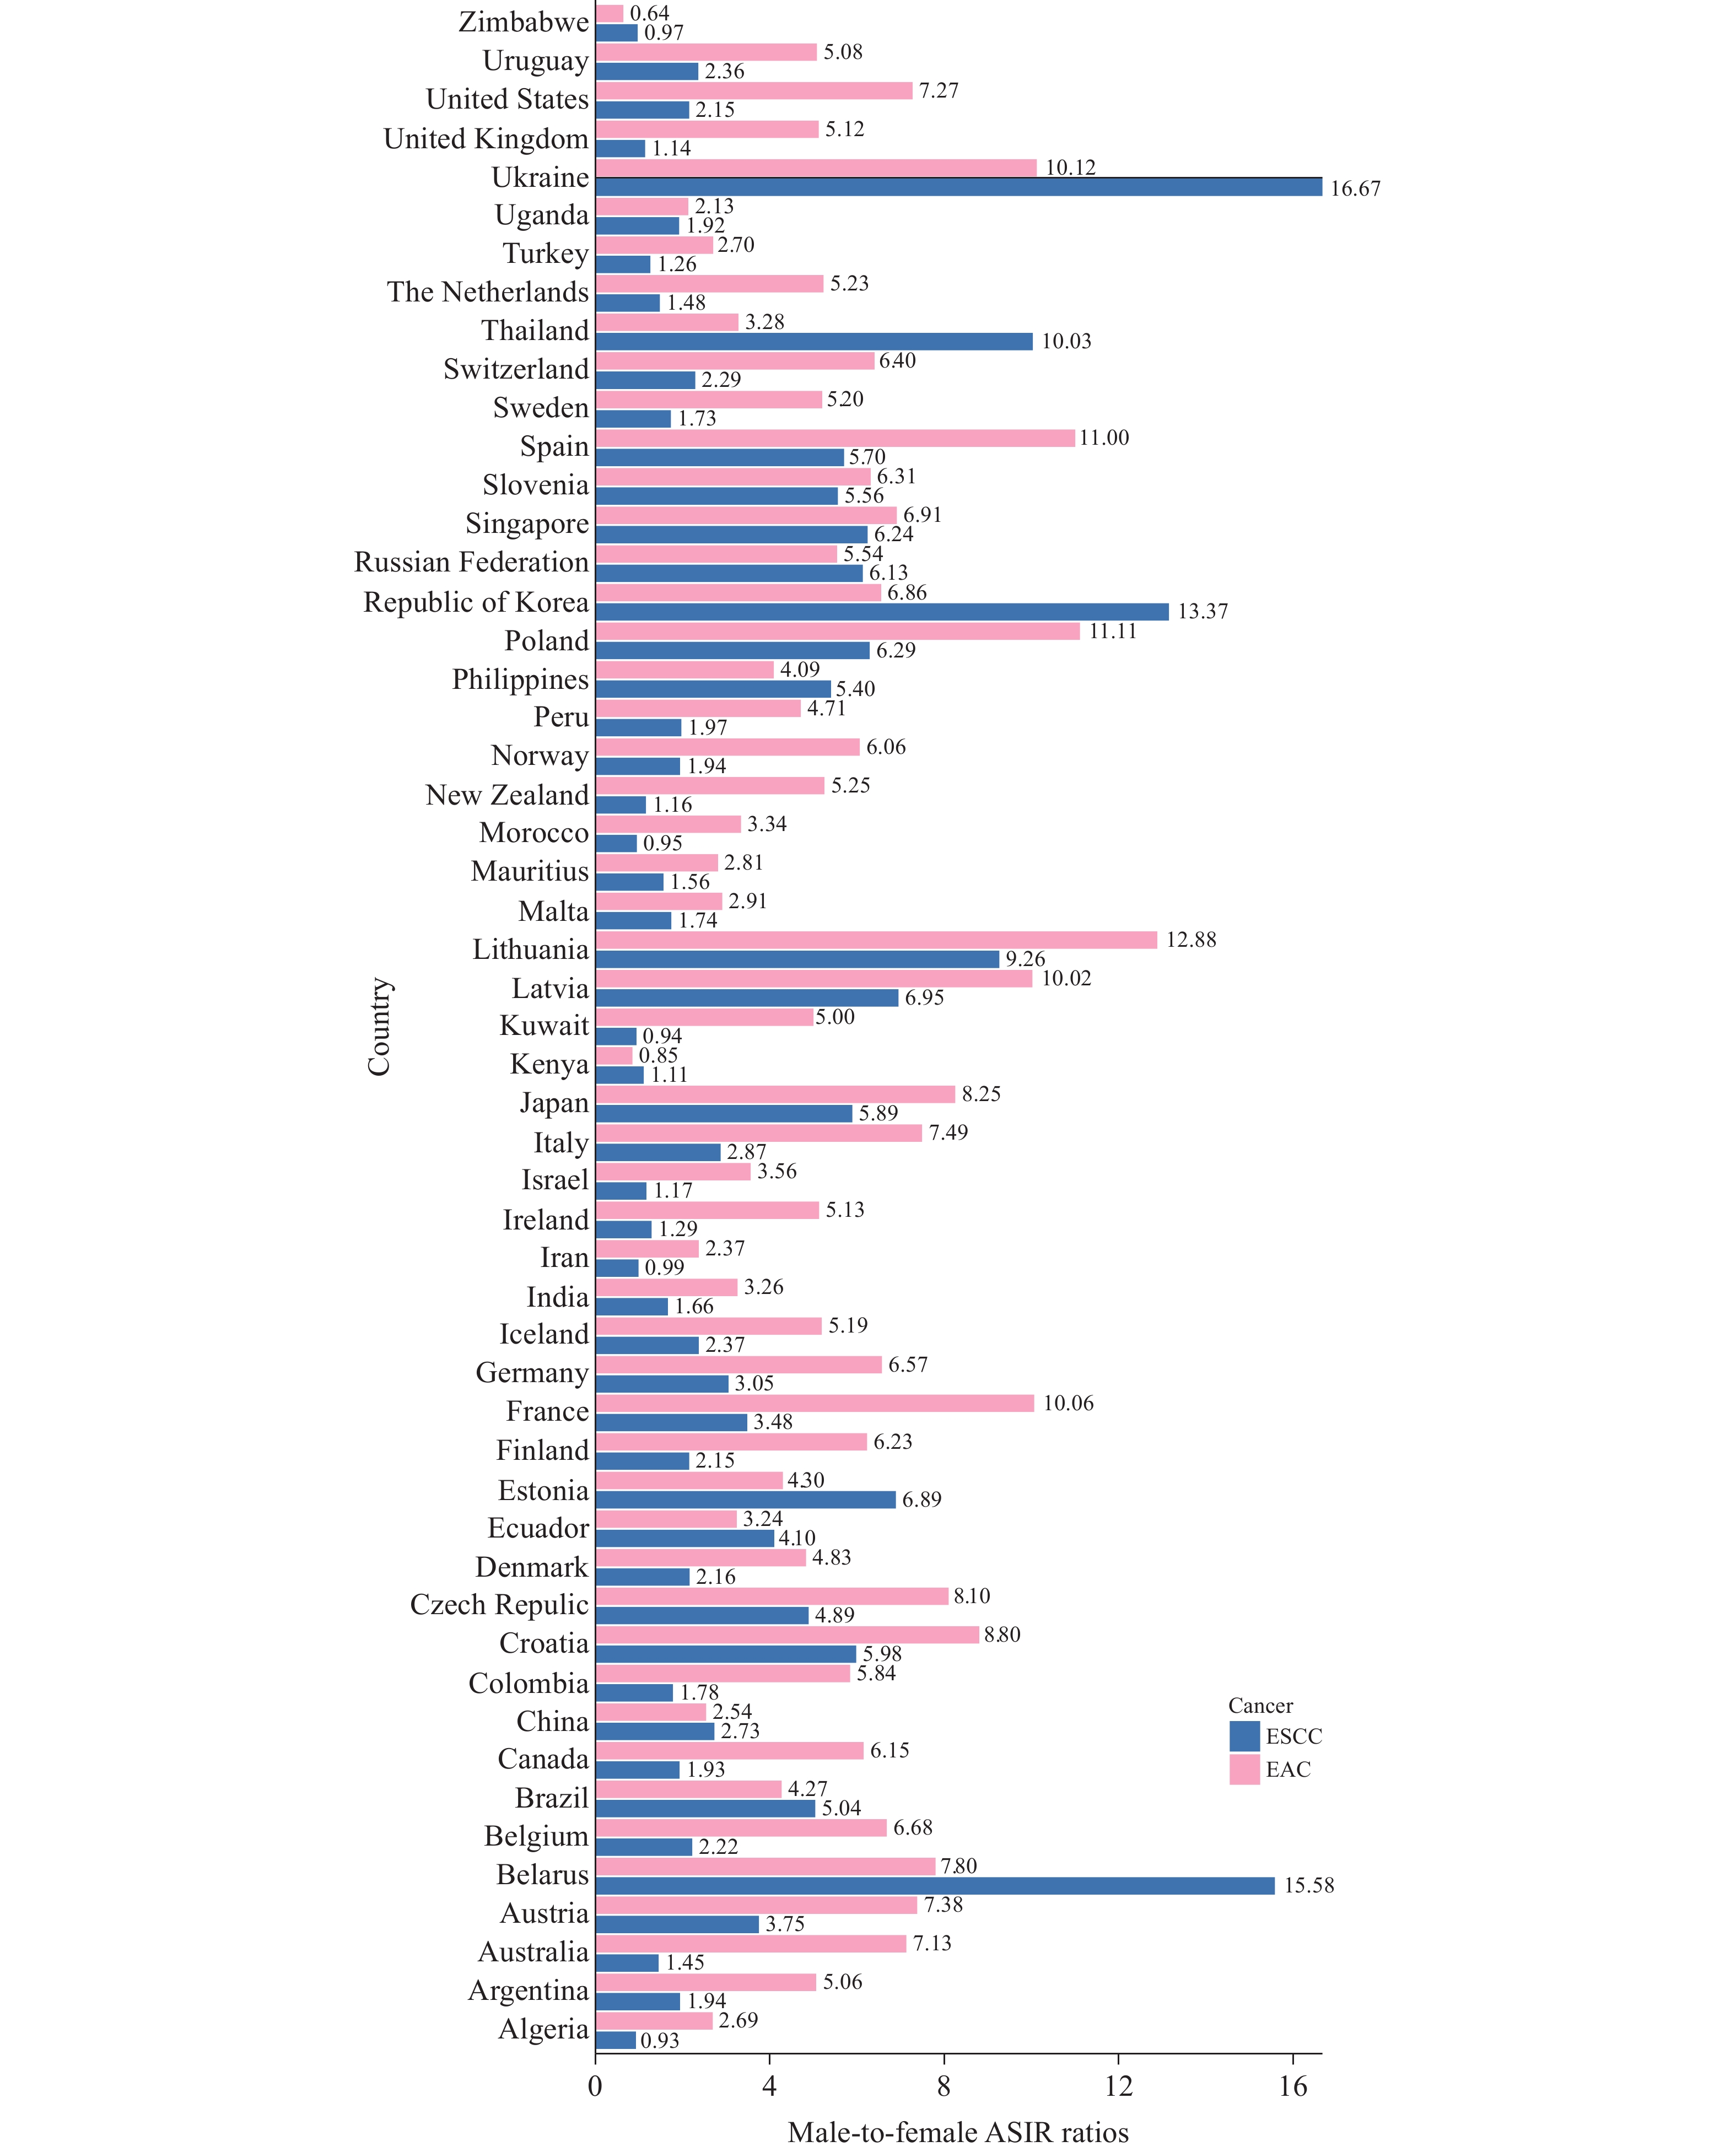 Figure 2.
The male-to-female age-standardized incidence rate ratios for esophageal squamous cell carcinoma and esophageal adenocarcinoma by country from 2013 to 2017.
Abbreviation: ASIR=age-standardized incidence rate; ESCC=esophageal squamous cell carcinoma; EAC=esophageal adenocarcinoma. -
Our study highlights the contrasting trajectories of ESCC and EAC incidence globally. The declining ASIRs for ESCC in many countries reflect shifts in the prevalence of underlying risk factors, including reduced tobacco and alcohol consumption and improved dietary practices. In contrast, the rising ASIRs for EAC in high-income countries, consistent with prior studies (2), are linked to increasing rates of obesity (4), gastroesophageal reflux disease (GERD), and Barrett’s esophagus, emphasizing the impact of lifestyle changes on these trends. The significant narrowing of ESCC-to-EAC ratios, coupled with pronounced sex differences, underscores the growing public health burden of EAC in high-income settings and highlights the need for tailored prevention strategies that address regional and sex-specific risk factors to reduce the global burden of esophageal cancer.
The persistent dominance of ESCC in Asia, compared to the rising burden of EAC in Western countries, reflects significant regional differences in risk factors. In Asia, high rates of tobacco smoking (5), heavy alcohol consumption, and diets rich in salted and pickled foods are major drivers of ESCC. Additionally, the interplay of Helicobacter pylori (H. pylori) infection and low body mass index (BMI) contributes to the high ESCC burden. In contrast, European and American countries have experienced a sharp rise in EAC incidence, driven by increasing obesity rates, GERD (6), and Barrett’s esophagus. The lower prevalence of H. pylori infection in Western nations, due to improved sanitation and antibiotic use, may paradoxically offer less protection against EAC.
The contrasting trends in ESCC and EAC across countries provide valuable insights into esophageal cancer epidemiology. In Japan, the rising incidence of both ESCC and EAC reflects persistent risk factor prevalence and the impact of an aging population. Conversely, the Republic of Korea demonstrates stable ESCC trends and declining EAC incidence, likely attributable to effective smoking cessation programs, public health initiatives reducing alcohol consumption, improved dietary patterns, and lower rates of obesity and GERD. National screening programs for upper gastrointestinal cancers in both countries have further influenced these trends by enabling early detection and timely interventions, particularly among high-risk populations such as smokers and heavy drinkers.
The persistent male predominance in both ESCC and EAC underscores the significant influence of sex-specific factors, including hormonal differences and lifestyle behaviors such as smoking and alcohol consumption (7–10). The pronounced male-to-female disparity in EAC, along with exceptionally high male-to-female ratios of ESCC in countries like Ukraine, Republic of Korea, Lithuania, and Belarus, warrants further investigation into underlying biological mechanisms and environmental determinants.
Our study has several limitations. Although this analysis relied on high-quality cancer registry data from CI5, it may have limitations in histological classification accuracy and population coverage. Regional data may not fully reflect national trends, especially in low- and middle-income countries. Furthermore, the lack of continuous histological data excluded several populous nations, including China, which bears the highest global burden of ESCC. This omission limits comprehensive assessment of global trends and the impact of histological transitions in esophageal cancer. Additionally, the ecological design precludes individual-level analysis of risk factors.
In conclusion, this comprehensive analysis of ESCC and EAC incidence trends highlights the shifting global burden of esophageal cancer. The findings reveal declining ESCC incidence in most countries, rising EAC incidence in high-income countries, and pronounced male predominance in both subtypes. Tailored prevention strategies that address regional and sex-specific risk factors are essential for reducing the global burden of esophageal cancer.
-
All cancer registries and their staff who have contributed data essential for this study.
-
Ethical approval is not applicable to our study.
HTML
| Citation: |

|