
 Download:


-
Introduction: Data on inter-regional transmission clusters of Hepatitis C Virus (HCV) helps optimize targeted preventive strategies. This study aims to detect the national and international dimensions of HCV 1b transmission clusters.
Methods: Available published HCV 1b non-structural protein 5B sequences sampled between 1989 and 2021 were collected, including 1,750 sequences from China and 482 comparable sequences from other countries. Network-based and tree-based approaches were introduced to detect transmission clusters and infer their relationships.
Results: Three distinct transmission cluster patterns were identified across China: a large cluster with nationwide distribution, two medium clusters predominantly in the Central and Eastern China, and 103 small clusters scattered across 19 provincial-level administrative divisions. No genetic linkages were found between Chinese sequences and those from other countries. The medium clusters exhibited a similar expansion risk compared with the large cluster [adjusted odds ratio (aOR)=1.247, 95% confidence interval (CI): 0.862, 1.804, P=0.241], but showed significantly lower inter-provincial transmission (aOR=0.255, 95% CI: 0.077, 0.798, P=0.019). The small clusters demonstrated faster expansion [adjusted hazard ratio (aHR)=1.327, 95% CI: 1.050, 1.676, P=0.018] and markedly reduced inter-provincial transmission (aOR=0.006, 95% CI: 0.002, 0.014, P<0.001) compared to the large cluster. The Northeast China groups showed significantly higher inter-provincial transmission risk compared to the Central China groups (aOR=11.461, 95% CI: 2.262, 87.014, P=0.006).
Conclusions: This study emphasizes the urgent need to establish a national molecular epidemiological surveillance network for detecting hidden transmission chains and monitoring the emergence of variants.
-
In an era of globalization and hyperconnectivity, eliminating the Hepatitis C Virus (HCV) faces challenges from continuous external introductions and emerging transmission clusters. While routine notifiable disease reporting systems struggle to detect hidden transmission patterns, phylogenetic analysis offers the potential for characterizing HCV transmission clusters in China. To investigate this approach, we analyzed 1,750 published HCV 1b non-structural protein 5B (NS5B) sequences from China (China sequences), collected between 2002 and 2019; alongside 482 comparable sequences from other countries (foreign sequences), sampled between 1989 and 2021. Using both network-based and tree-based approaches, we detected transmission clusters and inferred their relationships. Our analysis revealed three distinct types of clusters within China, each exhibiting unique expansion risks and inter-provincial transmission patterns. Notably, these clusters showed no linkages to sequences from other countries. These findings highlight HCV transmission patterns in China and provide insights for optimizing preventive strategies.
While phylogenetic analysis have been employed in multi-center and single-center studies to investigate transmission patterns, results have varied in its scope and implications. A study analyzing whole-genome HCV sequences from 8 high-income countries demonstrated ongoing HCV 1a and 4d transmission among men who have sex with men (MSM) at both local and international levels (1). HCV subtypes show geographical diversity with HCV 1b having worldwide distribution. In China, 5 dominant HCV subtypes account for 98.84% of infections: with 1b (52.18%) predominating, followed by 2a (28.69%), 3b (7.06%), 6a (6.41%), and 3a (4.62%) (2). While researchers have successfully used HCV partial genome sequences to infer local or inter-regional transmissions (3-5), detection capabilities are often constrained by limited temporal and geographic sampling ranges. Building on previous studies' strengths and limitations, we designed a comprehensive secondary analysis method integrating published sequences.
HCV NS5B sequences (AF009606 coordinates: 8,276–8,615 nt, searched on July 11, 2024) and associated epidemiological data were retrieved from the Los Alamos HCV sequence database (https://hcv.lanl.gov/) and the National Center for Biotechnology Information (https://www.ncbi.nlm.nih.gov/). Inclusion criteria required sequences to be annotated with country, provincial-level administrative division (PLAD, for sequences from China), and sampling year. For individuals with multiple sequences, only the earliest sequence was retained. Sequences that were synthetic, contaminated, or contained high non-ACTG content were excluded. China sequences were aligned with reference sequences of representative subtypes 1a–6k. HCV 1b subtype sequences were identified through approximate maximum likelihood phylogenetic (ML) tree analysis using IQ-TREE (version 1.6.12, IQ-TREE Development team, Canberra, ACT, Australia)(6). The analysis set was constructed by dividing China HCV 1b sequences and foreign sequences into query and search sets, respectively, then extracting the five most similar target sequences for each query sequence using the Basic Local Alignment Search Tool (version 2.15.0, National Center for Biotechnology Information, National Library of Medicine, National Institutes of Health, Bethesda, USA). The sequence screening process is detailed in
Supplementary Figure S1 .Transmission cluster analysis employed network-based and tree-based approaches to detect clusters and infer relationships between major clusters, respectively. For the network-based approach, Tamura-Nei 93 pairwise nucleotide genetic distances (GD) were calculated to construct a molecular network using MicrobeTrace (version 0.9.0, Centers for Disease Control and Prevention, Atlanta, Georgia, USA). A sensitivity analysis, using GD thresholds from 0.0001–0.0300 substitutions/site, was conducted to determine the optimal threshold (
Supplementary Table S1 ). The GD threshold of 0.001 substitutions/site was selected based on the optimal balance between maximum cluster numbers and the ratio of nodes in the largest to second-largest clusters (7). For the tree-based approach, sequences from major clusters in the molecular network were analyzed using ML tree inference with a significant bootstrap support of ≥84% (1,000 repetitions) (8). Transmission characteristics were compared among clusters by calculating adjusted hazard ratios (aHR) and 95% confidence interval (CI) for expansion risk, which were assessed through linked pairs from the older sequences to their first linkages. Adjusted odds ratios (aOR) and 95% CI were calculated to evaluate inter-provincial transmission risk by analyzing linked pairs from different PLADs.A total of 2,232 HCV 1b NS5B sequences (1,750 China sequences and 482 foreign sequences) sampled between 1989 and 2021 were analyzed, with 20.3% forming clusters in the molecular network (
Supplementary Table S2 ). The sequences were distributed across large (≥50 nodes; 127 sequences), medium (10–49 nodes; 42 sequences), and small clusters (<10 nodes; 284 sequences). The molecular network comprised 126 distinct clusters ranging from 2 to 127 nodes (Supplementary Figure S2 ).The China sequences formed 106 clusters, consisting of one large cluster, two medium clusters, and 103 small clusters (Figure 1). The sampling periods for these three cluster types spanned 2002–2014, 2002–2013, and 1992–2017, respectively. All three cluster types shared a median sampling year of 2009 (interquartile range: 2009–2010, Kruskal-Wallis chi-squared=3.589, P=0.166). The large cluster encompassed sequences from the central China (38 sequences), eastern China (67 sequences), northeastern China (5 sequences), and western China (17 sequences). The two medium clusters contained sequences primarily from the central China (13 sequences) and eastern China (28 sequences), with 1 sequence from the western China. The 103 small clusters included sequences from the central China (38 sequences), eastern China (147 sequences), northeastern China (8 sequences), and western China (39 sequences). While foreign sequences from 10 countries formed 20 distinct clusters, none of which clustered with sequences from China.
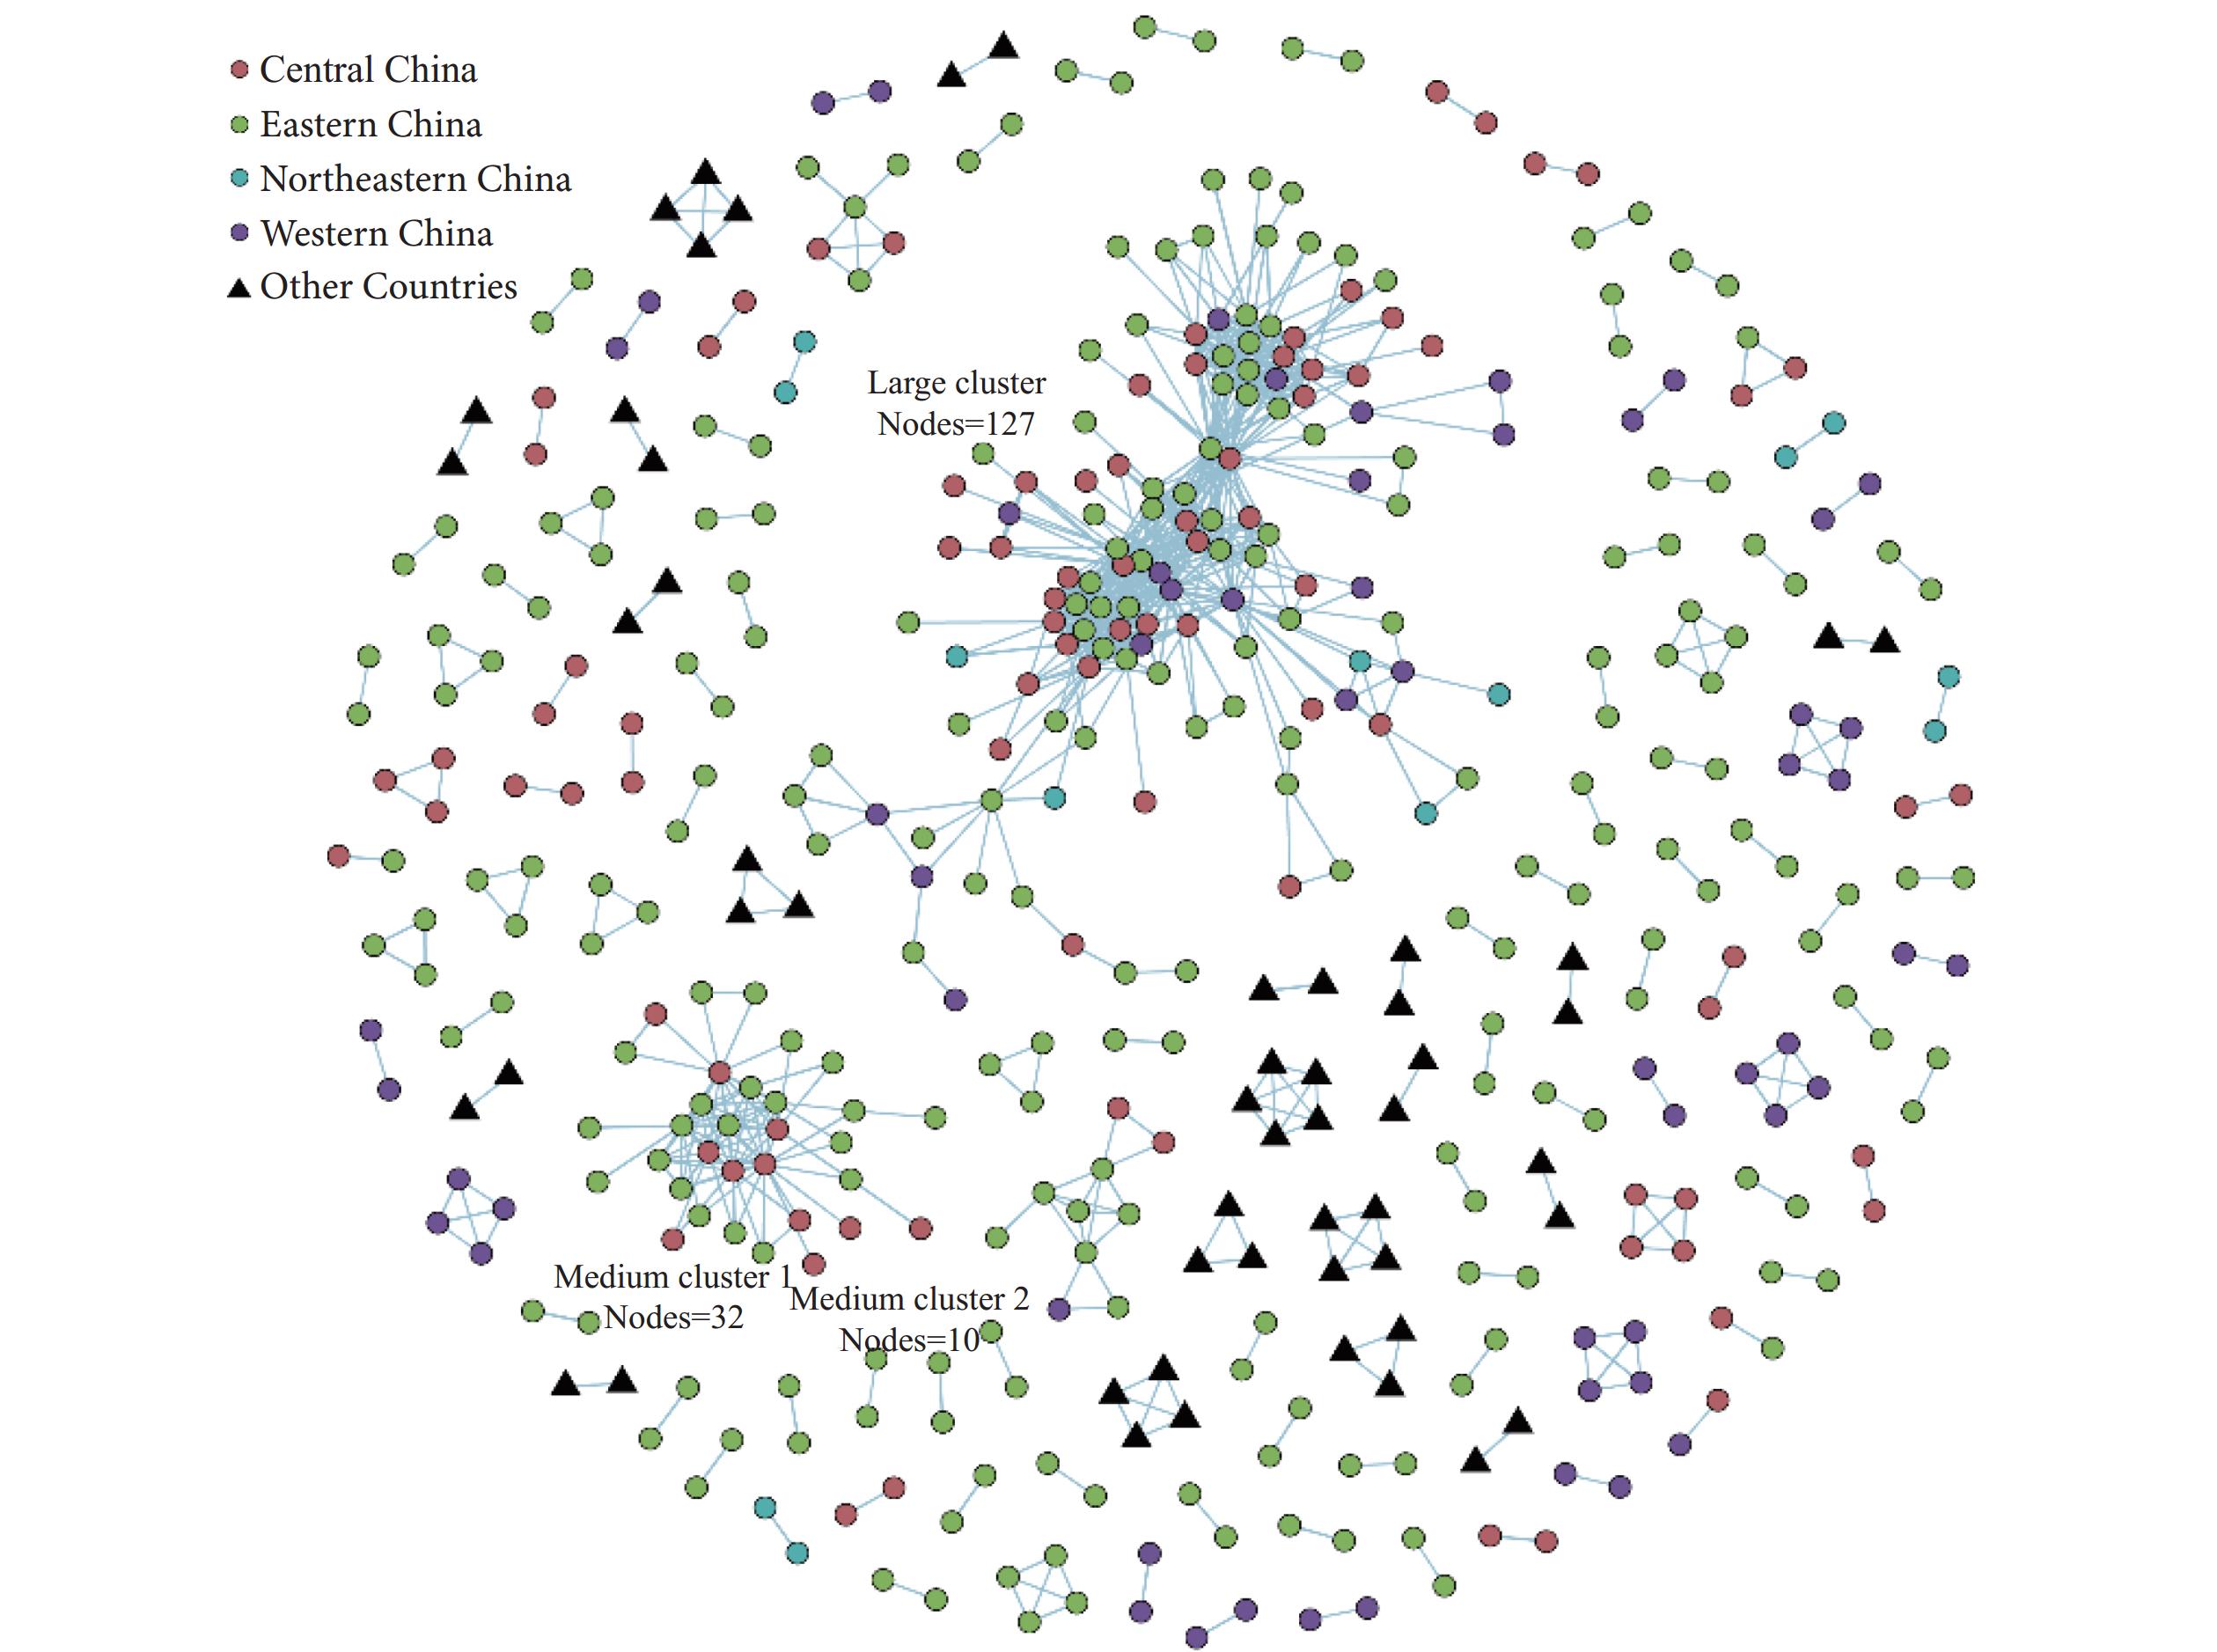 Figure 1.
Clusters in the Hepatitis C Virus 1b molecular network, China, 1989–2021.
Note: China sequences clustered in the molecular network are distributed across 26 PLADs. Central China: Anhui, Henan, Hubei, Hunan, and Jiangxi PLADs; eastern China: Beijing, Fujian, Guangdong, Hainan, Hebei, Hong Kong, Jiangsu, Shandong, Shanghai, and Zhejiang PLADs; northeastern China: Heilongjiang, Jilin, and Liaoning PLADs; western China: Gansu, Guangxi, Ningxia, Qinghai, Sichuan, Xinjiang, and Yunnan PLADs.
Abbreviation: PLADs=provincial-level administrative divisions.
The maximum likelihood (ML) tree analysis revealed two distinct phylogenetic groups (bootstrap support=1.000). Group A comprised 127 sequences from the large cluster, representing samples from the central, eastern, northeastern, and western China. Group B contained 42 sequences from the two medium clusters, with samples originating from the Central, Eastern, and Western China. The sequences within the two medium clusters demonstrated high genetic homology (bootstrap support=0.852), suggesting that they likely diverged from similar geographical origins (Figure 2).
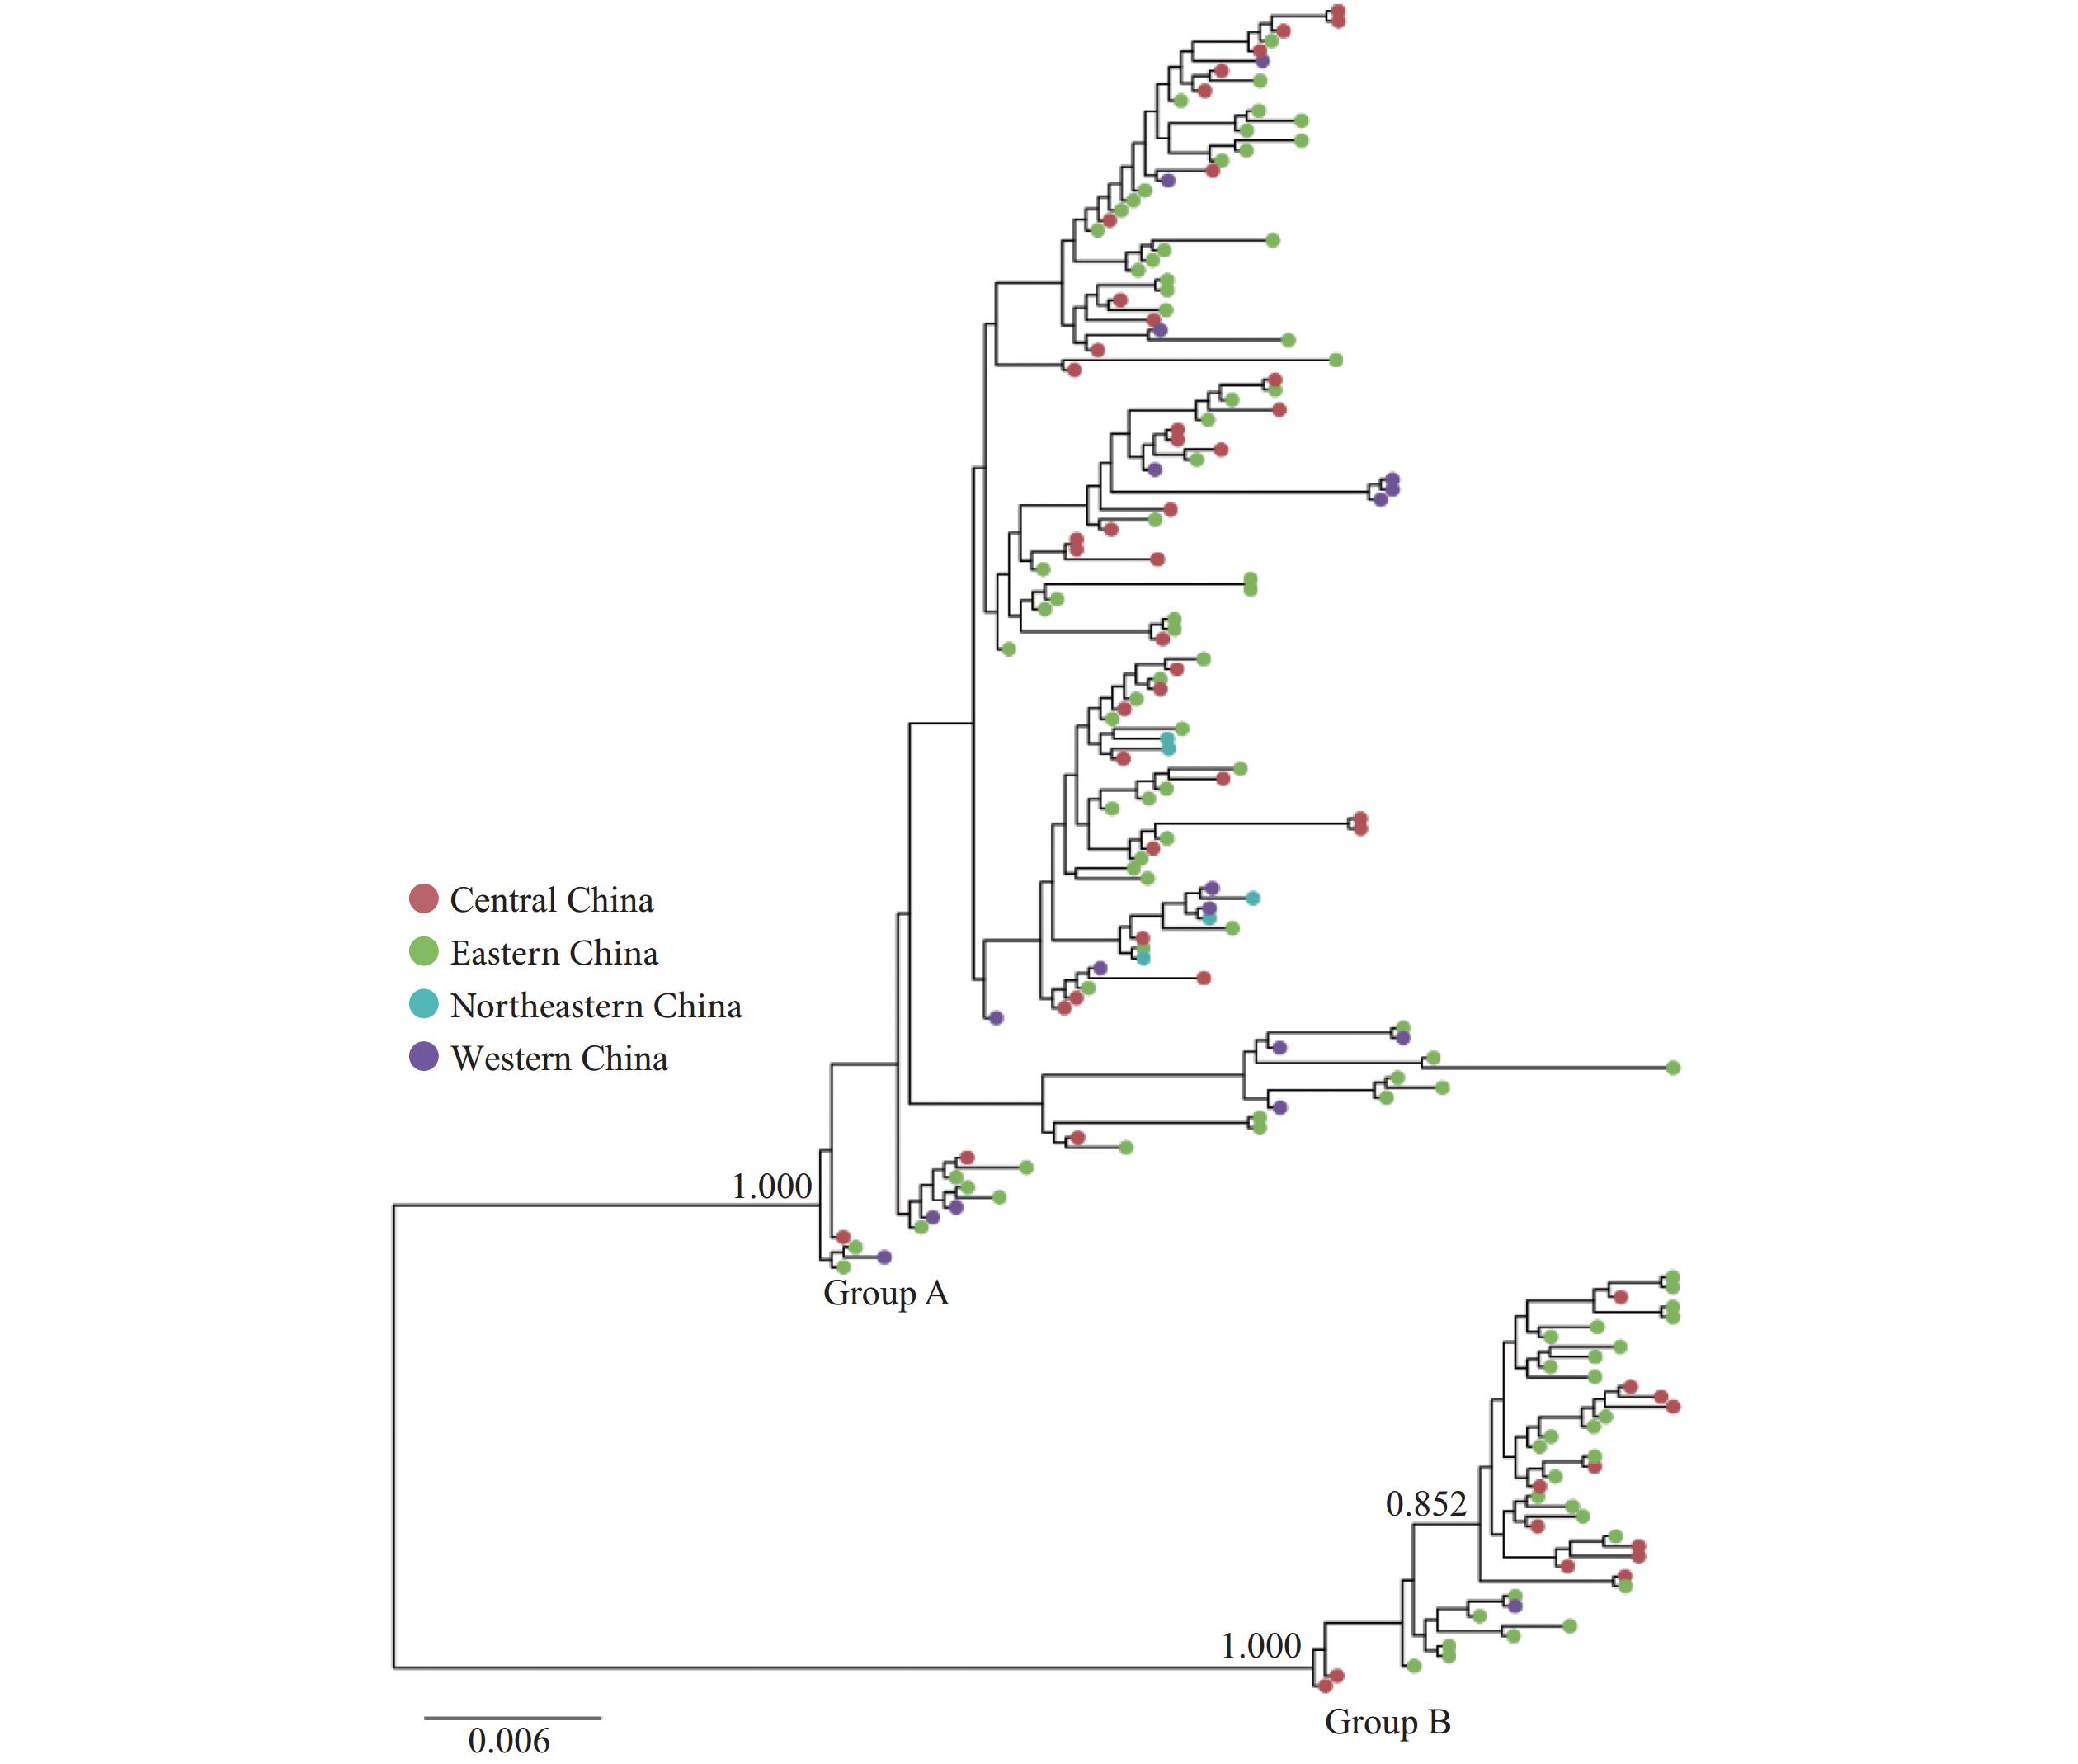 Figure 2.
The approximate maximum likelihood phylogenetic tree with sequences presented in the large and medium clusters in the Hepatitis C Virus 1b molecular network, China, 1989–2021.
Note: China sequences in the approximate maximum likelihood phylogenetic tree were distributed in 25 PLADs. Central China: Anhui, Henan, Hubei, Hunan, Jiangxi, and Shanxi PLADs; eastern China: Beijing, Fujian, Guangdong, Hainan, Hebei, Hong Kong, Jiangsu, Shandong, Shanghai, and Zhejiang PLADs; northeastern China: Heilongjiang and Liaoning PLADs; western China: Gansu, Guangxi, Ningxia, Qinghai, Sichuan, Xinjiang, and Yunnan PLADs.
Abbreviation: PLAD=provincial-level administrative division.
The medium clusters exhibited a similar expansion risk compared with the large cluster (aHR=1.247, 95% CI: 0.862, 1.804, P=0.241), but showed significantly lower inter-provincial transmission (aOR=0.255, 95% CI: 0.077, 0.798, P=0.019). The small clusters demonstrated faster expansion (aHR=1.327, 95% CI: 1.050, 1.676, P=0.018) and markedly reduced inter-provincial transmission (aOR=0.006, 95% CI: 0.002, 0.014, P<0.001) compared to the large cluster. The Northeast China groups showed significantly higher inter-provincial transmission risk compared to the Central China groups (aOR=11.461, 95% CI: 2.262, 87.014, P=0.006) (Table 1).
Characteristics Expansion risk Risk of inter-provincial transmission aHR (95% CI) P aOR (95% CI) P Type of cluster Large 1 1 Medium 1.247 (0.862, 1.804) 0.241 0.255 (0.077, 0.798) 0.019 Small 1.327 (1.050, 1.676) 0.018 0.006 (0.002, 0.014) <0.001 Region Central China 1 1 Eastern China 0.929 (0.711, 1.214) 0.589 0.32 (0.135, 0.745) 0.009 Northeastern China 0.727 (0.384, 1.374) 0.326 11.461 (2.262, 87.014) 0.006 Western China 1.022 (0.716, 1.460) 0.904 1.703 (0.631, 4.641) 0.293 Note: Adjusted by sampling year. Clusters are classified into three categories: large (≥50 nodes), medium (10–49 nodes), and small (<10 nodes). Sequences clustered in the molecular network were distributed in 26 PLADs. Central China: Anhui, Henan, Hubei, Hunan, and Jiangxi PLADs; eastern China: Beijing, Fujian, Guangdong, Hainan, Hebei, Hong Kong, Jiangsu, Shandong, Shanghai, and Zhejiang PLADs; northeastern China: Heilongjiang, Jilin, and Liaoning PLADs; western China: Gansu, Guangxi, Ningxia, Qinghai, Sichuan, Xinjiang, and Yunnan PLADs.
Abbreviation: aOR=adjusted odds ratios; aHR=adjusted hazard ratios; CI=confidence interval.Table 1. The expansion risk and risk of inter-provincial transmission among clusters in the Hepatitis C Virus 1b molecular network, China, 1989–2021.
-
This study integrated globally published sequences with China sequences to characterize the national and international dimensions of HCV 1b transmission clusters in China. The analysis revealed three distinct cluster types with unique transmission characteristics. The sequences from China showed no linkages with foreign sequences, providing valuable insights for developing targeted HCV preventive strategies.
A previous investigation analyzing HCV NS5B sequences to infer molecular networks in China employed a genetic distance threshold of 0.01 substitutions/site, reporting a clustering proportion of 33.1% (5). Our study utilized a more stringent threshold which resulted in a lower sensitivity for cluster detection. Based on established estimates, HCV 1b NS5B sequences evolve at approximately 0.0005 substitutions/site/year (9). Therefore, our chosen threshold of 0.001 substitutions/site will likely capture transmission relationships within two years, offering enhanced specificity for identifying key transmission chains.
Another previous research has documented two HCV 1b groups that underwent exponential expansion during the 1970s to 1990s (8,10). Our analysis incorporates newly sampled sequences, which confirmed the widely persistence distribution of the group throughout China. However, the group’s previous dominance in the Central and Eastern China have now diverged into two distinct clusters based on genetic distance thresholds. These findings not only suggest the continued presence of major transmission chains, but also the potential emergence of new HCV 1b variants in the Central and Eastern China.
Despite similar temporal distributions across cluster sizes, the transmission characteristics varied significantly among large, medium, and small clusters. The small clusters exhibited faster transmission rates and reduced inter-provincial spread compared to the large cluster. Given our molecular network’s two-year transmission relationship threshold, these small clusters likely represented localized outbreaks. Furthermore, the Northeastern China demonstrated higher inter-provincial transmission probability compared to the Central China, which could be attributed to two factors. Firstly, while HCV 2a predominates in the Northeastern China (2), the direct genetic linkages of numerous HCV 1b sequences from this region to the other parts of China suggests external introductions. Secondly, the relatively sparse sampling from the Northeastern China compared to the Central China may create a sampling bias, potentially overestimating the direct genetic linkages when intermediate sequences are missing.
This study has several limitations. First, the published sequences represent a small fraction of HCV cases in China, introducing inevitable sampling biases. However, our optimized genetic distance threshold helps mitigate potential biases in the key transmission cluster inference. Second, achieving balanced temporal and regional sample distribution proved challenging. To address this, we implemented multiple analytical approaches to assess transmission characteristics while controlling for potential confounding factors.
In conclusion, this study successfully identified and characterized HCV 1b transmission clusters within China. Our findings emphasize the urgent need to establish a national molecular epidemiological surveillance network for detecting hidden transmission chains and monitoring the emergence of variants.
-
The Core Competence Training Program of Epidemiology and Health Statistics, Chinese Center for Disease Control and Prevention.
-
Supported by the National Natural Science Foundation of China (12071366) and the project of the Disease Control and Prevention Administration of Guangxi Zhuang Autonomous Region (GXJKKJ24C002).
HTML
| Citation: |

|