
 Download:


-
Syndrome surveillance is crucial for the rapid detection and alerting of infectious disease outbreaks. Nonetheless, it often encounters challenges including uneven distribution of monitoring sites, irregular reporting schedules, and incomplete data (1). These factors hinder the ability to accurately delineate disease distribution temporally and spatially, and to discern patterns and anomalies. Traditional spatio-temporal interpolation methods (2) are ill-suited for addressing the volatility and gaps in disease data, particularly when integrating significant influencing factors. Conversely, the structural equation model (SEM) facilitates analysis of complex data interactions to unearth underlying relationships among variables (3), thus enabling more precise interpolation. We suggest employing a SHapley Additive explanation (SHAP)-based SEM for the spatiotemporal interpolation of unstable and incomplete data.
HTML
-
The SHAP model is utilized to evaluate multiple variables and their correlations with observed variables (4). It quantifies the marginal contribution of each variable to the model output, thereby demonstrating its influence on the overall model. This study aims to explore the relationship between meteorological variables and the virus positivity rate to identify the most impactful combination of these factors. Subsequently, the SEM is applied to discern the connections between the factors and observed variables (3), facilitating spatio-temporal interpolation. The SEM illustrates the network of relationships between meteorological variables and the virus, satisfying interpolation requirements based on the model fit. For further information on the SHAP-SEM model and additional classical interpolation methods, readers are referred to the
Supplementary Material . -
In this study, the root mean square error (RMSE), correlation coefficient (r), and F-score were utilized to assess the accuracy of the SAHP-SEM and other comparative models.
RMSE measures the average difference between values predicted by a model and the actual values. It provides an estimation of how well the model can predict the target value (5).
The r quantifies the extent and direction of a linear relationship between two variables. Our research explores various methodologies, identifying that while Kriging interpolation displays a high determination coefficient, it unfortunately correlates poorly with the original dataset. This misalignment highlights its inability to accurately represent the underlying data trends. Consequently, due to the need for a precise reflection of these trends, we have chosen the r as our preferred metric.
The F-score is a composite metric that favors algorithms with higher sensitivity while penalizing those with higher specificity. It is derived from the precision and recall of the test. Here, precision refers to the number of true positive results divided by the total count of samples predicted as positive, inclusive of false positives. Recall, alternatively, is the number of true positives divided by the total number of samples that are correctly identified as positive (6). The F-score is formulated as follows (Equations 1–3):
$$ Precision=\dfrac{TP}{TP+FP} $$ (1) $$ Recall=\frac{TP}{TP+FN} $$ (2) $$ F-score\text=\frac{2\times Precision\times Recall}{Precision+Recall} $$ (3) TP, FP, and FN denote true positives, false positives, and false negatives, respectively, across different classes. Precision quantifies the accuracy across various classes, recall indicates the detection rate, and the F-score provides a balanced measure of precision and recall.
-
This study utilizes two primary data types: symptom data and meteorological data. Symptom data was derived from the China CDC’s febrile respiratory syndrome surveillance, encompassing patient demographic profiles, clinical characteristics, and laboratory results obtained from 330 hospitals nationwide (
Supplementary Figure S1 ). Meteorological data were sourced from the Meteorological Station Sharing Service System (https://data.cma.cn/). Selected meteorological parameters included atmospheric pressure, average relative humidity, mean temperature, maximum and minimum temperatures, and the range between the highest and lowest temperatures. Details on the variable utilization within the model are described in the Supplementary Material. For analysis, the SHAP-SEM model was applied to the China respiratory syndrome monitoring database to assess its effectiveness in disease interpolation. The period of study spanned from January 1, 2009 to January 4, 2020, with quarters serving as the smallest time unit. The study’s scope of respiratory syndrome detection included various viruses: influenza virus (IFV), human respiratory syncytial virus (HRSV), human parainfluenza virus (HPIV), human adenovirus (HADV), human metapneumovirus (HMPV), and human coronavirus (HCOV).All analyses were conducted using R software (version 4.1.2; R Foundation for Statistical Computing, Vienna, Austria). The “shapr” package facilitated the implementation of the SHAP process, and the “lavvn” package was utilized to construct the SEM model.
Shapley Additive ExPlanation Model with The Structural Equation Model(SHAP-SEM)
Model Assessment


Empirical Study
-
Supplementary Figure S2A illustrates the seasonal distribution of six viruses across various regions. In major Chinese urban areas, the average absence rate of respiratory syndrome is 32.49%. Notably, the Central and Southern Liaoning and the Beibu Gulf urban agglomerations exhibit the highest absence rates, reaching 69.22%. In contrast, the Beijing-Tianjin-Hebei, Yangtze River Delta, and Pearl River Delta urban agglomerations show the lowest rates, all below 30%. To develop training and validation sets for our model, we randomly sampled various proportions of complete data. The model’s accuracy is assessed using RMSE, r, and F-score metrics. Each virus demonstrates a distinct peak during the spring and winter festivals. IFV, HRSV, and HPIV are the predominant viruses among the general population. Geographically, IFV and HPIV are more prevalent in the north, whereas IFV and HRSV are more common in the south, as depicted inSupplementary Figure S2B . This regional variation persists, with HADV being more prevalent in the north. After data interpolation, the results shown in Figure 1 confirm consistent proportions of the three primary viruses within the population. The north exhibits a higher prevalence of adenovirus as the primary virus, whereas the south displays a higher incidence of co-infections involving the IFV and syncytial virus.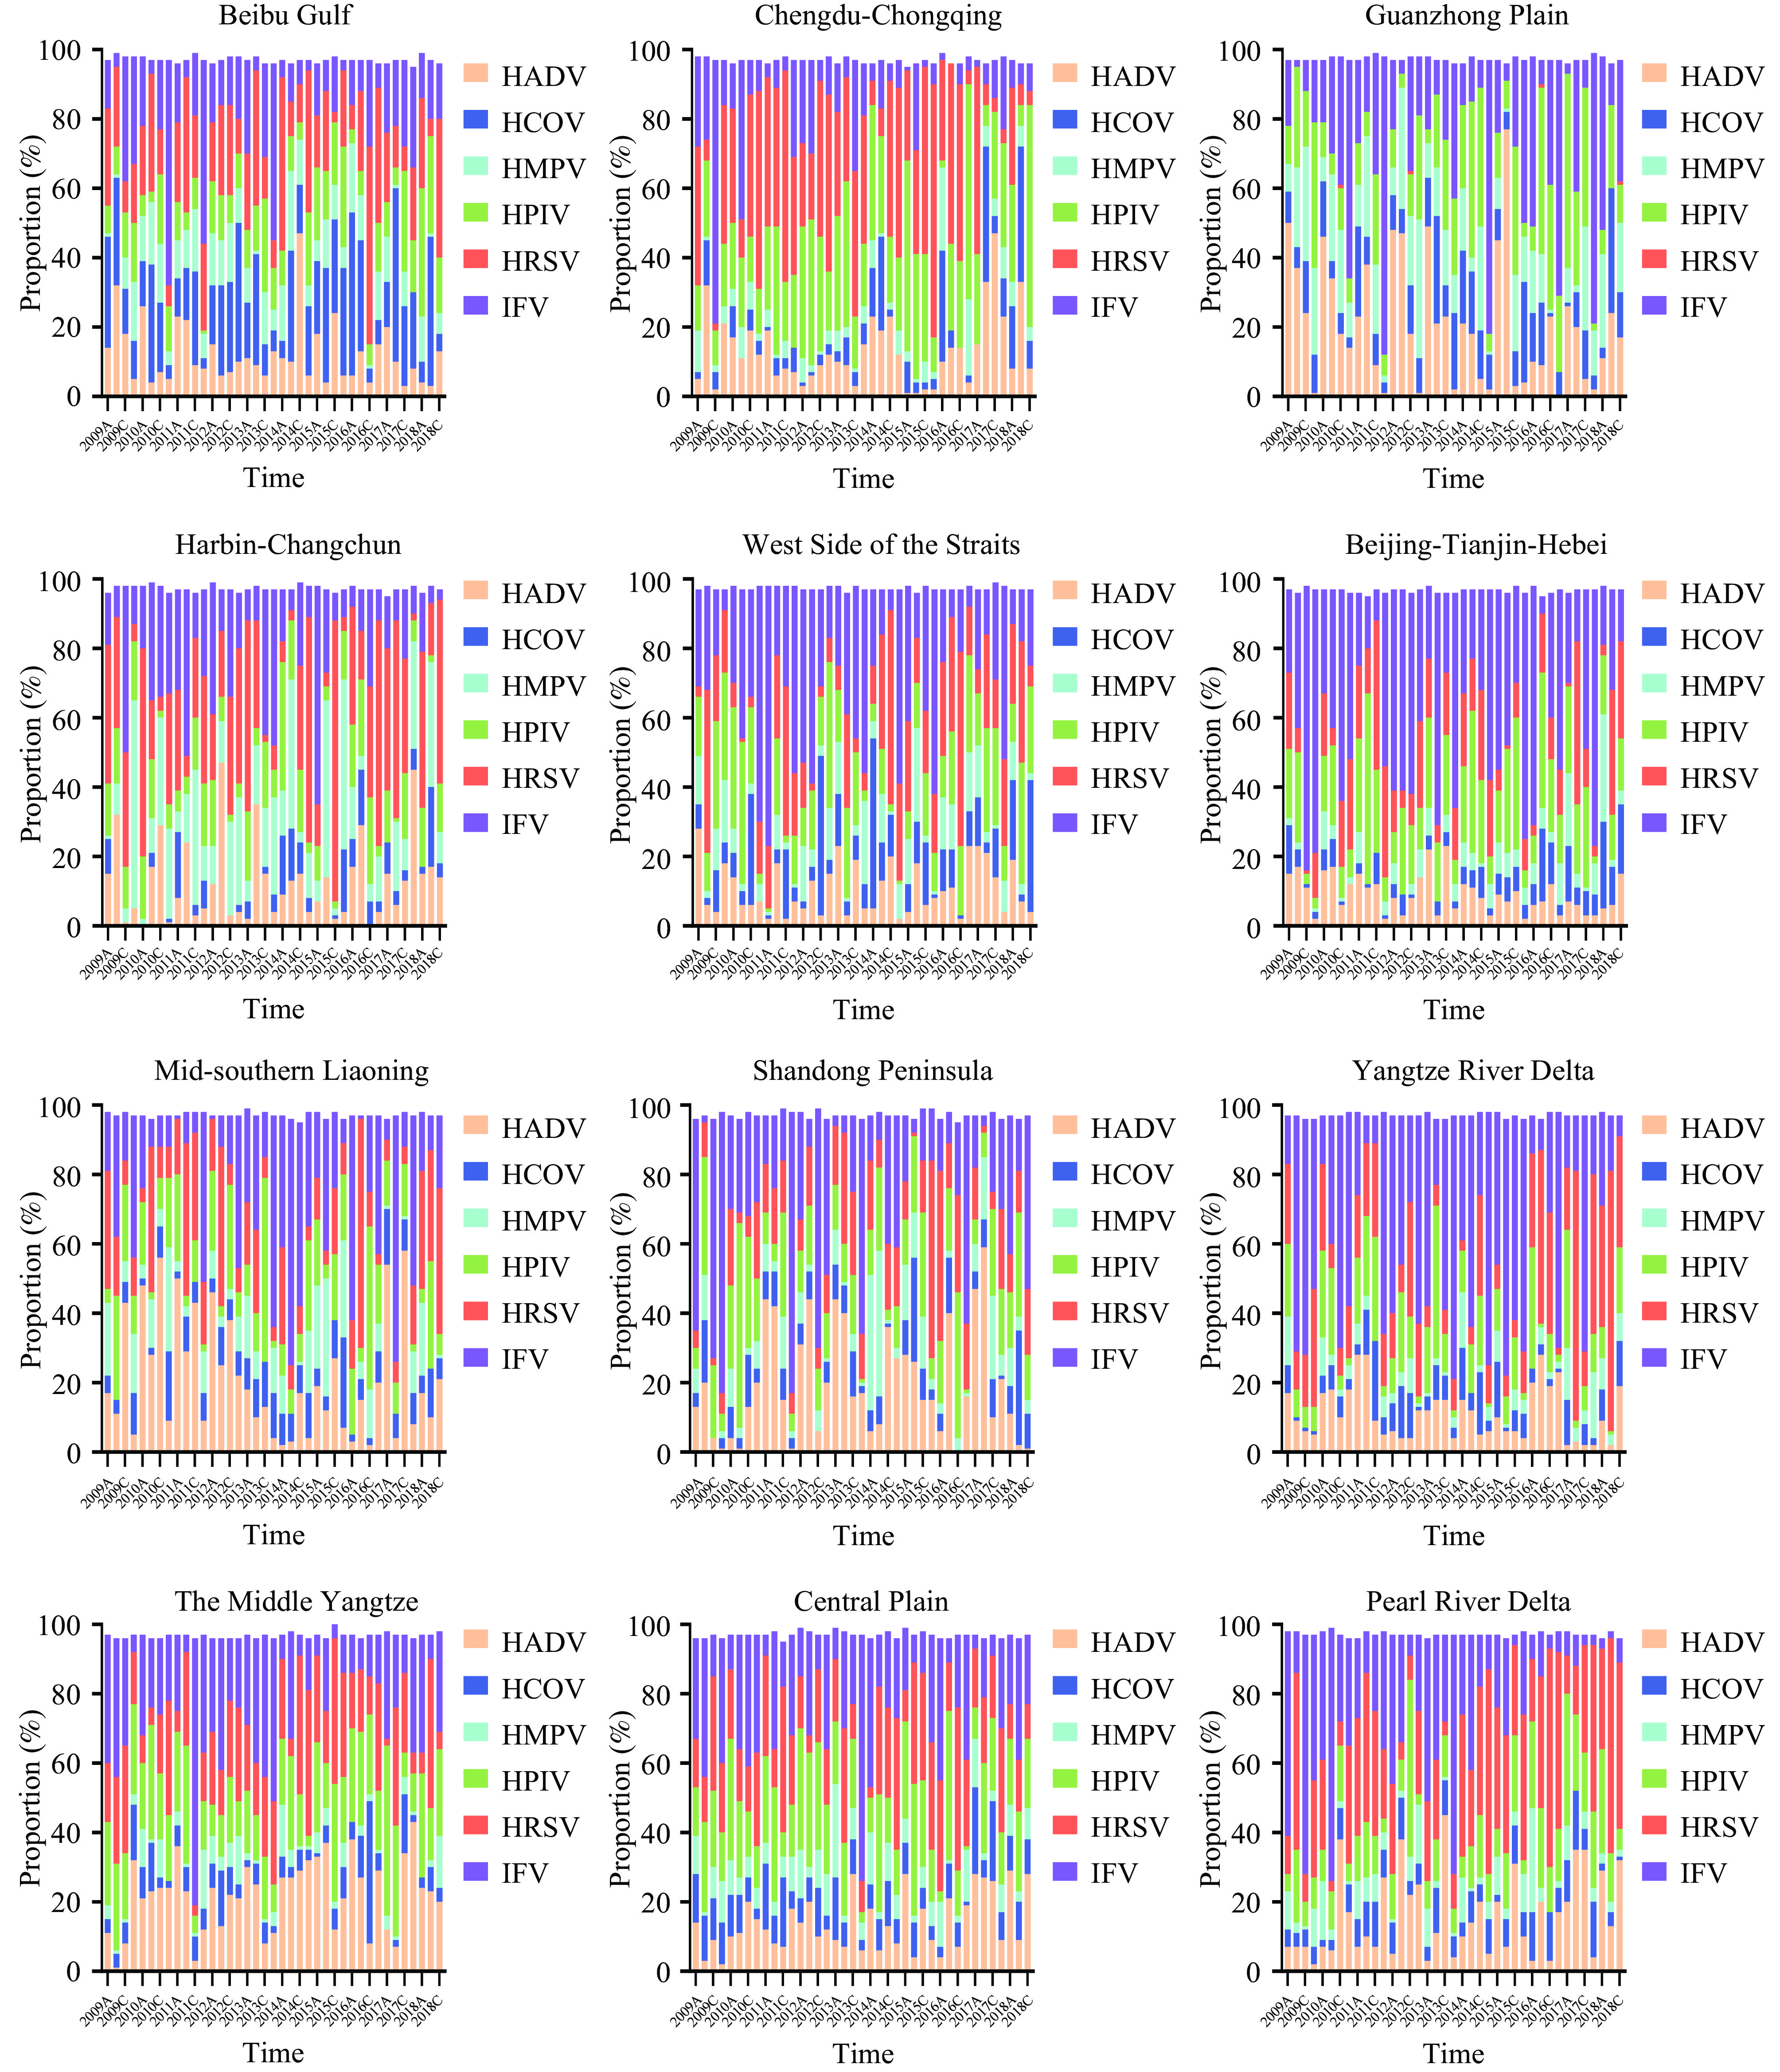 Figure 1.
The virus structure spectrum of different urban agglomerations after interpolation.
Note: The letters “A” and “C” in the abscissa represent springand autumn quarters, respectively.
Abbreviation: HADV=human adenovirus; HCOV=human coronavirus; HMPV=human metapneumovirus; HPIV=human parainfluenza virus; HRSV=human syncytial virus; IFV=influenza virus.
The interpolation analysis delineates two distinct patterns in the dissemination of respiratory syndrome cases across China from 2009 to 2020.
Supplementary Figure S2 categorizes Chinese urban agglomerations into three regions: the northern area, which includes the Central Plains; the central region, extending up to the middle reaches of the Yangtze River; and the combined southern and western areas, located beyond the middle reaches of the Yangtze River. In the first grouping, IFV predominated, followed by the parainfluenza virus, with adenoviruses appearing intermittently. The second group also had a predominance of IFV, with the syncytial virus as the second most prevalent, and adenoviruses appearing later in the sequence. In the third group, the syncytial virus was the most dominant, followed by the parainfluenza virus, with adenoviruses emerging in the first six months of the year. These findings have been validated in previous studies (7–9).Table 1 presents the mean values of three evaluation metrics across 100 experimental replicates. The data demonstrates superior performance of the SEM integrated with the SHAP algorithm over traditional methods, notably in comparison to the conventional SEM, across all assessed metrics. This indicates enhanced and more consistent interpolation accuracy with the SHAP-SEM approach. Additionally, enlarging the training set size contributes to improved interpolation precision. Compared to the conventional SEM, the SHAP-SEM model excels in spatial distribution accuracy and primary virus classification accuracy. Overall, the SHAP-SEM model achieves robust performance across all indices. Kriging shows the lowest RMSE, but exhibits a decreased r value, whereas the Bayesian approach maintains a relatively high F-score.
Methods RMSE r F-score Setting 1: Training=60% SHAP-SEM 5.813 0.710*** 0.752 SEM 9.424 0.614** 0.651 Cokriging 8.273 0.429 0.634 Bayesian 10.174 0.494** 0.693 Sandwich 7.235 0.539*** 0.621 Setting 2: Training=70% SHAP-SEM 5.157 0.734*** 0.781 SEM 9.364 0.633** 0.684 Cokriging 8.047 0.457 0.634 Bayesian 9.154 0.518** 0.691 Sandwich 7.176 0.584*** 0.633 Setting 3: Training=80% SHAP-SEM 5.081 0.767*** 0.792 SEM 9.331 0.657* 0.708 Cokriging 7.524 0.461** 0.642 Bayesian 8.699 0.523** 0.701 Sandwich 6.926 0.601*** 0.651 Abbreviation: RMSE=root-mean-square error; SHAP-SEM=SHapley Additive exPlanation model with the structural equation model; SEM=structural equation model.
* P<0.05;
** P<0.01;
*** P<0.001.Table 1. The average values of the three evaluation indicators under 100 repeated experiments for 5 models in each setting.
Table 2 presents the mean values of evaluation metrics across various simulation settings for different quarters. The findings reveal that accuracy peaks during the winter and dips to its lowest in the autumn. The SHAP-SEM model exhibits superior performance in the winter, markedly enhancing accuracy relative to competing models. Conversely, in the autumn, the sandwich interpolation method surpasses the SHAP-SEM model in terms of accuracy enhancement.
Quarters Method RMSE r F-score SHAP-SEM 4.214 0.781*** 0.811 SEM 5.019 0.722** 0.736 Spring Cokriging 5.105 0.581* 0.662 Bayesian 6.428 0.614** 0.705 Sandwich 6.832 0.637** 0.651 SHAP-SEM 6.194 0.703** 0.710 SEM 10.521 0.641** 0.682 Summer Cokriging 7.113 0.519 0.627 Bayesian 9.245 0.588* 0.690 Sandwich 8.194 0.572* 0.638 SHAP-SEM 7.237 0.651** 0.631 SEM 9.144 0.601* 0.614 Autumn Cokriging 6.184 0.467 0.596 Bayesian 7.965 0.501 0.587 Sandwich 8.229 0.523* 0.577 SHAP-SEM 4.057 0.722*** 0.753 SEM 6.124 0.671*** 0.707 Winter Cokriging 5.016 0.514* 0.636 Bayesian 7.255 0.635** 0.641 Sandwich 5.417 0.642** 0.639 Abbreviation: MSE=mean-square error; RMSE=root-mean-square error; SHAP-SEM=SHapley Additive exPlanation model with the structural equation model; SEM=Structural equation model.
* P<0.05;
** P<0.01;
*** P<0.001.Table 2. Average values of the three evaluation indicators in different seasons under 100 repeated experiments for 5 models in each setting.
-
Missing data frequently complicates syndromic surveillance, obstructing the analysis of disease patterns and trends, thereby impeding efforts in disease prevention and control. Developing methods for data interpolation in environments characterized by unstable monitoring and significant data gaps presents a formidable research challenge. Conventional interpolation techniques are often inadequate in contexts involving complex interactions between diseases and their determinants. These methods generally underperform in addressing missing values within sparse datasets.
This study employed interpolation techniques to estimate the prevalence of primary viruses associated with seasonal respiratory syndrome across 13 major urban areas in China between 2010 and 2018, accounting for sparse data and missing values. The accuracy of these estimates was assessed using RMSE, r, and F-score. The results indicate that this method surpasses other approaches in enhancing the accuracy of data on primary respiratory syndrome viruses, achieving significant improvements in overall and seasonal accuracy.
Most spatiotemporal interpolation models for diseases incorporate both spatiotemporal autocorrelation and differentiation. The Co-kriging method (10) is a geostatistical technique leveraging correlations between various variables across different sites for spatial interpolation and prediction. However, employing Co-kriging to estimate missing data introduces increased uncertainty because these estimations depend heavily on the availability of complete datasets and on the spatial correlation among variables. A lack of data in a dataset can undermine spatial autocorrelation, rendering predictions unreliable. Bayesian hierarchical models (11) attempt to manage missing data under the assumption of random data loss. If the missing data mechanism is misrepresented within the model, however, parameter estimations might be biased. Conventionally, it is assumed that data loss is random; however, overlooking the specific missing data mechanism can lead to biases in the estimated parameters due to improper data handling. The sandwich approach (12) further complicates the issue by treating missing and observed data as independent, disregarding any patterns or correlations in the data removal process. This can result in incorrect standard errors and inferences, particularly when the data deletion mechanisms are informative or directly linked to the variables of interest. Additionally, the complex dynamics of disease occurrence, infection, and transmission intersect variably with different factors. To enhance spatiotemporal interpolation accuracy, advanced techniques like deep learning, including random forest models (13) and regressive neural networks (14), have been utilized. Despite their effectiveness, these models are often complex and do not sufficiently address the multifaceted nature of disease prevention. This study proposes the integration of SEM with SHAP to discern crucial features and their interrelationships, thus tackling issues related to unstable and fragmented data in health monitoring. By resolving these issues and synthesizing them within our research, we can derive precise insights about syndromes, affected regions, and causal factors. This approach promises to yield scientifically based recommendations for efficacious local prevention and control strategies.
However, this study is subject to some limitations. The SHAP-SEM model necessitates a large sample size, which may not always be feasible with incomplete syndrome surveillance data. Additionally, it is crucial to recognize that viral activity is influenced by a range of risk factors. Future endeavors to integrate incomplete syndrome monitoring data with the SHAP-SEM model should include more factors. It is also important to note that the scalability of SHAP-SEM models may be compromised when handling large datasets. As the size of the dataset expands, the computational and memory demands escalate, potentially leading to extended processing times and heightened complexity.
In further studies, comprehensive descriptions and analyses of the syndrome’s spatial and temporal distribution can be achieved through interpolation methods. Additionally, examining variations in viral activity and seasonal trends across different regions is possible. Building on this knowledge, identifying specific risk groups and areas becomes feasible, providing essential data to support targeted, time-sensitive, and location-specific prevention and control strategies.
-
No conflicts of interest.
| Citation: |

|