
 Download:


-
The surveillance of causes of death in populations is vital for public health decision-making (1). A crucial aspect of this surveillance is accurately completing death certificates. Challenges such as inadequate medical knowledge, unfamiliarity with cause-of-death inference rules, and limited practical experience can result in inconsistent quality of cause-of-death registration. Quality assessments have revealed that the accuracy of manually deduced underlying causes of death varies from 55% to 84% (2-3).
In recent years, there has been a focus on utilizing artificial intelligence (AI) techniques to automatically identify the primary causes of death. Despite deep neural network models achieving 97.8% accuracy in this task (4), their practical applications are restricted by performance limitations. This study employs the Wide and Deep framework to enhance the accuracy and stability of deep learning models, aiming to better predict the underlying causes of death and improve cause of death surveillance.
-
The data set utilized in our analysis comprises mortality records collected through nation-wide cause-of-death surveillance systems in Fujian Province, spanning from 2016 to 2022 (
Supplementary Table S1 ). We employed the International Statistical Classification of Diseases and Related Health Problems, 10th Revision (ICD-10), to systematically categorize the causes of death into 25 broad classifications, while preserving the specificity of 4-digit codes. Any records with inconsistencies such as inaccuracies within the cause-of-death sequence, incorrect deduction of the primary cause of death, ICD-10 coding mistakes as identified by specialists at the Fujian Provincial CDC, or missing information regarding the deceased’s sex and age, were omitted from our study. Upon the elimination of redundant entries via cross-referencing identity numbers, names, and dates of demise, the final cohort entailed 403,547 individual death records. Identifying particulars were redacted, with the preservation of birth and death dates, sex, the complete ICD-10 codes for the causes of death, and the duration between disease onset and mortality. Analyses focused on the primary cause of death codes.Age was divided into four groups: ≤14 years, 15–44 years, 45–64 years, and ≥65 years. Label encoding was applied to classify all ICD-10 codes, age groups, and genders into integer classes. The durations between illnesses were determined, with any missing durations recorded as null; the collected data was normalized using z-score normalization.
In light of considerable variation in the prevalence of different primary causes of death (
Supplementary Table S2 ), we utilized a subsampling strategy for the over-represented categories C and I, whereby 40,000 cases were chosen at random. Conversely, categories with fewer instances underwent up sampling. We constructed a multi-directed graph using the cause-of-death sequences extracted from our data. This graph featured causes as nodes and incorporated both their sequential relationships and the temporal intervals between successive diseases as edge attributes. From each category, random samples of primary causes of death, along with other associated causes within their sequence, were selected. We used the graph to reconstruct cause-of-death sequences with lengths varying from one to four causes. To ensure uniformity across all categories classified by ICD-10 codes, we adjusted the sample size to 40,000 cases per category through oversampling, creating a research dataset comprising one million cases. We allocated 10% of the original dataset for each category to create a test set, ensuring that the number of samples from each category did not surpass 4,000 (Supplementary Table S2 ). The data remainder, after the test set extraction, served for model training and validation, applying a 5-fold cross-validation technique (Supplementary Figure S1 ). Notably, statistical analysis revealed significant disparities in both gender and age profiles between the test set and the training dataset (Supplementary Table S3 ).The Wide and Deep model integrates a linear component, Wide, for memorization, and a neural network, Deep, for generalization. It incorporates a Convolutional Neural Networks (CNN) into the deep component to detect complex patterns in structured data while maintaining essential rule-based patterns. This model aims to accurately predict causes of death by balancing linear and non-linear interactions of features (Figure 1). It is well-suited for tasks with categorical and continuous data and has shown efficacy in recommendation systems (5).
 Figure 1.
Schematic diagram of the Wide and Deep model structure.
Abbreviation: ICD=International Classification of Diseases; CNN=Convolutional Neural Networks.The research compared the performance of various models including XGBoost, CNN, Gated Recurrent Unit (GRU), Transformer, and GRU with an attention mechanism (Attention GRU) for the task of inferring the underlying cause of death. Python 3.11.5 and PyTorch 2.1.0 were used for analysis. The evaluation on the test set was based on metrics such as weighted accuracy, precision, recall, F1-Score, and area under the curve (AUC). The outcomes of the model tests were presented as means and standard deviations (x±s).
-
The Wide and Deep model outperformed other models, attaining a recall of 92.08, an F1 score of 93.78, and an AUC of 95.99. XGBoost demonstrated superior precision to Wide and Deep, while CNN showed a comparable AUC. However, their recall and F1 scores were slightly lower compared to Wide and Deep. The performance difference between the other models and Wide and Deep was notable (Table 1).
Model Precision Recall F1 Score Weighted AUC XGBoost 96.52±0.08 73.02±0.22 82.68±0.16 86.34±0.11 CNN 93.65±0.34 89.62±0.40 91.38±0.36 94.75±0.20 GRU 94.07±0.37 87.29±0.57 89.62±0.40 93.60±0.29 Transformer 94.06±1.21 83.93±0.81 87.47±1.10 91.90±0.41 Attention GRU 94.34±0.56 87.63±0.35 90.06±0.46 93.76±0.18 Wide and Deep 95.75±0.06 92.08±0.10 93.78±0.09 95.99±0.05 Abbreviation: CNN=Convolutional Neural Networks; GRU=Gated Recurrent Unit; AUC=area under the curve. Table 1. Comparative performance metrics of deep learning models in cause-of-death analysis.
The Wide and Deep model consistently demonstrated superior and stable performance across all chain lengths, exhibiting the highest accuracy, precision, recall, and F1 score, notably at chain length 2 (accuracy: 92.62, precision: 97.11, recall: 93.91, F1 score: 95.08). However, the model’s performance slightly declined with longer chain lengths (Table 2).
Length of chain Model Accuracy Precision Recall F1 Score Length=1 XGBoost 67.24±0.73 97.65±0.19 74.75±0.61 83.51±0.51 Samples=5,281 CNN 90.22±1.20 97.61±0.32 96.50±0.21 97.26±0.26 GRU 86.28±1.44 97.31±0.96 93.55±0.52 95.61±0.61 Transformer 83.10±1.63 97.56±1.23 92.21±0.89 94.14±1.14 Attention GRU 87.23±0.93 97.94±0.59 94.21±0.55 95.46±0.46 Wide and Deep 92.90±0.20 98.63±0.21 97.34±0.07 97.13±0.13 Length=2 XGBoost 72.53±0.41 97.04±0.11 70.97±0.19 81.16±0.16 Samples=9,450 CNN 89.63±0.56 94.70±0.36 91.38±0.48 92.43±0.43 GRU 86.50±0.66 94.27±0.32 88.03±0.65 90.47±0.47 Transformer 82.76±1.60 95.09±1.37 85.05±1.28 89.35±1.35 Attention GRU 87.02±0.40 94.98±0.82 88.72±0.40 91.52±0.52 Wide and Deep 92.62±0.12 97.11±0.07 93.91±0.09 95.08±0.08 Length=3 XGBoost 68.76±0.20 96.24±0.15 74.86±0.29 83.22±0.22 Samples=6,095 CNN 84.81±0.88 91.60±0.45 85.20±0.52 87.34±0.34 GRU 83.75±0.52 93.42±0.72 84.10±0.60 87.37±0.37 Transformer 80.86±0.65 93.72±0.97 79.86±0.25 84.73±0.73 Attention GRU 84.22±0.69 93.48±0.61 84.22±0.42 87.48±0.48 Wide and Deep 88.53±0.35 94.20±0.14 88.49±0.30 91.24±0.24 Length=4 XGBoost 56.32±2.39 93.75±0.33 72.30±0.42 79.33±0.33 Samples=1,384 CNN 75.07±1.40 83.51±1.20 70.84±1.08 75.95±0.95 GRU 79.63±0.83 88.44±0.52 72.31±1.12 76.80±0.80 Transformer 75.27±2.13 86.04±1.46 62.64±2.27 63.84±1.84 Attention GRU 76.17±0.33 86.00±0.77 70.06±0.79 73.40±1.40 Wide and Deep 81.00±0.49 86.66±0.76 75.33±0.55 79.50±0.50 Abbreviation: CNN=Convolutional Neural Networks; GRU=Gated Recurrent Unit. Table 2. Model performance across different lengths of cause-of-death chains.
In the original dataset, the ICD-10 categories I, C, J, W, and E represented 83.13% of the causes of death (
Supplementary Table S2 ), and Wide and Deep demonstrated effective predictive performance for these common categories (Figure 2 andSupplementary Table S4 –S7 ). The models achieved the highest accuracy for categories I (96.72%), J (97.92%), and E (94.00%) compared to other models, with the highest F1 scores for all these categories (I: 93.07, C: 98.42, J: 97.62, W: 89.42, E: 92.72). Wide and Deep accurately identified the underlying cause of death, even in cases of incorrect numerical codes (Supplementary Figure S2 ).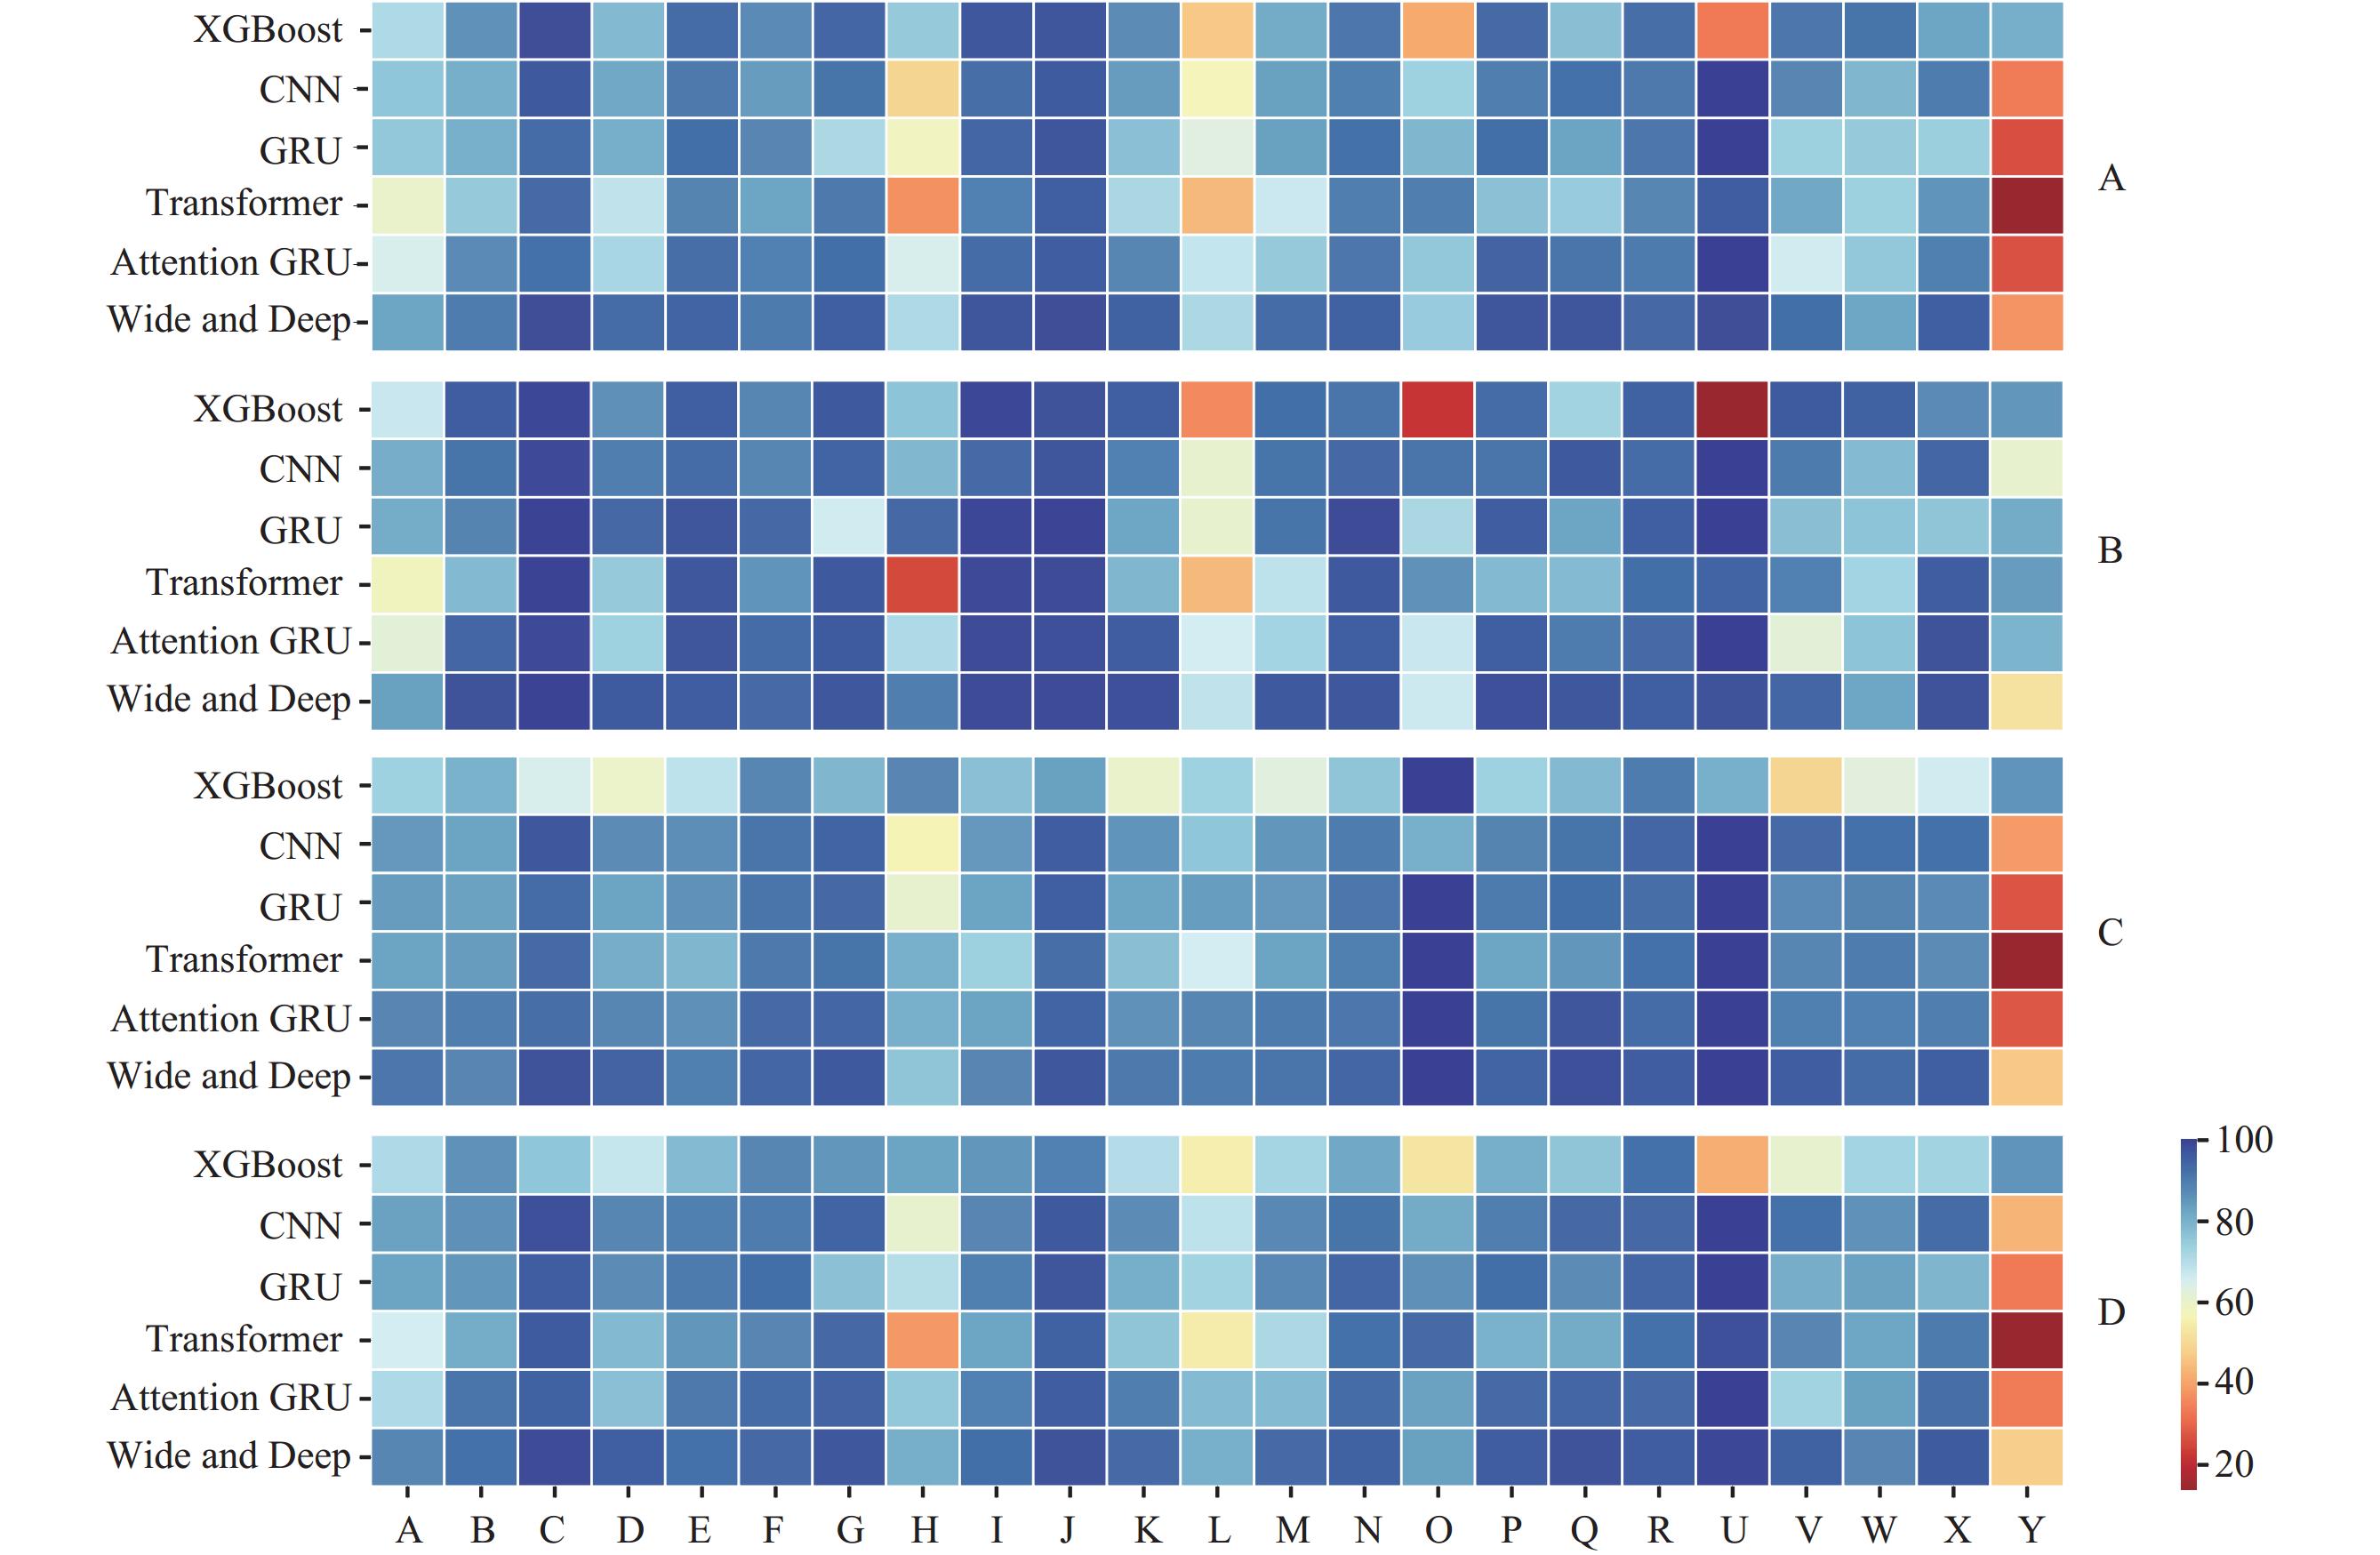 Figure 2.
Comparison of the performance of models for the underlying cause of death speculation. (A) Accuracy; (B) Precision; (C) Recall; (D) F1 Score.
Abbreviation: CNN=Convolutional Neural Networks; GRU=Gated Recurrent Unit. -
This study illustrates the effectiveness of the Wide and Deep framework-based deep learning model for predicting potential causes of death. The model surpasses manual inference levels at Chinese national surveillance points (3,6), showing practical applicability with a weighted F1 Score of 93.78 and a weighted AUC of 95.99.
Previously, the China CDC collaborated with the United States to develop a rule-based automated coding tool for determining the underlying cause of death (7), achieving an accuracy of 84.8% (8). In 2018, US researchers employed sequence rule mining to create a common cause of death inference model, with an error rate of 20.1% compared to human-expert determined death certificates (9). In a separate study in 2020, researchers from France and Italy utilized a deep neural network for inferring the underlying cause of death, achieving over 97% accuracy (10). However, due to country-specific variations, validating the model for cross-country applicability remains an ongoing research challenge (4). Using an attention mechanism, the model exhibited an accuracy range of 80.9% to 81.7% (11). Researchers from the Beijing Institute of Technology and China CDC developed a hybrid inference model with the Sink-CF algorithm, improving precision and recall for determining the fundamental cause of death to 93.8% and 90.1%, respectively (12).
Understanding the intricate protocols of determining the cause of death necessitates extensive medical expertise. Traditional training involves learning these protocols through practice over time to enhance proficiency in completing death certificates (13). Conversely, an AI-based model offers a cost-effective solution for grassroots personnel. Basic computer skills enable staff to utilize the chain-of-cause-of-death data for inferring the underlying cause of death.
Compared to prior studies, our model enhances the overall performance in the task of cause-of-death speculation. The study was carried out using a test dataset that mirrored real-world data. Detailed performance results for different lengths of cause-of-death chains and ICD-10 classifications are presented. A comparative analysis with XGBoost, CNN, GRU, Transformer, and Attention GRU models showed that Wide and Deep achieved the best performance. Additionally, the composition of cause-of-death types in the test dataset closely resembles the actual scenario in Fujian Province (14), offering a test setting that aligns with real-world data.
However, this study is subject to some limitations. First, a notable dissimilarity exists in the distribution of primary causes of death between the original dataset, which predominantly includes diseases related to the circulatory, neoplasms, and respiratory systems. To address this issue, a technique of up sampling and subsampling was employed to balance the training data. Second, while the training data originate from scrutinized records of national mortality surveillance sites, and though these records have undergone expert verification, certain chains of causes of death may still be illogical, potentially impacting the efficacy of model training.
-
The developed cause-of-death inference model in this study demonstrated superior performance, suggesting that the deep learning model utilizing the Wide and Deep framework has the potential to enhance the accuracy of cause-of-death surveillance. Employing AI technology is projected to boost the quality of cause-of-death registration reports efficiently and mitigate the burden of manual review, thereby optimizing time and resource allocation compared to traditional training methods for registration staff.
-
No conflicts of interest.
HTML
METHODS
| Citation: |

|