
 Download:


-
Cognitive frailty, a syndrome characterized by the co-occurrence of physical frailty and mild cognitive impairment, presently lacks an effective treatment (1). Thus, identifying modifiable risk factors to prevent the onset of cognitive frailty is of vital importance. Recent research interest has pivoted towards investigating overall diets rather than specific nutrients or foods in isolation to avoid potential limitations (2). The impact of specific diet types, and more importantly, dietary diversity (DD), on cognitive frailty, however, remains ambiguous.
This study utilized data from the Chinese Longitudinal Healthy Longevity Study (CLHLS) to analyze these aspects. The association between specific diets, DD, and the risk of cognitive frailty in 15,777 older individuals was examined using Cox proportional hazard models. Findings revealed an association between a lower risk of cognitive frailty and regular consumption of fruit, meat, bean products, garlic, and tea. Furthermore, a dietary diversity score (DDS) higher than six was found to decrease the risk of cognitive frailty. DDS of 9–10, 11–12, and 12 and above were associated with a decrease in risk by 16%, 16%, and 15%, respectively. These results underscore that frequent intake of fruit, meat, bean products, garlic, tea, and greater dietary diversity might contribute to a reduced risk of cognitive frailty.
The data utilized in this study was collected from the CLHLS, recognized as the largest global research on centenarians, nonagenarians, octogenarians, and the corresponding younger-old demographic aged 65–79. The total sample size for the study comprises 15,777 participants (
Supplementary Figure S1 ). Data were collected using a simplified food frequency questionnaire, which asked the question: “How often do you currently consume this food?” Food groups included fresh fruit, fresh vegetables, meat, fish, egg, bean products, garlic, and tea, the consumption frequency of which was recorded as “almost every day”, “occasionally”, or “rarely or never”. The DDS was calculated by considering both the number and frequency of food groups consumed, rated on a score of 0 (rarely or never), 1 (occasionally), and 2 (almost every day). Hence, a DDS can range from 0 to 16 and is further categorized as “≤6”, “7–8”, “9–10”, “11–12”, and “≥12”.Cognitive frailty was identified by the simultaneous occurrence of cognitive impairment and frailty status. Cognitive impairment was defined using the education-based Mini-Mental State Examination (MMSE) cut-off scores widely recognized in China (3): MMSE score ≤17 for those with an education period of less than a year, 18–20 for 1–6 years of education, and 21–24 for a period more than 6 years. Frailty status was defined using the modified Fried criteria, which evaluates five domains, including exhaustion, shrink, weakness, low mobility, and inactivity, which were evaluated using self-report data. Participants meeting ≥3 domains were defined as frailty. Potential confounders included in the present study were as follows: baseline age (years), sex (male or female), residence (urban or rural), marital status (married or not married), living pattern (living alone or with others), occupation (farmer or non-farmer), pension (yes or no), education (years), smoking (yes or no), drinking (yes or no), exercise (yes or no), body mass index (BMI, kg/m2), hypertension (yes or no), diabetes (yes or no), stroke (yes or no), and heart diseases (yes or no).
Statistical analyses were executed using R software, version 4.0.0 (R Development Core Team, Vienna, Austria). We employed Cox proportional hazard models for the purpose of estimating the hazard ratios (HRs) and 95% confidence intervals (CIs) concerning the association between specific diets, dietary diversity, and cognitive frailty.
For the association between specific diets, dietary diversity, and cognitive frailty, we utilized two Cox models with a gradual adjustment for potential confounders. The first model was adjusted for baseline age and sex, while the second model was additionally adjusted for residence, education level, marital status, living pattern, pension, smoking habits, alcohol consumption, physical activity, BMI, hypertension, diabetes, stroke, and heart disease.
Concerning the non-linear or linear relationships of DDS with cognitive frailty, we incorporated the application of Cox models with a restricted cubic spline, treating DDS as a continuous variable.
Among the 15,777 participants in the study, 53.5% were women, and the median age was approximately 82 years (
Supplementary Table S1 ). Throughout the median follow-up time of approximately six years, 3,304 cases of emerging cognitive frailty were recorded. Correlations were observed between participants with higher DDS and certain demographics and lifestyle factors: they were more likely to be male, urban residents, married, cohabiting, non-agricultural workers, beneficiaries of a pension, and educated at higher levels. They were also more likely to abstain from smoking and alcohol, engage in physical activity, and maintain higher BMI. A heightened prevalence of hypertension, diabetes, and heart disease was also observed among this group (All P<0.05).After adjusting for various confounding factors, regular consumption of fruits (HR=0.87, 95% CI: 0.79–0.95), meat (HR=0.86, 95% CI: 0.77–0.95), bean products (HR=0.87, 95% CI: 0.78–0.97), garlic (HR=0.90, 95% CI: 0.81–0.99), and tea (HR=0.91, 95% CI: 0.84–0.99) demonstrated significant correlation with a decreased risk of cognitive frailty (all P<0.05; Table 1). Compared to a DDS of “≤6”, both a DDS of “9–10” (HR=0.84, 95% CI: 0.75–0.93), “11–12” (HR=0.84, 95% CI: 0.75–0.95), and “≥12” (HR=0.85, 95% CI: 0.74–0.98) were found to associate with a reduced risk of cognitive frailty (P for the trend <0.05; Table 2). In addition, each incremental dietary item (based on a 1-point increase in score) corresponded with a 2% (HR=0.98, 95% CI: 0.96–0.99) lower risk of cognitive frailty (Table 2). The results of the Cox models with restricted cubic spline also indicated a decrease in the risk of cognitive frailty with an increase in DDS at DDS ≤10 (Figure 1).
Variables Incidence rate per 100 PY Model 1 Model 2 HR (95% CI) P value HR (95% CI) P value Fruit Rarely or never 4.17 1.00 (reference) − 1.00 (reference) − Occasionally 3.47 0.87 (0.80–0.95) 0.002 0.87 (0.80–0.95) 0.002 Almost every day 3.43 0.90 (0.83–0.98) 0.02 0.87 (0.79–0.95) 0.002 Vegetable Rarely or never 5.40 1.00 (reference) − 1.00 (reference) − Occasionally 4.08 0.93 (0.74–1.18) 0.559 0.93 (0.73–1.18) 0.542 Almost every day 3.54 0.90 (0.73–1.11) 0.315 0.89 (0.72–1.11) 0.304 Meat Rarely or never 3.90 1.00 (reference) − 1.00 (reference) − Occasionally 3.31 0.88 (0.79–0.97) 0.009 0.89 (0.80–0.98) 0.019 Almost every day 3.78 0.87 (0.79–0.97) 0.009 0.86 (0.77–0.95) 0.004 Fish Rarely or never 4.06 1.00 (reference) − 1.00 (reference) − Occasionally 3.44 0.94 (0.86–1.01) 0.110 0.91 (0.84–0.99) 0.030 Almost every day 3.51 1.00 (0.90–1.11) 0.994 0.94 (0.85–1.05) 0.272 Egg Rarely or never 3.52 1.00 (reference) − 1.00 (reference) − Occasionally 3.35 0.90 (0.81–1.00) 0.059 0.91 (0.82–1.01) 0.088 Almost every day 3.84 1.02 (0.92–1.14) 0.658 1.01 (0.90–1.13) 0.879 Beans Rarely or never 4.07 1.00 (reference) − 1.00 (reference) − Occasionally 3.59 0.86 (0.78–0.96) 0.004 0.86 (0.78–0.96) 0.005 Almost every day 3.51 0.91 (0.81–1.01) 0.072 0.87 (0.78–0.97) 0.015 Garlic Rarely or never 4.14 1.00 (reference) − 1.00 (reference) − Occasionally 3.51 0.91 (0.85–0.99) 0.022 0.92 (0.85–1.00) 0.040 Almost every day 3.19 0.88 (0.80–0.97) 0.011 0.90 (0.81–0.99) 0.031 Tea Rarely or never 4.15 1.00 (reference) − 1.00 (reference) − Occasionally 3.29 0.89 (0.81–0.98) 0.018 0.89 (0.81–0.98) 0.017 Almost every day 3.01 0.92 (0.84–1.00) 0.041 0.91 (0.84–0.99) 0.028 Note: Model 1: adjusted for baseline age and sex. Model 2: Adjustments were made for baseline characteristics, including baseline age, sex, place of residence, educational attainment, marital status, living arrangements, pension status, health behaviors (smoking and drinking habits, physical activity), body mass index, and known health conditions (hypertension, diabetes, stroke, and heart diseases).
Abbreviation: PY=person-years; HR=hazard ratio; CI=confidence interval.Table 1. Association between specific diets and the risk of cognitive frailty.
Variables Incidence rate per 100 PY Model 1 Model 2 HR (95% CI) P value HR (95% CI) P value DDS DDS≤6 4.29 1.00 (reference) − 1.00 (reference) − DDS=7–8 3.86 0.96 (0.86–1.07) 0.453 0.94 (0.84–1.04) 0.237 DDS=9–10 3.65 0.86 (0.78–0.96) 0.005 0.84 (0.75–0.93) <0.001 DDS=11–12 3.43 0.88 (0.78–0.98) 0.024 0.84 (0.75–0.95) 0.004 DDS≥12 3.11 0.93 (0.81–1.06) 0.252 0.85 (0.74–0.98) 0.026 P-value for trend − 0.97 (0.94–1.00) 0.030 0.95 (0.93–0.98) 0.002 Each 1 unit increase in DDS 3.62 0.98 (0.97–1.00) 0.009 0.98 (0.96–0.99) <0.001 Note: Model 1: adjusted for baseline age and sex. Model 2: Adjustments were made for baseline characteristics, including age, sex, place of residence, educational attainment, marital status, living arrangements, pension status, health behaviors (smoking and drinking habits, physical activity), body mass index, and known health conditions (hypertension, diabetes, stroke, and heart diseases).
Abbreviation: PY=person-years; HR=hazard ratio; CI=confidence interval; DDS=dietary diversity score.Table 2. Association between DDS and the risk of cognitive frailty.
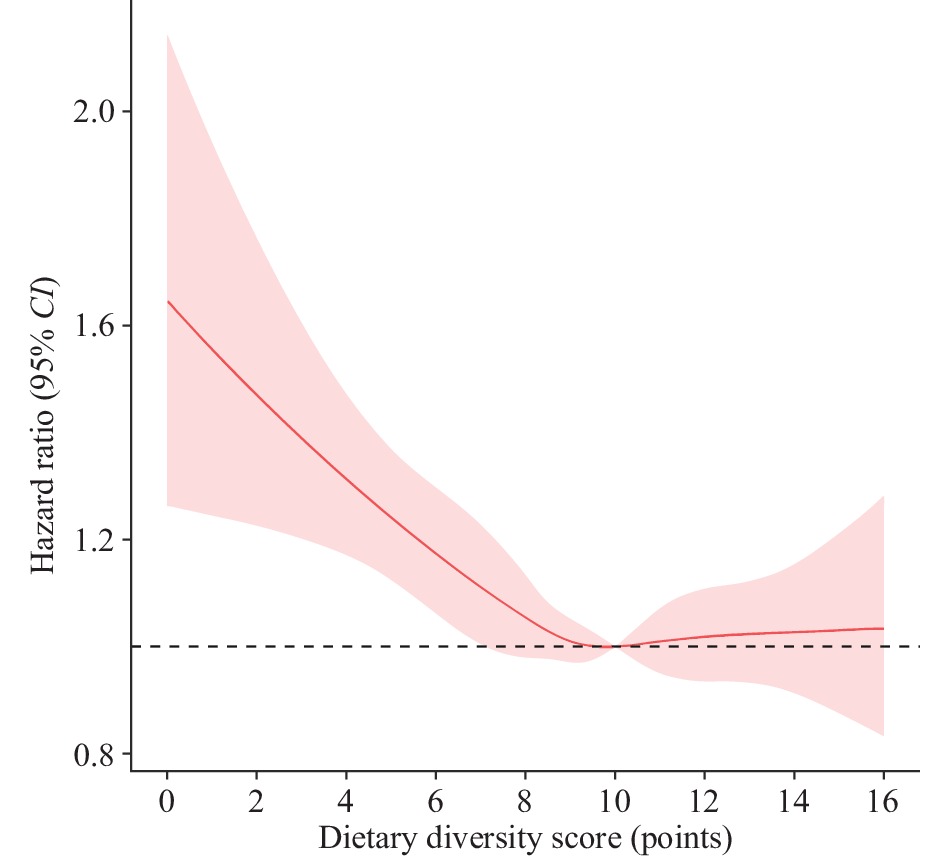 Figure 1.
Relationship between DDS and risk of cognitive frailty as depicted by restricted cubic spline modeling.
Note: The y-axis represents the logarithm of the hazard ratios obtained from the multi-variable Cox model. The adjusted hazard ratio pertaining to the risk of cognitive frailty is illustrated by the red line. The shaded area depicts the 95% CI of these adjusted hazard ratios.
Abbreviation: CI=confidence interval.
-
This study reveals a corresponding decrease in the risk of cognitive frailty among the elderly population with a higher frequency of consumption of fruits, meat, bean products, garlic, and tea. Additionally, an inverse relationship was observed between the HR of cognitive frailty and the increasing DDS, particularly when the DDS is equal to or less than 10.
Our findings are consistent with a previous cross-sectional study demonstrating that routine consumption of fruits may contribute to a reduced risk of cognitive frailty in older individuals (4). This correlation could potentially be attributed to the antioxidant richness of fruits, which can attenuate neuronal damage and guard against oxidative stress, thereby delaying cognitive impairment (5). Additionally, antioxidative properties have been linked to slowing the onset of frailty through the prevention of oxidative stress (6).
The present study demonstrates an inverse correlation between frequent meat consumption and the risk of cognitive frailty. This aligns with previous research that has found a moderately high meat intake and a reduced risk of developing dementia (7). A separate community-based study echoed these findings, suggesting that an increased meat intake is inversely associated with the development of frailty (8). A plausible explanation for these observations could be that elevated meat consumption provides enough protein and fat. These essential nutrients may help achieve higher energy intake, which in turn could lead to a lower probability of incident cognitive frailty among older adults.
A recent meta-analysis suggested that the consumption of soy may enhance overall cognitive function in adults. This positive effect is potentially attributable to the isoflavones and other phytochemical components found in soybeans. Numerous studies have shown that inflammation exacerbates the risk of pathological conditions and age-related diseases. Additionally, it has been related to increased skeletal muscle wasting, strength loss, and functional impairments. Based on these prior findings, our study presents the first cohort evidence demonstrating that the consumption of bean products may mitigate cognitive frailty in older adults (9).
The findings of our study align with prior research, revealing that regular garlic consumption is inversely associated with the risk of cognitive frailty (10-11). This correlation can potentially be attributed to allicin, a constituent of garlic extract known for its antioxidative and neuroprotective abilities. This molecule may have the capacity to enhance cognitive functions in circumstances involving neurodegenerative and neuropsychiatric disorders (10). Moreover, it could potentially mitigate the probability of age-related frailty via the prevention of osteoporosis (11).
Our research demonstrates an inverse association between higher tea consumption frequency and cognitive frailty. This finding aligns with a cross-sectional study that utilized data from the 2014–2016 Nutrition and Health Survey in Taiwan (4). Evidently, similar to fruit, tea is abundant in antioxidants that might mitigate oxidative damage and defend against oxidative stress. As a result, this could potentially decelerate neurodegenerative decline, both cognitive and motor.
The results of this study suggest that an increase in DDS up to a score of 10 is inversely associated with the risk of cognitive frailty. This finding aligns with a previous study that found older individuals with cognitive frailty typically had lower DDS scores (4). Malnutrition could potentially contribute to the emergence or exacerbation of both physical frailty and cognitive dysfunction. Global Dietary Guidelines advocate for a varied diet, assuming that a diverse intake of foods will provide the essential nutrients needed for optimal health (12). This is particularly indispensable for the senior population, where dietary diversity greatly signifies adequate nutrient content. Therefore, our findings underscore the need to promote increased dietary diversity among the elderly as a means to potentially prevent cognitive frailty in later life.
Several limitations of this study need to be considered when interpreting the results. First, the data on food frequency, as collected in the CLHLS, were self-reported. Second, the study did not record comprehensive dietary details, such as the volume and quality of food consumed or total caloric intake; this may result in inexact measurements. Third, as the study participants were comprised solely of elderly individuals residing in China, care should be taken when generalizing these findings to other demographics.
In conclusion, this research illustrates an association between a decreased risk of cognitive frailty in older individuals and the frequent consumption of certain foods, including fruit, meat, bean products, garlic, and tea, along with a higher DDS. Strategies to encourage the consumption of these diets and dietary diversity merit consideration, as they may offer protective benefits against cognitive frailty for the elderly.
-
No conflicts of interest.
HTML
| Citation: |

|