

 Download:


-
Congenital heart defects (CHDs) were the most prevalent birth defects in China during 2000–2011. It’s 40.95 per 10,000 births in 2011, which accounted for 26.7% of all birth defects, data from hospital-based birth defects surveillance revealed (1). Of these, CHDs form the most common group, accounting for one-third of the total (1). The incidence of CHDs during the period from 2013 to 2021 was 82.00 per 10,000 births in Europe (2). For Shanghai, the incidence from 2016 to 2018 was recorded as 81.00 per 10,000 births (3), while Jinan demonstrated a lower incidence rate of 54.96 per 10,000 births from 2013 to 2020 (4).
CHDs can be complex and involve a variety of subtypes. Further, they can be categorized based on severity, as either critical CHDs (CCHDs) or non-critical CHDs (non-CCHDs). The World Health Organization (WHO) reports that CCHDs account for 25% of all CHDs, with infants diagnosed requiring intervention within the first year of life. In many countries, the incidence rate of non-CCHDs is increasing, whereas the rate of CCHDs has remained relatively stable.
This study aims to examine the trends and incidence rates of CHDs, providing data to inform governmental policy interventions. Our findings reveal an increasing incidence rate of CHDs in the Haidian District, Beijing, from 84.65 per 10,000 births in 2013 to 105.72 per 10,000 births in 2022, with non-CCHDs contributing significantly to this increase. Meanwhile, the incidence of CCHDs remained stable at an average of 19.00 per 10,000 births. Interestingly, improved diagnostic techniques have not coincided with improved survival rates for both CCHDs and non-CCHDs.
This study analyzes data from a hospital-based BD surveillance system in Haidian District. The surveillance system’s details were highlighted in a prior publication (5). Each pertinent healthcare institution in the district (18 community health service centers, midwifery agencies, and children’s hospitals) was obligated to complete unified forms and registration cards, reporting individual details about BDs and infant deaths. As per the Beijing Municipal Health Commission’s protocols, a prenatal diagnosis rate exceeding 90% is required, with further examinations conducted on newborns exhibiting abnormalities. The diagnosis of CHDs followed the standards outlined by the International Statistical Classification of Diseases and Related Health Problems, 10th Edition. Joinpoint regression, facilitated by joinpoint software (version 4.9.1, Information Management Services, Inc., Calverton, MD, USA), was employed to calculate the annual percentage change (APC) and the average annual percentage change (AAPC) in CHDs prevalence. Statistical significance was marked by a two-tailed P value of less than or equal to 0.05. The survival rate took the total number of CHDs into account in relation to live births, expressed as the number of live births per 100 CCHDs or non-CCHDs. The total perinatal infant count each year in Haidian District, China, formed the numerators to compute the annual prevalence, delineated as per 10,000 births.
In summary, 12 subtypes were recognized as CCHDs: common arterial trunk, double outlet right ventricle, complete transposition of great vessels, single ventricle, tetralogy of Fallot (TOF), congenital tricuspid stenosis, Ebstein’s anomaly, hypoplastic left heart syndrome, interrupted aortic arch, pulmonary artery atresia, total anomalous pulmonary venous connection, and aortic coarctation.
-
Between the years 2013 and 2022, there were 364,758 births reported in the Haidian District, Beijing, China. During this period, a total of 2,946 CHDs cases were identified, corresponding to a prevalence rate of 80.77 per 10,000 births (95% CI: 77.89 to 83.72). Despite there being no prominent temporal trend observed for the total number of CHDs, a significant trend was noted upon the exclusion of patent ductus arteriosus (PDA). Specifically, there was an AAPC of 6.93% in CHDs cases excluding PDA (95% CI: 2.97% to 11.04%, P<0.001).
Over a ten-year span, the most frequently identified subtypes of CHDs included ventricular septal defect (VSD), PDA, atrial septal defect (ASD), persistent left superior vena cava (PLSVC), and TOF. It was observed that PDA and VSD combined, accounted for over half of total CHDs diagnoses (Figure 1). During 2013–2015, PDA was the prevalent subtype, but after 2015 VSD became predominant. There was an observed average annual decrease of 11.33% (AAPC: –11.33%, 95% CI: −19.67% to −2.12%, P<0.05) in PDA prevalence, whilst VSD and PLSVC saw an average annual increase of 7.79% (AAPC: 7.79%, 95% CI: 2.96% to 3.77%, P<0.01) and 15.13% (AAPC: 15.13%, 95% CI: 6.87% to 24.04%, P<0.001) respectively. No significant temporal trend was observed in the prevalence of ASD or TOF (AAPC: 0.65%, 95% CI: −10.15% to −12.69%, P=0.911; AAPC: 1.66%, 95% CI: −8.34% to −12.76%, P=0.723).
 Figure 1.
Prevalence of the five most common subtypes of congenital heart defects in Haidian District, Beijing Municipality, China, from 2013 to 2022.
Abbreviation: VSD=ventricular septal defect; PDA=patent ductus arteriosus; ASD=atrial septal defect; PLSVC=persistent left superior vena cava; TOF=tetralogy of Fallot.Figure 2 classifies CHDs into CCHDs and non-CCHDs. The average prevalence was noted as 19.00/10,000 for CCHDs and 61.77/10,000 for non-CCHDs. While the non-CCHDs indicated no significant temporal trend (AAPC: 0.86%; 95% CI: −5.98% to 8.08%; P=0.809), excluding from the count a common condition known as PDA resulted in a noteworthy trend, including an annual average increase of 9.36% (AAPC: 9.36%; 95% CI: 5.93% to 12.89%; P<0.001). However, no significant temporal trend was observed for the CCHDs category (AAPC: 2.46%; 95% CI: −3.93% to 9.28%; P=0.409). A minor increase in CCHDs prevalence occurred, from 14.25/10,000 to 25.01/10,000, throughout the period of 2013–2021, while an abrupt drop to 10.86/10,000 was reported in 2022.
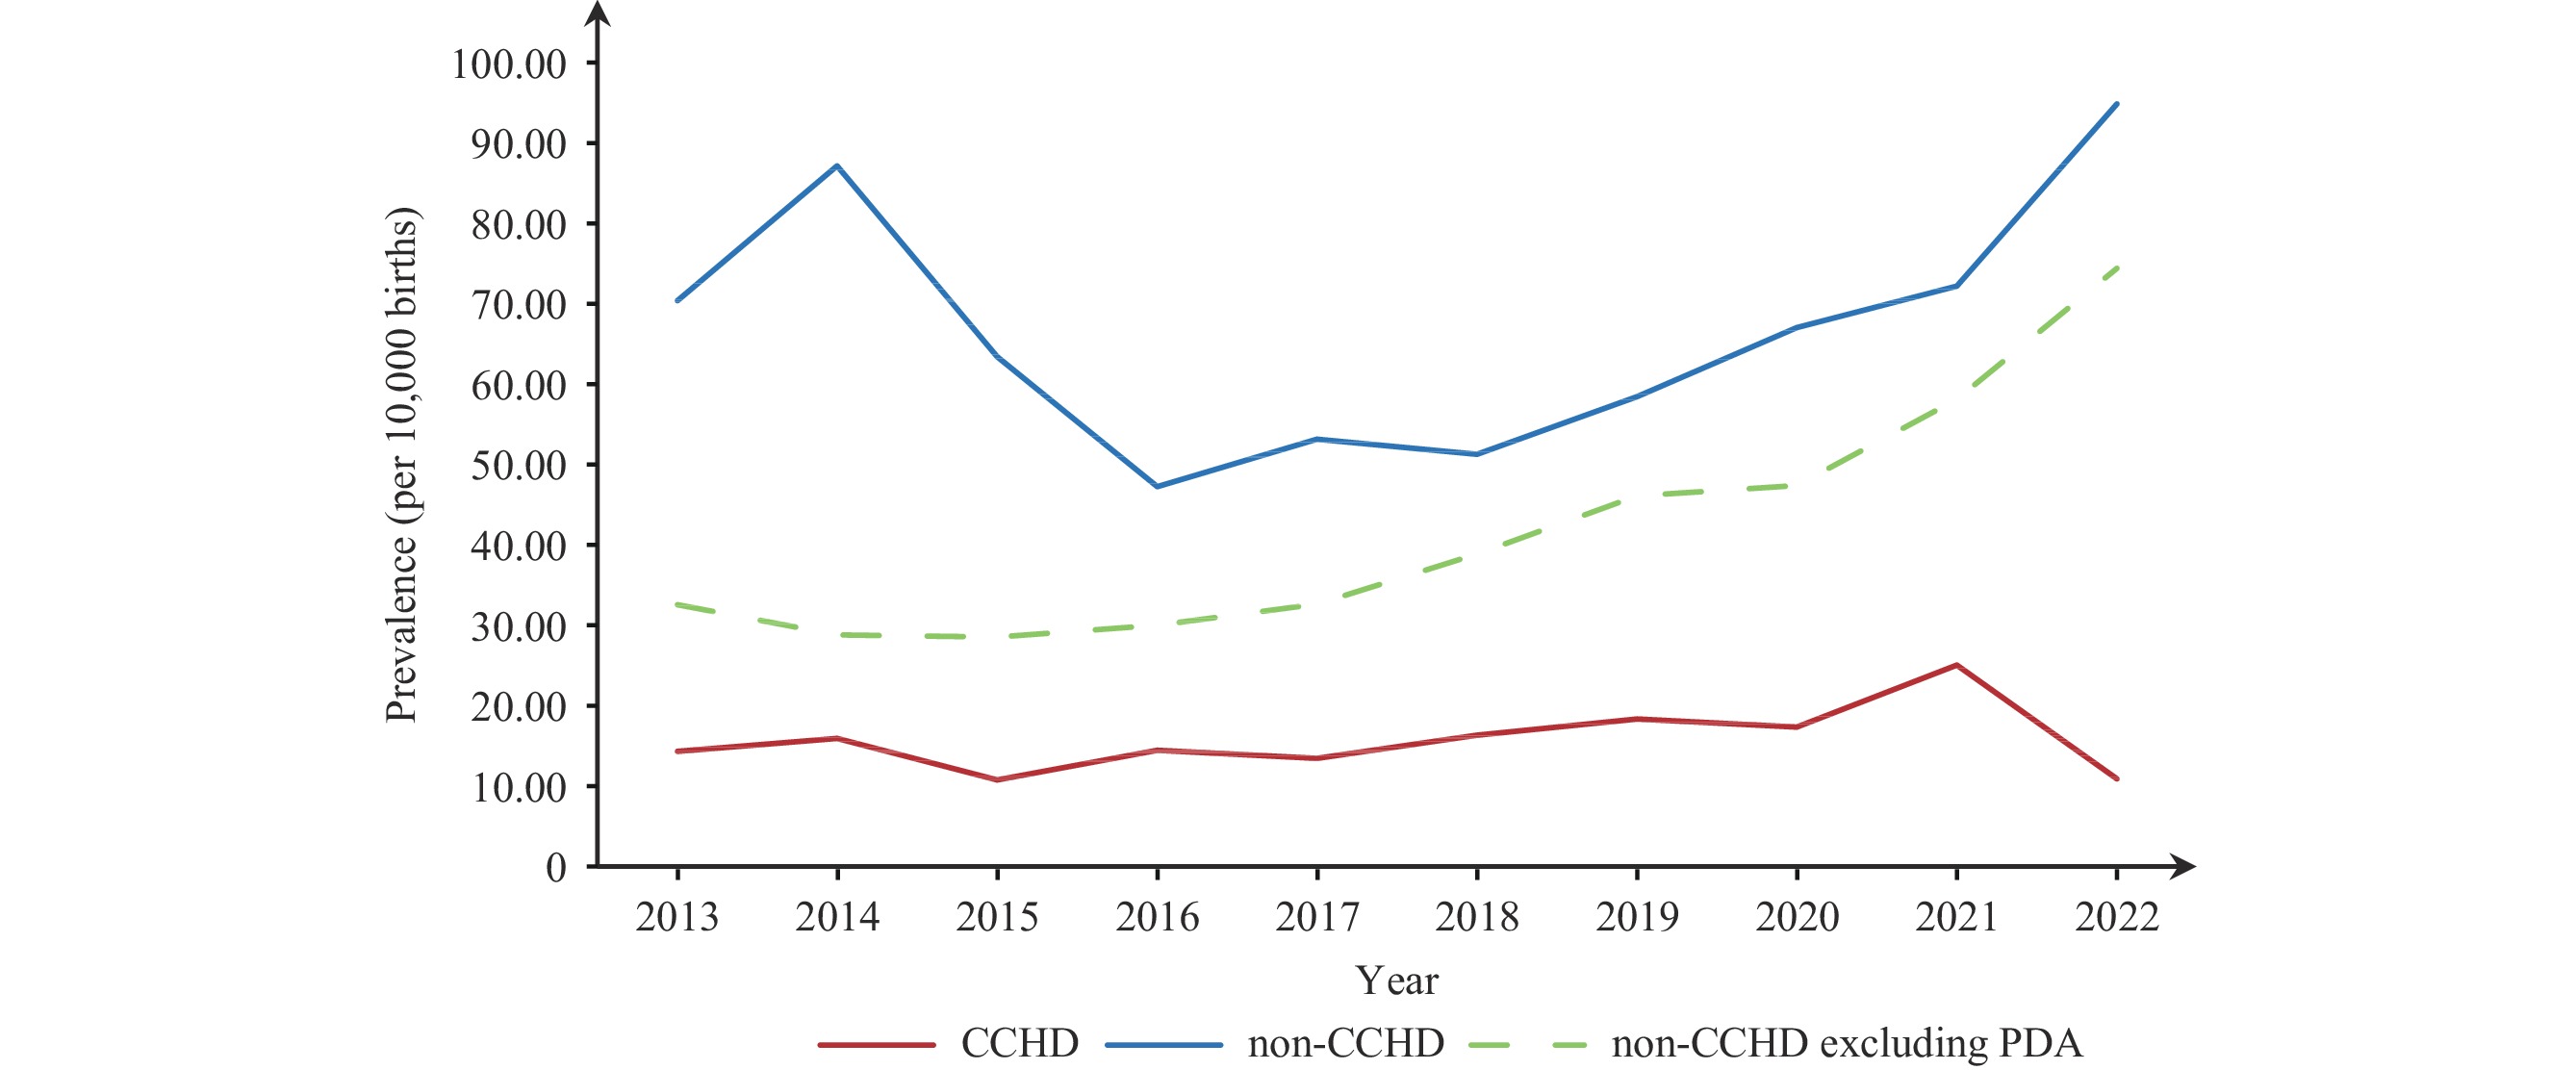 Figure 2.
Prevalence of critical and non-critical congenital heart defects in Haidian District, Beijing Municipality, China, between 2013 and 2022.
Abbreviation: CCHDs=critical congenital heart defects; non-CCHDs=noncritical congenital heart defects; PDA=patent ductus arteriosus.Figure 3 illustrates the proportion of CCHDs and non-CCHDs diagnoses for gestational weeks less than 28 and more than 28. The proportion of diagnoses made during gestational weeks less than 28 is demonstrating a significant increase for both. Specifically, the CCHDs diagnoses have been growing by 2.40% annually under 28 gestational weeks (AAPC: 2.40%; 95% CI: 1.47% to 3.34%; P<0.001). In 2013, the proportion of CCHDs diagnoses made at under 28 gestational weeks was 77.05%, which increased to 100% in 2022 (Figure 3A). Non-CCHDs diagnoses at under 28 gestational weeks have been increasing by 15.08% annually (AAPC: 15.08%; 95% CI: 9.70% to 20.72%; P<0.001), and significantly, the proportion of non-CCHDs diagnoses at under 28 gestational weeks doubled from 21.03% in 2013 to 47.49% in 2021. Over time, although the proportion of CCHDs diagnoses is notably higher, non-CCHDs diagnoses have shown a more rapid increase (AAPC: 15.08% vs. 2.40%). Lastly, by the end of 2022, 100% of non-CCHDs diagnoses are made at under 28 gestational weeks (Figure 3B).
 Figure 3.
Percentage of congenital heart defects diagnosed at less than 28 weeks and greater than or equal to 28 weeks in Haidian District, Beijing Municipality, China, from 2013 to 2022. (A) Percentage of critical congenital heart defects; (B) Percentage of non-critical congenital heart defects.
Table 1 illustrates a trend of decreasing survival rates for both CCHDs and non-CCHDs. The AAPC was −2.19% for CCHDs (AAPC: −2.19%; 95% CI: −14.35% to 11.70%; P=0.71) and −0.62% for non-CCHDs (AAPC: −0.62%; 95% CI: −1.37% to 0.12%; P=0.09), though neither was statistically significant. Within the CCHDs category, the highest survival rate recorded was 26.92% in 2022, while the lowest was 4.84% in 2021. Additionally, survival rates were markedly higher in non-CCHDs than in CCHDs (85.63% vs. 19.01%). When reviewing non-CCHDs specifically, the survival rate peaked at 90.05% in 2014 and dipped to a low of 81.37% in 2019. All AAPCs discussed are listed in Table 2.
Year CCHDs Non-CCHDs Live birth Total Survival rate (%) Live birth Total Survival rate (%) 2013 10 61 16.39 237 271 87.45 2014 7 77 9.09 335 372 90.05 2015 6 44 13.64 214 244 87.70 2016 11 63 17.46 171 203 84.24 2017 12 59 20.34 191 233 81.97 2018 10 58 17.24 157 182 86.26 2019 7 64 10.94 166 204 81.37 2020 4 45 8.89 146 174 83.91 2021 3 62 4.84 147 179 82.12 2022 7 26 26.92 196 227 86.34 Total 77 482 19.01 1960 2289 85.63 Note: AAPC was −2.19% for CCHDs (AAPC: −2.19%, 95% CI: −14.35% to 11.70%, P=0.71), and −0.62% (AAPC: −0.62%; 95% CI: −1.37% to 0.12%; P=0.09).
Abbreviation: CCHDs=critical congenital heart defects; non-CCHDs=non-critical congenital heart defects; AAPC=average annual percent change; CI=confidence interval.Table 1. Survival rates for critical and non-critical congenital heart defects in Haidian District, Beijing Municipality, China, from 2013 to 2022.
Variable Trend Period APC (95% CI) P AAPC (95% CI) P Joinpoint trends in Figure 1 Total Trend 1 2013–2017 −9.84 (–20.46 to 2.20) 0.087 1.35 (−4.24 to 7.26) 0.643 Trend 2 2018–2022 11.29 (1.85 to 21.61) 0.027 Total exclude PDA Trend 1 2013–2015 −9.43 (−25.97 to 10.82) 0.263 6.93 (2.97 to 11.04) <0.001 Trend 2 2016–2022 12.12 (9.14 to 15.18) <0.001 PDA Trend 1 2013–2022 −11.33 (−19.67 to −2.12) <0.05 −11.33 (−19.67 to −2.12) <0.05 VSD Trend 1 2013–2022 7.79 (2.96 to 12.86) <0.01 7.79 (2.96 to 12.86) <0.01 ASD Trend 1 2013–2017 −18.79 (−36.75 to 4.28) 0.085 0.646 (−10.11 to 12.69) 0.911 Trend 2 2018–2022 19.49 (0.13 to 42.60) <0.05 PLSVC Trend 1 2013–2016 33.12 (4.42 to 69.70) <0.05 15.13 (6.87 to 24.04) <0.001 Trend 2 2017–2022 7.07 (−1.37 to 16.23) 0.085 TOF Trend 1 2013–2022 1.66 (−8.34 to 12.76) 0.723 1.66 (−8.34 to 12.76) 0.723 Joinpoint trends in Figure 2 CCHDs Trend 1 2013–2022 2.46 (−3.93 to 9.28) 0.409 2.46 (−3.93 to 9.28) 0.409 Non-CCHDs Trend 1 2013–2018 −6.60 (−15.62 to 3.38) 0.144 3.19 (−3.30 to 10.12) 0.344 Trend 2 2019–2022 16.87 (1.24 to 34.92) 20.038 Non-CCHDs excluding PDA Trend 1 2013–2022 14.55 (10.97 to 18.24) <0.001 14.55 (10.97 to 18.24) <0.001 Joinpoint trends in Figure 3 CHDs diagnosed at <28 weeks Trend 1 2013–2022 2.40 (1.47 to 3.34) <0.001 2.40 (1.47 to 3.34) <0.001 Non-CCHDs diagnosed at <28 weeks Trend 1 2013–2022 15.08 (9.70 to 20.72) <0.001 15.08 (9.70 to 20.72) <0.001 Abbreviation: VSD=ventricular septal defect; PDA=patent ductus arteriosus; ASD=atrial septal defect; PLSVC=persistent left superior vena cava; TOF=tetralogy of Fallot; CHDs=critical congenital heart defects; non-CCHDs=noncritical congenital heart defects; APC=annual percentage change; AAPC=average annual percentage change. Table 2. Trends in the prevalence of specific coronary heart disease subtypes and proportion diagnosed before 28 weeks in Haidian District, Beijing Municipality from 2003 to 2022, as analyzed by Joinpoint regression.
-
The prevalence of CHDs within Haidian District from 2013–2022 was 80.77 per 10,000 births. This was higher than the rate witnessed in Jinan from 2013–2020 (52.10 per 10,000 births) (6), but was modestly lower than figures recorded in Europe from 2013–2021 (82.00 per 10,000 births) (2 and Shanghai from 2016–2018 (81.00 per 10,000 births) (3). It’s commonly cited that the worldwide prevalence of CHDs is 80.00 per 10,000 births, mirroring our findings (1). The common CHDs variants in Haidian District were — in descending order — VSD, PDA, ASD, PLSVC and TOF. The four most common variants were non-CCHDs, while TOF was the only CCHD presented within the top five. Non-CCHDs were notably more prevalent compared to CCHDs.
The overall prevalence of CHDs from 2013 to 2022 did not display a noteworthy temporal trend. Various countries and regions, such as Asia (1970–2017) and Jinan (2005–2020), have reported a broad upward prevalence trend for CHDs (4,7). Evidently, the prevalence trend of total CHDs is mainly influenced by non-CCHDs, with PDA and VSD playing key roles. During 2018–2022, non-CCHDs, excluding PDA, rose significantly, by 12.93% annually, outpacing CCHDs, which remained comparatively stable. Until 2016, total CHDs were predominated by PDA, exhibiting a progressive increase from 37.88/10,000 to 58.35/10,000 in 2013–2014 and a significant decrease from 58.35/10,000 to 17.19/10,000 in 2014–2016. The implementation of new screening criteria (2015 edition), that came into effect in 2016, led to a precipitous decrease in the prevalence of PDA, as defects smaller than 3 mm were no longer classified. Consequently, VSD emerged as the leading subtype. Over the years, VSD has sustained a steady influx, likely as a result of overdiagnosis due to technological progress or adverse atmospheric conditions, as its steady rise suggests. For other reasons probably, researchers from southern California discovered that a higher exposure to carbon monoxide leads to an increased risk of VSD (8). Considering the potential overdiagnosis of PDA prior to the publication of the new diagnostic criteria, we also analyzed the prevalence trend excluding PDA. This evaluation revealed a substantial increasing trend with an annual average growth of 9.36%.
The detection of CHDs at less than 28 weeks of gestation illustrates advancements in diagnostic ultrasound techniques. Both CCHDs and non-CCHDs have continually been better identified through these improved screening methods. More pronounced structural defects make CCHDs easier to diagnose, often necessitating early surgery. Conversely, minor non-CCHDs forms, such as small VSDs and PDAs, even if diagnosed early, may not lead to health complications. They often close on their own over time. Early detection of non-CCHDs has not significantly enhanced survival rates, which may be due to the possible increase in therapeutic abortions. According to the collected data, the rate of therapeutic abortions was 10.98% from 2013–2015, increasing to 13.38% from 2016–2022. European Surveillance of Congenital Anomalies (EUROCAT) data also showed an increasing trend in the termination of pregnancy for congenital anomaly (TOPFA), from 50% in 2013 to 62.5% in 2021 (2). Many parents tend to decide on induced abortions upon diagnosis, often without sufficient medical consultation and regardless of prognosis. Moreover, the survival rate for CCHDs in 2022 was extremely high, primarily due to the reduction in the number of CCHDs cases. Yet, these results coincided without any changes in screening criteria, signaling a need for additional investigation into the high survival rate of CCHDs in 2022. In conclusion, there has been an increase in the prevalence of CHDs, specifically non-CCHDs, in the Haidian District of China over the past decades. This increase is likely attributed to the ongoing improvement in diagnostic techniques.
For effective management of CCHDs, it is essential to conduct screenings as early as possible to facilitate timely surgical intervention. Conversely, for non-CCHDs, it’s critical to update diagnosis criteria in time to prevent overdiagnosis and unnecessary TOPFA (9-10). Due to this, we advocate both a graded approach in managing CCHDs and non-CCHDs conditions and periodic updates to diagnosis criteria to prevent potential overdiagnosis in non-CCHDs cases. Moreover, post-diagnosis medical consultation should be enhanced to minimize unnecessary therapeutic abortions. The lack of comprehensive medical consultation has often resulted in unwarranted inductions in mild non-CCHDs cases, despite them having a high survival possibility.
The present study boasts several key strengths. First, it utilizes a thorough BD surveillance system, established in Beijing, which is characterized by adherence to rigorous detection standards. This guarantees the reliability of the results. Secondly, Haidian District, where the hospital-based surveillance data was collected, boasts a 100% rate of hospitalized deliveries. As a result, the surveillance data provides an accurately representative picture of the broader population. Lastly, the study introduces an expanded classification system for CHDs within the surveillance system, incorporating more detailed subtypes. This facilitates a more nuanced analysis of CHDs prevalence, which will significantly contribute to the enhancement of future classification systems.
This study, however, is not without its limitations. Given the absence of individual-level data for non-CHDs births, we were unable to conduct a multivariate analysis for other factors associated with CHDs. Future research is needed to further explore the potential influence of these factors on CHDs. Moreover, our investigation was constrained to Haidian District in Beijing, which due to its comparatively advanced economy, might limit the generalizability of the findings to other regions.
-
No conflicts of interest.
-
All the participants in this study. The authors also thank all the obstetricians and pediatricians in the hospital-based birth defect surveillance system for their great effort in data collection.
HTML
| Citation: |

|