

 Download:


-
Gestational diabetes mellitus (GDM) is defined as diabetes diagnosed in the second or third trimester of pregnancy that was not clearly overt diabetes prior to gestation, posing a serious risk to maternal and infant health (1). The prevalence of GDM in China has been increasing, with a recent meta-analysis revealing that the prevalence of GDM in China is 14.8% (2). Folic acid (FA) supplementation is widely promoted among pregnant women in China to reduce the risk of fetal neural tube defects. However, concerns have arisen about the potential effects of FA supplementation on maternal health. Recent studies investigating the association between FA supplementation and GDM have yielded inconclusive results, particularly in regards to maternal supplementation with FA only (FAO) or with multiple micronutrients containing FA (MMFA) (3). This study analyzed data from a prospective cohort of pregnant women at the Haidian Maternal and Child Health Hospital in Beijing, China, during the period from 2017 to 2021, where the prevalence of GDM was 18.8%. The results revealed that women taking MMFA were more likely to develop GDM than women taking FAO.
This ongoing prospective cohort study focuses on pregnant women and has been previously described in detail (4). From October 2017 to October 2021, 4,239 pregnant women at or before 20 weeks of gestation were recruited at the Haidian Maternal and Child Health Hospital in Beijing, China. A structured questionnaire, which included demographic characteristics and detailed FA supplementation information, was administered during recruitment. Information on periconceptional FA supplementation among pregnant women included whether they took supplements (no or yes), type of supplements (FAO or MMFA), timing (before or after conception), and frequency (>24 or ≤24 capsules/month). Frequency of FA supplementation was divided into two groups based on 80% of the recommended standard (30 capsules/month).
After recruitment, the pregnant women underwent the oral glucose tolerance test (OGTT) for blood glucose at 24–28 weeks of pregnancy. GDM diagnosis followed the International Association of Diabetes and Pregnancy Study Group criteria, which required that a pregnant woman met one or more of the following criteria: fasting plasma glucose (FPG) ≥5.1 mmol/L, 1-hour plasma glucose (1 h PG) ≥10.0 mmol/L during OGTT, or 2-hour plasma glucose (2 h PG) ≥8.5 mmol/L during OGTT (1). A total of 818 women were excluded due to unclear information on FA intake, missing OGTT results at 24–28 weeks of pregnancy, and a history of pre-pregnancy diabetes or first-degree family history of diabetes. Consequently, the final analysis included data from 3,421 women. This study was approved by the Biomedical Institutional Review Board of Peking University (IRB00001052-17028), and written consent was obtained from all participants.
In this study, binary logistic regression was employed to analyze the association between FA supplementation and GDM while adjusting for potential confounding variables. These variables, such as maternal age and pre-pregnancy body mass index (BMI), were chosen based on previously relevant studies (5). Additionally, certain food consumption characteristics were included since food can serve as a source of dietary folate. Outcome variables like FPG GDM, 1 h PG-GDM, and 2 h PG-GDM were defined based on distinct testing time points, which were utilized to further explore the association between FA supplementation and different GDM subtypes. The logistic analysis results are presented as odds ratios (ORs) and 95% confidence intervals (95% CIs). All analyses were conducted using R software (version 4.0.5; R Development Core Team, Vienna, Austria). A two-tailed P≤0.05 was considered statistically significant.
A total of 3,421 women were included in the final analysis, with ages ranging from 20 to 49 years old (mean=30.2, SD=3.7). Of these participants, 17.5% were classified as above normal weight before conception, with a pre-pregnancy BMI≥24 kg/m2. Among the sample, 643 women (18.8%) were diagnosed with GDM. A higher prevalence of GDM was observed among older, more obese, multiparous, less educated women, and those exposed to smoking (all P<0.05). Additionally, GDM prevalence was higher among women who reported higher consumption of eggs and milk (P<0.05). However, no significant differences were observed in terms of occupation, ethnicity, education, or the frequency of meat, vegetable, fruit, and soybean consumption (all P>0.05) (Table 1).
Variable Total* Non-GDM* GDM* P value† Total 3,421 (100.0) 2,778 (81.2) 643 (18.8) Age (years) <0.001 <30 1,675 (49.0) 1,411 (84.2) 264 (15.8) ≥30 1,746 (51.0) 1,367 (78.3) 379 (21.7) Pre-pregnancy BMI (kg/m2) <0.001 <24 2,654 (81.6) 2,219 (83.6) 435 (16.4) ≥24 598 (18.4) 414 (69.2) 184 (30.8) Occupation 0.072 None 219 (6.5) 168 (76.7) 51 (23.3) Teacher/doctor/technician 1,109 (32.8) 927 (83.6) 182 (16.4) Business/service 791 (23.4) 642 (81.2) 149 (18.8) Public official 698 (20.7) 554 (79.4) 144 (20.6) Others 562 (16.6) 458 (81.5) 104 (18.5) Education 0.031 Master or above 957 (27.7) 795 (83.9) 152 (16.1) College or university 2,247 (65.1) 1,790 (80.4) 436 (19.6) High school or below 250 (7.2) 191 (78.3) 53 (21.7) Ethnicity 0.875 Han 3,208 (93.8) 2,629 (81.1) 613 (18.9) Others 211 (6.2) 175 (81.8) 39 (18.2) Smoking 0.003 No 2,574 (76.0) 2,120 (82.4) 454 (17.6) Yes§ 813 (24.0) 631 (77.3) 182 (22.7) Parity 0.014 Nulliparous 2,464 (80.6) 2,020 (82.0) 444 (18.0) Multiparous 593 (19.4) 460 (77.6) 134 (22.4) Food consumption Meat (times/week) 0.198 ≤3 1,965 (59.8) 1,610 (81.9) 365 (18.1) 4–6 727 (22.1) 588 (80.9) 139 (19.1) >6 595 (18.1) 468 (78.7) 127 (21.3) Egg (times/week) 0.026 ≤3 1,094 (32.2) 913 (83.5) 181 (16.5) 4–6 1,116 (33.8) 903 (80.9) 213 (19.1) >6 1,087 (33.0) 858 (78.9) 229 (21.1) Milk (times/week) 0.015 ≤3 1,253 (38.0) 1,048 (83.6) 205 (16.4) 4–6 995 (30.2) 788 (79.2) 207 (20.8) >6 1,046 (31.8) 837 (80.0) 209 (20.0) Vegetable (times/week) 0.138 ≤3 326 (9.9) 274 (84.0) 52 (16.0) 4–6 809 (24.6) 668 (82.6) 141 (17.4) >6 2,159 (65.5) 1,733 (80.3) 426 (19.7) Fruit (times/week) 0.554 ≤3 173 (5.2) 146 (84.4) 27 (15.6) 4–6 637 (19.3) 518 (81.3) 119 (18.7) >6 2,492 (75.5) 2,020 (81.1) 472 (18.9) Soybean (times/week) 0.652 ≤3 1,898 (57.9) 1,553 (81.8) 345 (18.2) 4–6 865 (26.4) 698 (80.7) 167 (19.3) >6 514 (15.7) 413 (80.4) 101 (19.6) Abbreviation: GDM=gestational diabetes mellitus; BMI=body mass index.
* The total value differs from the sum of subgroups due to the exclusion of cases with missing data.
† Differences in prevalence of GDM by subcategory were examined with the Chi-square test.
§ Smoking included exposure to passive smoking.Table 1. Characteristics of pregnant women between groups of GDM and non-GDM in Beijing, China, 2017–2021, n (%).
Table 2 demonstrates that only 3.2% (109/3,421) of participants did not take FA periconceptionally, while 26.2% (880/3,421) took FAO, and the majority, 70.6% (2,432/3,421), took MMFA. Women who took MMFA were more likely to develop GDM compared to those on FAO (adjusted OR=1.34, 95% CI: 1.05–1.72). No significant difference in GDM prevalence was observed between women taking FAO and those without FA supplementation (adjusted OR=0.76, 95% CI: 0.37–1.55). Furthermore, no associations were detected between the initial time or frequency of FA supplementation and GDM, regardless of stratification by type (all P>0.05).
FA supplementation Total GDM Crude OR (95% CI)* Adjusted OR (95% CI)† Total 3,421 643 (18.8) − − FA supplementation No 109 15 (13.8) Reference Reference Yes 3,312 628 (19.0) 1.47 (0.84–2.55) 1.52 (0.80–2.87) Type FAO 880 145 (16.5) Reference Reference MMFA 2,432 483 (19.9) 1.26 (1.02–1.54) 1.34 (1.05–1.72) Nonusers 109 15 (13.8) 0.81 (0.46–1.44) 0.76 (0.37–1.55) Initial time Nonusers 109 15 (13.8) Reference Reference Before conception 1,689 317 (18.8) 1.45 (0.83–2.53) 1.60 (0.80–3.22) After conception 1,623 311 (19.2) 1.49 (0.85–2.60) 1.64 (0.82–3.30) Supplement frequency Nonusers 109 15 (13.8) Reference Reference ≤24 capsules per month 675 141 (20.9) 1.66 (0.93–2.94) 1.82 (0.89–3.72) >24 capsules per month 2,557 472 (18.5) 1.42 (0.82–2.47) 1.55 (0.77–3.10) Stratified by types Initial time FAO Nonusers 109 15 (13.8) Reference Reference Before conception 465 69 (14.8) 1.09 (0.60–1.99) 1.36 (0.72–2.59) After conception 415 76 (18.3) 1.41 (0.77–2.56) 1.60 (0.85–3.00) MMFA Nonusers 109 15 (13.8) Reference Reference Before conception 1,224 248 (20.3) 1.59 (0.91–2.80) 1.78 (0.88–3.60) After conception 1,208 235 (19.5) 1.51 (0.86–2.66) 1.68 (0.83–3.39) Supplement frequency FAO Nonusers 109 15 (13.8) Reference Reference ≤24 capsules per month 190 37 (19.5) 1.52 (0.79–2.91) 1.87 (0.81–4.31) >24 capsules per month 658 105 (16.0) 1.19 (0.66–2.13) 1.48 (0.68–3.21) MMFA Nonusers 109 15 (13.8) Reference Reference ≤24 capsules per month 485 104 (21.4) 1.71 (0.95–3.08) 1.88 (0.91–3.90) >24 capsules per month 1,899 367 (19.3) 1.50 (0.86–2.62) 1.65 (0.82–3.32) Abbreviation: FA=Folic acid; GDM=gestational diabetes mellitus; OR=odds ratio; CI=confidence interval; FAO=folic acid only; MMFA=multiple micronutrients containing folic acid.
* crude OR: logistic regression. No confounders were adjusted.
† adjusted OR: logistic regression. Adjusted for maternal age, pre-pregnancy BMI, occupation, education, parity, smoking, and consumption of eggs, milk, vegetables, and fruits.
“–” means data not available.Table 2. Association between folic acid supplementation and GDM in pregnant women in Beijing, China, 2017–2021.
When analyzing the association between FA supplementation and GDM subtypes, the results showed that the increased risk for GDM in pregnant women supplemented with MMFA compared to FAO was primarily due to changes in FPG (adjusted OR=1.40, 95% CI: 1.02–1.92). FA supplementation type was not associated with 1 h PG-GDM and 2 h PG-GDM (all P>0.05). (Figure 1).
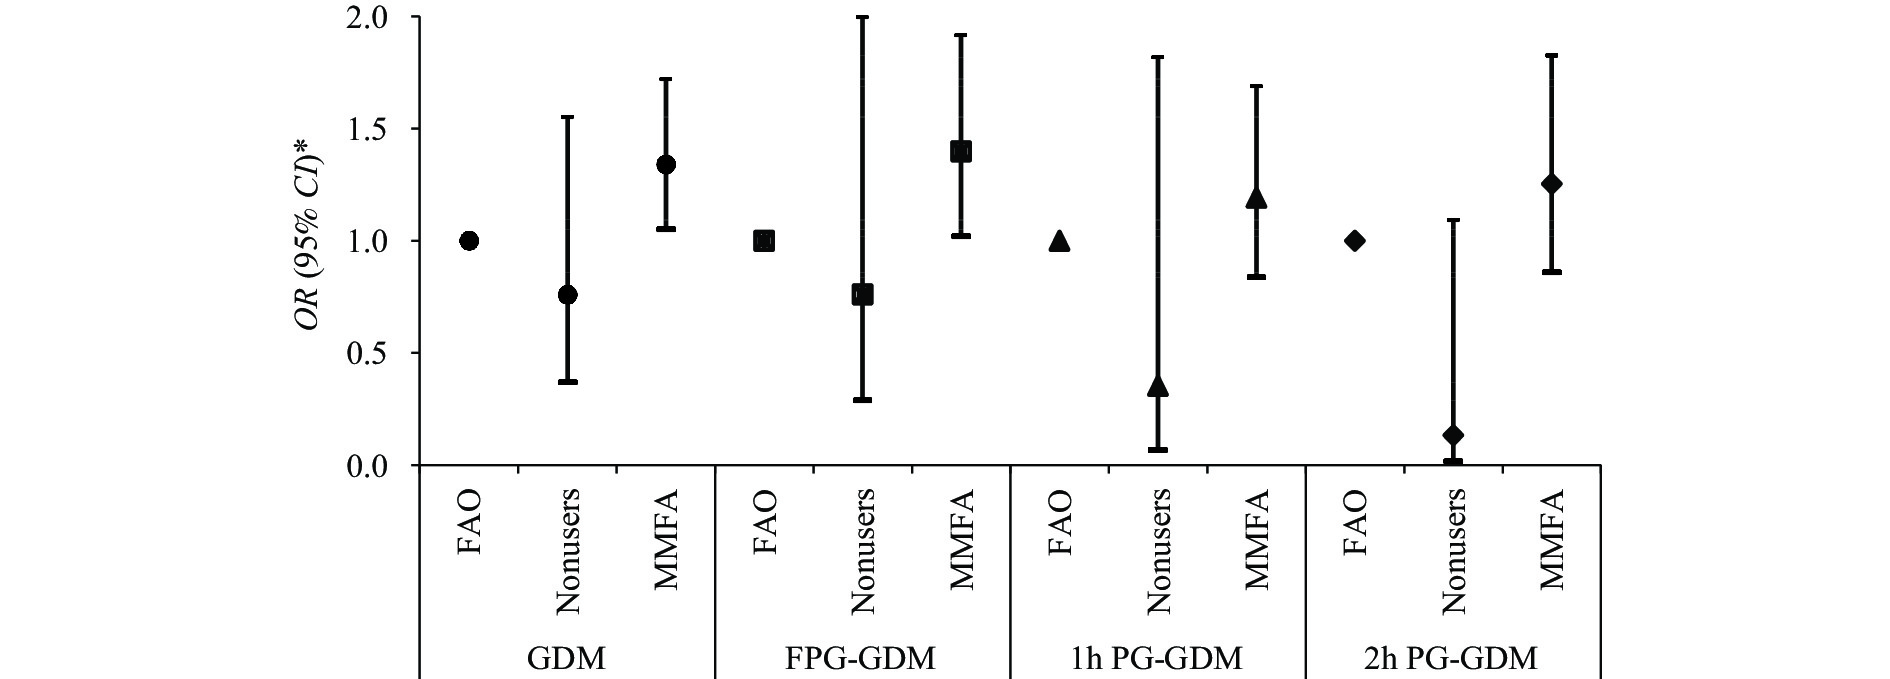 Figure 1.
Association between folic acid supplementation and various subtypes of gestational diabetes mellitus among pregnant women in Beijing, China, 2017–2021.
Abbreviation: GDM=gestational diabetes mellitus; OR=odds ratio; FAO=folic acid only; MMFA=multiple micronutrients containing folic acid; FPG-GDM=GDM diagnosed by fasting plasma glucose; 1 h PG-GDM=GDM diagnosed by 1-hour plasma glucose during OGTT; 2 h PG-GDM=GDM diagnosed by 2-hour plasma glucose during OGTT.
* OR: logistic regression. Adjusted for maternal age, pre-pregnancy BMI, occupation, education, parity, smoking, and consumption of eggs, milk, vegetables, and fruits.
-
We investigated the association between maternal FA supplementation and GDM using a prospective cohort in Haidian District, Beijing. Our results revealed that the GDM prevalence in Beijing was 18.8%, which was slightly higher than the reported prevalence in Beijing in 2017 (17.2%) (5), and surpassing that in China (14.8%) (2). This suggests that GDM prevalence in Beijing is relatively high and continues to increase. Furthermore, only 3.2% of participants did not take FA periconceptionally, and more women opted for MMFA than FAO, which aligns with another survey conducted in Beijing (6). These findings underline the importance of exploring the effects of FAO/MMFA supplementation on GDM.
Our study found that pregnant women taking MMFA had a higher likelihood of developing GDM compared to those taking FAO. We observed no significant difference in GDM risk between women who took FAO and those without supplementation, suggesting that appropriate FA supplementation does not increase GDM risk. Several possible explanations for this association exist.
First, a dose-response relationship may exist between FA and GDM. The main brand of MMFA contains twice the amount of FA (0.8 mg/tablet) as a simple FA tablet (0.4 mg/tablet) (6). Excessive FA can lead to increased circulating unmetabolized folate, which in turn elevates homocysteine levels. This elevation has been associated with increased oxidative stress and impaired pancreatic β-cell function (7). As we did not investigate FA supplementation quantity and dosage, further research should examine the dose-response relationship between FA and GDM.
Second, other nutrients play important roles in numerous cellular and physiological processes. Excessive levels of certain micronutrients in MMFA, such as iron, have been associated with GDM (8). WHO guidelines do not recommend promoting MMFA in pregnant women due to insufficient evidence of its benefits for neonatal survival, growth, or cognitive function compared to FAO. Additionally, MMFA supplementation may pose an increased economic burden for pregnant women (9). Although we did not investigate the specific nutrient contents and doses of MMFA, our results support prioritizing FAO supplementation for GDM prevention. Our study supports the WHO’s recommendation by emphasizing the potential risks of MMFA for women’s health.
Previous research examining the relationship between FA supplementation and GDM has yielded inconsistent findings; some studies have reported a protective effect, while others have found no association or even harmful outcomes (3). These discrepancies are generally attributed to variations in study populations with regard to GDM prevalence, diagnostic criteria, as well as dietary and lifestyle differences. Notably, few investigations have distinguished between types of FA supplementation or considered the influence of other vitamins and minerals. In our cohort, the majority of pregnant women opted for MMFA supplementation, and a significant difference in GDM risk was observed between those taking FAO and those using MMFA. To the best of our knowledge, this study is the first to illuminate the distinct effects of FAO and MMFA on GDM risk, laying the groundwork for future research exploring the relationship between FA supplementation and GDM.
We further compared the effects of FA supplementation on various subtypes of GDM. The findings indicated that MMFA supplementation primarily affected FPG levels, increasing the risk of developing GDM. Previous studies have demonstrated a relationship between vitamin B12 levels and FPG; however, no significant associations were observed between vitamin B12 and either 1 h PG or 2 h PG (10). This may suggest that FPG serves as a more sensitive indicator for GDM diagnosis and predicting risk factors.
Our study exhibited multiple strengths. First, as a prospective cohort study, it excluded women with a history of diabetes mellitus, allowing for the prospective determination that FA supplementation significantly contributed to the heightened risk for GDM. Second, by controlling the consumption frequency of fruits, vegetables, and other foods, we effectively eliminated the influence of dietary FA intake on the results. Lastly, through stratification of the FA supplementation types, we were able to investigate the associations between specific characteristics of FA supplementation and GDM.
This study, however, is subject to several limitations. The population was drawn from Beijing, which has a high standard of living and nutritional status, potentially limiting the generalizability of the results. The older maternal age and prevalence of GDM, as well as potential genetic and environmental factors, may also affect the findings. Additionally, we were unable to obtain and compare the specific components of the MMFA, and our analysis did not investigate the duration or dose of FA supplementation, although we did incorporate frequency. Lastly, we did not examine the association between blood FA levels and GDM; further research is warranted in this area.
In conclusion, our study suggests that maternal periconceptional supplementation with MMFA may result in an increased risk for GDM when compared to FAO supplementation. Pregnant women ought to be cognizant of the potential issues related to over supplementation of certain micronutrients. As new population policies are implemented, the proportion of pregnant women of advanced age continues to rise. Concurrently, improved nutritional status among pregnant women has been observed, as evidenced by increased instances of overweight and excessive gestational weight gain during pregnancy. These factors may contribute to a heightened prevalence of GDM among expectant mothers. Our findings indicate that pregnant women should prioritize FAO supplementation as a preventive measure against GDM. Further research is warranted to inform clinical practice and aid women in reducing the risk of GDM and other associated metabolic diseases.
-
No conflicts of interest.
-
The authors would like to thank all the participants in this study. The authors also thank the health care workers at Haidian Maternal and Child Health Hospital for their assistance with data collection.
HTML
| Citation: |

|