

 Download:


-
Knowledge graphs (KGs) have been widely used in the construction of knowledge bases for search engines since their inception by Google. During the coronavirus disease 2019 (COVID-19) pandemic, KGs have played an important role in areas such as the construction of COVID-19-related knowledge bases (1-2), bibliometrics, drug information management, drug repurposing (3-4), auxiliary diagnosis and treatment, and knowledge surveys. However, their application has been limited in exploring infection paths among cases (5–7) and identifying infection sources.
Tracing transmission paths can help to promptly identify the source of infection, detect high-risk areas that may otherwise be overlooked, and facilitate the identification of key populations, important sites with high infection risk, and possible superspreaders, thus allowing for timely actions to cut off the transmission chain and effectively contain the spread of an outbreak. However, in the face of the current COVID-19 pandemic and possible future pandemics with a huge number of infected cases, it is extremely time-consuming and labor-intensive to conduct epidemiologic investigation, identification, and management of close contacts, thus further limiting the resources allocated to tracing transmission paths and identifying infection sources. It is difficult to manually extract key information and trace infection paths among cases from the vast amount of unstructured textual data in case reports. Therefore, the use of information technology is important to quickly extract demographic and epidemiologic information, infer transmission paths and infection sources, identify key populations and key sites of high risk, and prevent further transmission at the community level.
To improve the effectiveness of epidemiological investigation and facilitate tracing of an infection source, we used natural language processing (NLP) and KG technologies to automatically extract structured data from case reports, determine the infection relationships among cases, trace the sources of infection, and construct a directed KG to identify infection sources using parameters including relationship intensity and transmission intensity.
-
Epidemiological data for COVID-19 cases in two clusters involving severe acute respiratory syndrome coronavirus 2 (SARS-CoV-2) wild-type strain and Alpha variant were obtained from the Beijing Center for Disease Prevention and Control (Beijing CDC). Transmission chains were determined for each cluster by health professionals at the Beijing CDC, which served as the gold standard in the KG model.
-
Using NLP technology, case reports were automatically structured and data were extracted, including sociodemographic characteristics, epidemiologic information, and case relationships. Epidemiologic information included the time of exposure, time of onset, time of first positive nucleic acid test, and time of diagnosis. Case relationships included both clear contacts between cases (e.g., living in the same household, dining together, contacts during medical visits, working or studying in the same room, and traveling in the same vehicle) and unclear contacts, such as being in the same location at the same time. Unclear contacts served as a supplement to clear contacts.
The possibility (intensity) of each edge in the network was calculated using the extracted information. Edges with the highest intensity were preserved in the KG model, which was then presented with three components: 1) name of the infected individual (or individuals); 2) transmission paths (relationships among cases); and 3) intensity of transmission. A preliminary directed KG was constructed using the above data, and the source of infection was identified through pruning and reconstruction of the directed KG (Figure 1).
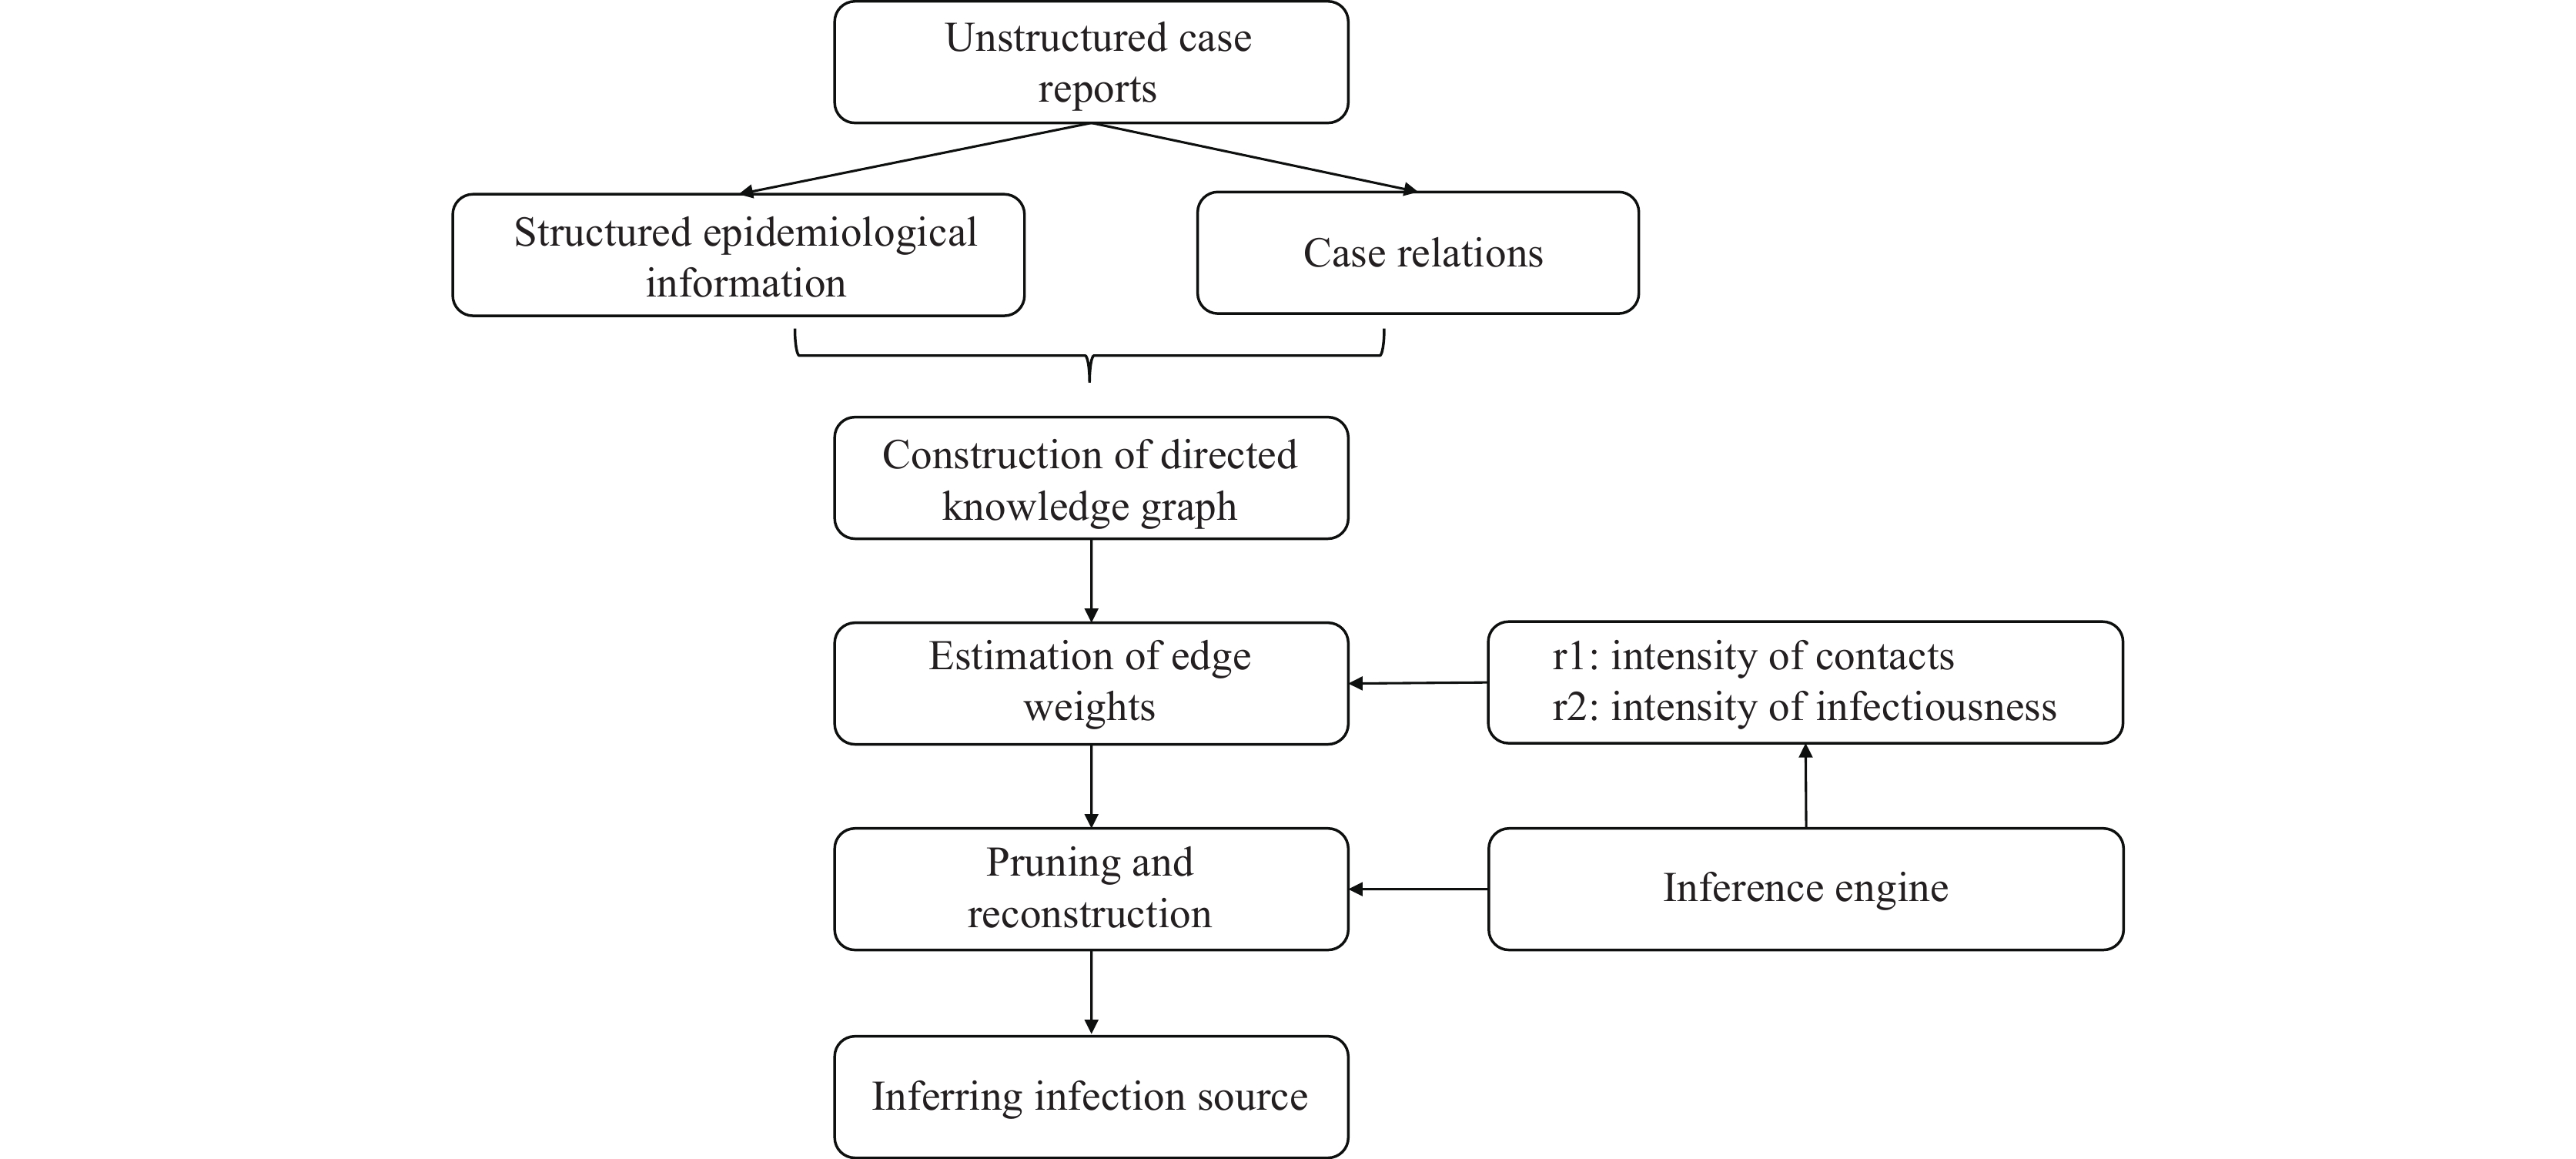 Figure 1.
Flow chart of knowledge graph construction.
Note: This figure depicts the process of knowledge graph construction. Epidemiological information and case relationships were first retrieved from unstructured case reports. This information included cases' sociodemographic characteristics, time of exposure, time of onset, time of first positive nucleic acid test, time of diagnosis, and symptoms. Case relations included clear contacts such as sharing the same household, dining together, contacts during medical visits, working or studying in the same room, and traveling in the same vehicle, as well as unclear contacts such as appearing in the same location at the same time. Edge weights were then inferred based on the intensity of contacts and infectiousness. Finally, pruning was conducted according to the edge weights and inferred infection source. -
The directed KG was constructed in five steps: 1) inferring the viral shedding period of infectors; 2) inferring the infection time of infectees; 3) calculating the transmissibility in each case; 4) tracing the transmission paths between cases; and 5) constructing the directed KG. The details of each step are outlined below.
The viral shedding period of infectors was inferred. We assumed that cases are most contagious two days prior to and five days after symptom onset (8). Therefore, given onset time t, the most highly contagious period would be [t-2, t+5]. The time of the last positive nucleic acid test was denoted as NAT_end. If t+5<NAT_end, the case would still be infectious to a certain extent during the [t+5, NAT_end] time interval.
The infection time of each confirmed case was inferred by tracing the transmission paths among cases. The infection time of each infectee was set as (date of onset – incubation period), which was approximately 3 to 14 days before symptom onset. For asymptomatic cases, the infection time was defined as 3 to 14 days before the first positive nucleic acid test result.
The transmissibility of each case was calculated, assuming that asymptomatic cases are less infectious than symptomatic ones.
Transmission paths among cases were traced and all possible relationships between a case and all other cases were calculated. As a result, multiple relationships may be found between two cases. Unclear contacts were assumed to have a lower probability of causing infection than clear contacts.
A preliminary directed KG was constructed. Based on the transmission paths discovered in the previous steps, a directed KG was constructed with cases as nodes and relationships as edges in the form of A → B. The establishment of edges took time factors into full consideration, i.e., a case with an earlier onset was more likely to be a spreader and the infection time of infectees had to fall within the viral shedding period of the infectors.
-
Given that there may be multiple relationships between two cases in the directed KG, pruning of edges based on their respective weight w was required for construction of the transmission paths:
$$ w = r {\textit{1}} \times r {\textit{2}} \times rp $$ with r1 representing the coefficient for viral shedding, r2 the coefficient for the likelihood of case relationships, rp the individual characteristics, and w the weight of the edges. The edge with the highest w was taken as the most likely relationship between the two cases.
The value of r1 was determined primarily by the time point of exposure to infectors, i.e., how infectious was the infector when the infectee was exposed? Because concrete time points of exposure and viral shedding were difficult to determine, the model classified case infectiousness using three scales where the infectiousness 5 days after symptom onset b > the infectiousness 2 days prior to symptom onset a > other time window c. As a result,
$$ R(t\_start,t\_end) = Rule( {\sum }_{t=t\_start}^{t=t\_end}\frac{sum\left(Patient\right(t\left)\right)}{len\left(Infector\right(t\left)\right)} \text{,}tol) $$ In which, patient (t) represents the whole set of infectees and infector (t) represents the whole set of infectors who have caused secondary cases in t days. Function Rule is the pre-defined infectiousness scale. Here, we defined b=1.3 and a=2c. When the calculated relationship between a, b, and c was larger than tol [for instance, if b> (1.3 + tol) × a or b< (2 − tol) × c], the model would constrain the iteration of a, b, and c until the constraint condition was met.
The value of r2 represents the intensity of the relationships extracted from case reports. The model classifies the intensity of relationships into different categories based on the frequency and duration of contacts. For instance, the transmission likelihood could be assumed to be as follows: living together > working together > dining together > traveling in the same vehicle > living in the same community. The value of r2 was further standardized between 0 and 1.
Compared with symptomatic cases, asymptomatic cases may have a longer incubation period but lower infectiousness. On the basis of the literature, we assumed that the infectiousness of asymptomatic cases was 30% (rp) of the infectiousness of symptomatic cases (9).
By taking the aforementioned steps, preliminary pruning of the directed KG was performed. However, in practice, direct transmission and indirect transmission may coexist between cases. For instance, transmission paths of A → B → C and A → C might both be reasonable. In such a situation, the model would consider both edge weights and case onset dates to determine whether an edge should be pruned or not. Specifically, edges with lower weights were pruned first; if two edges had the same weight, the model would further compare the time points at which the infectee was exposed to the infector. If the time points were the same, no edges would be pruned and all transmission paths would be retained.
The process described above can essentially guarantee that there is only one relationship (edge) between two cases (nodes). However, some nodes may be left on their own. In such cases, the model would select one edge with the highest w value from those pruned to reconstruct a relationship between cases, with the aim of linking as many cases as possible.
-
Depth-first search (DFS) was conducted starting from a random node s and running through all other nodes, generating a list L of all traversed nodes. With DFS performed on all nodes, the starting node S with the longest L was identified as the source of infection. That is, the case with the most comprehensive transmission paths was selected as the infection source.
-
In the knowledge graph generated by the KG model, COVID-19 cases were represented by entities, the transmission paths (relationships) between cases were represented by edges, and infectors’ onset time and viral shedding duration comprised entity attributes. With this structure, a complete knowledge graph with transmission information was generated automatically. To compare the transmission paths between the KG model and professional determination more directly, illustrations were drawn manually in the same style (Figures 2 and 3).
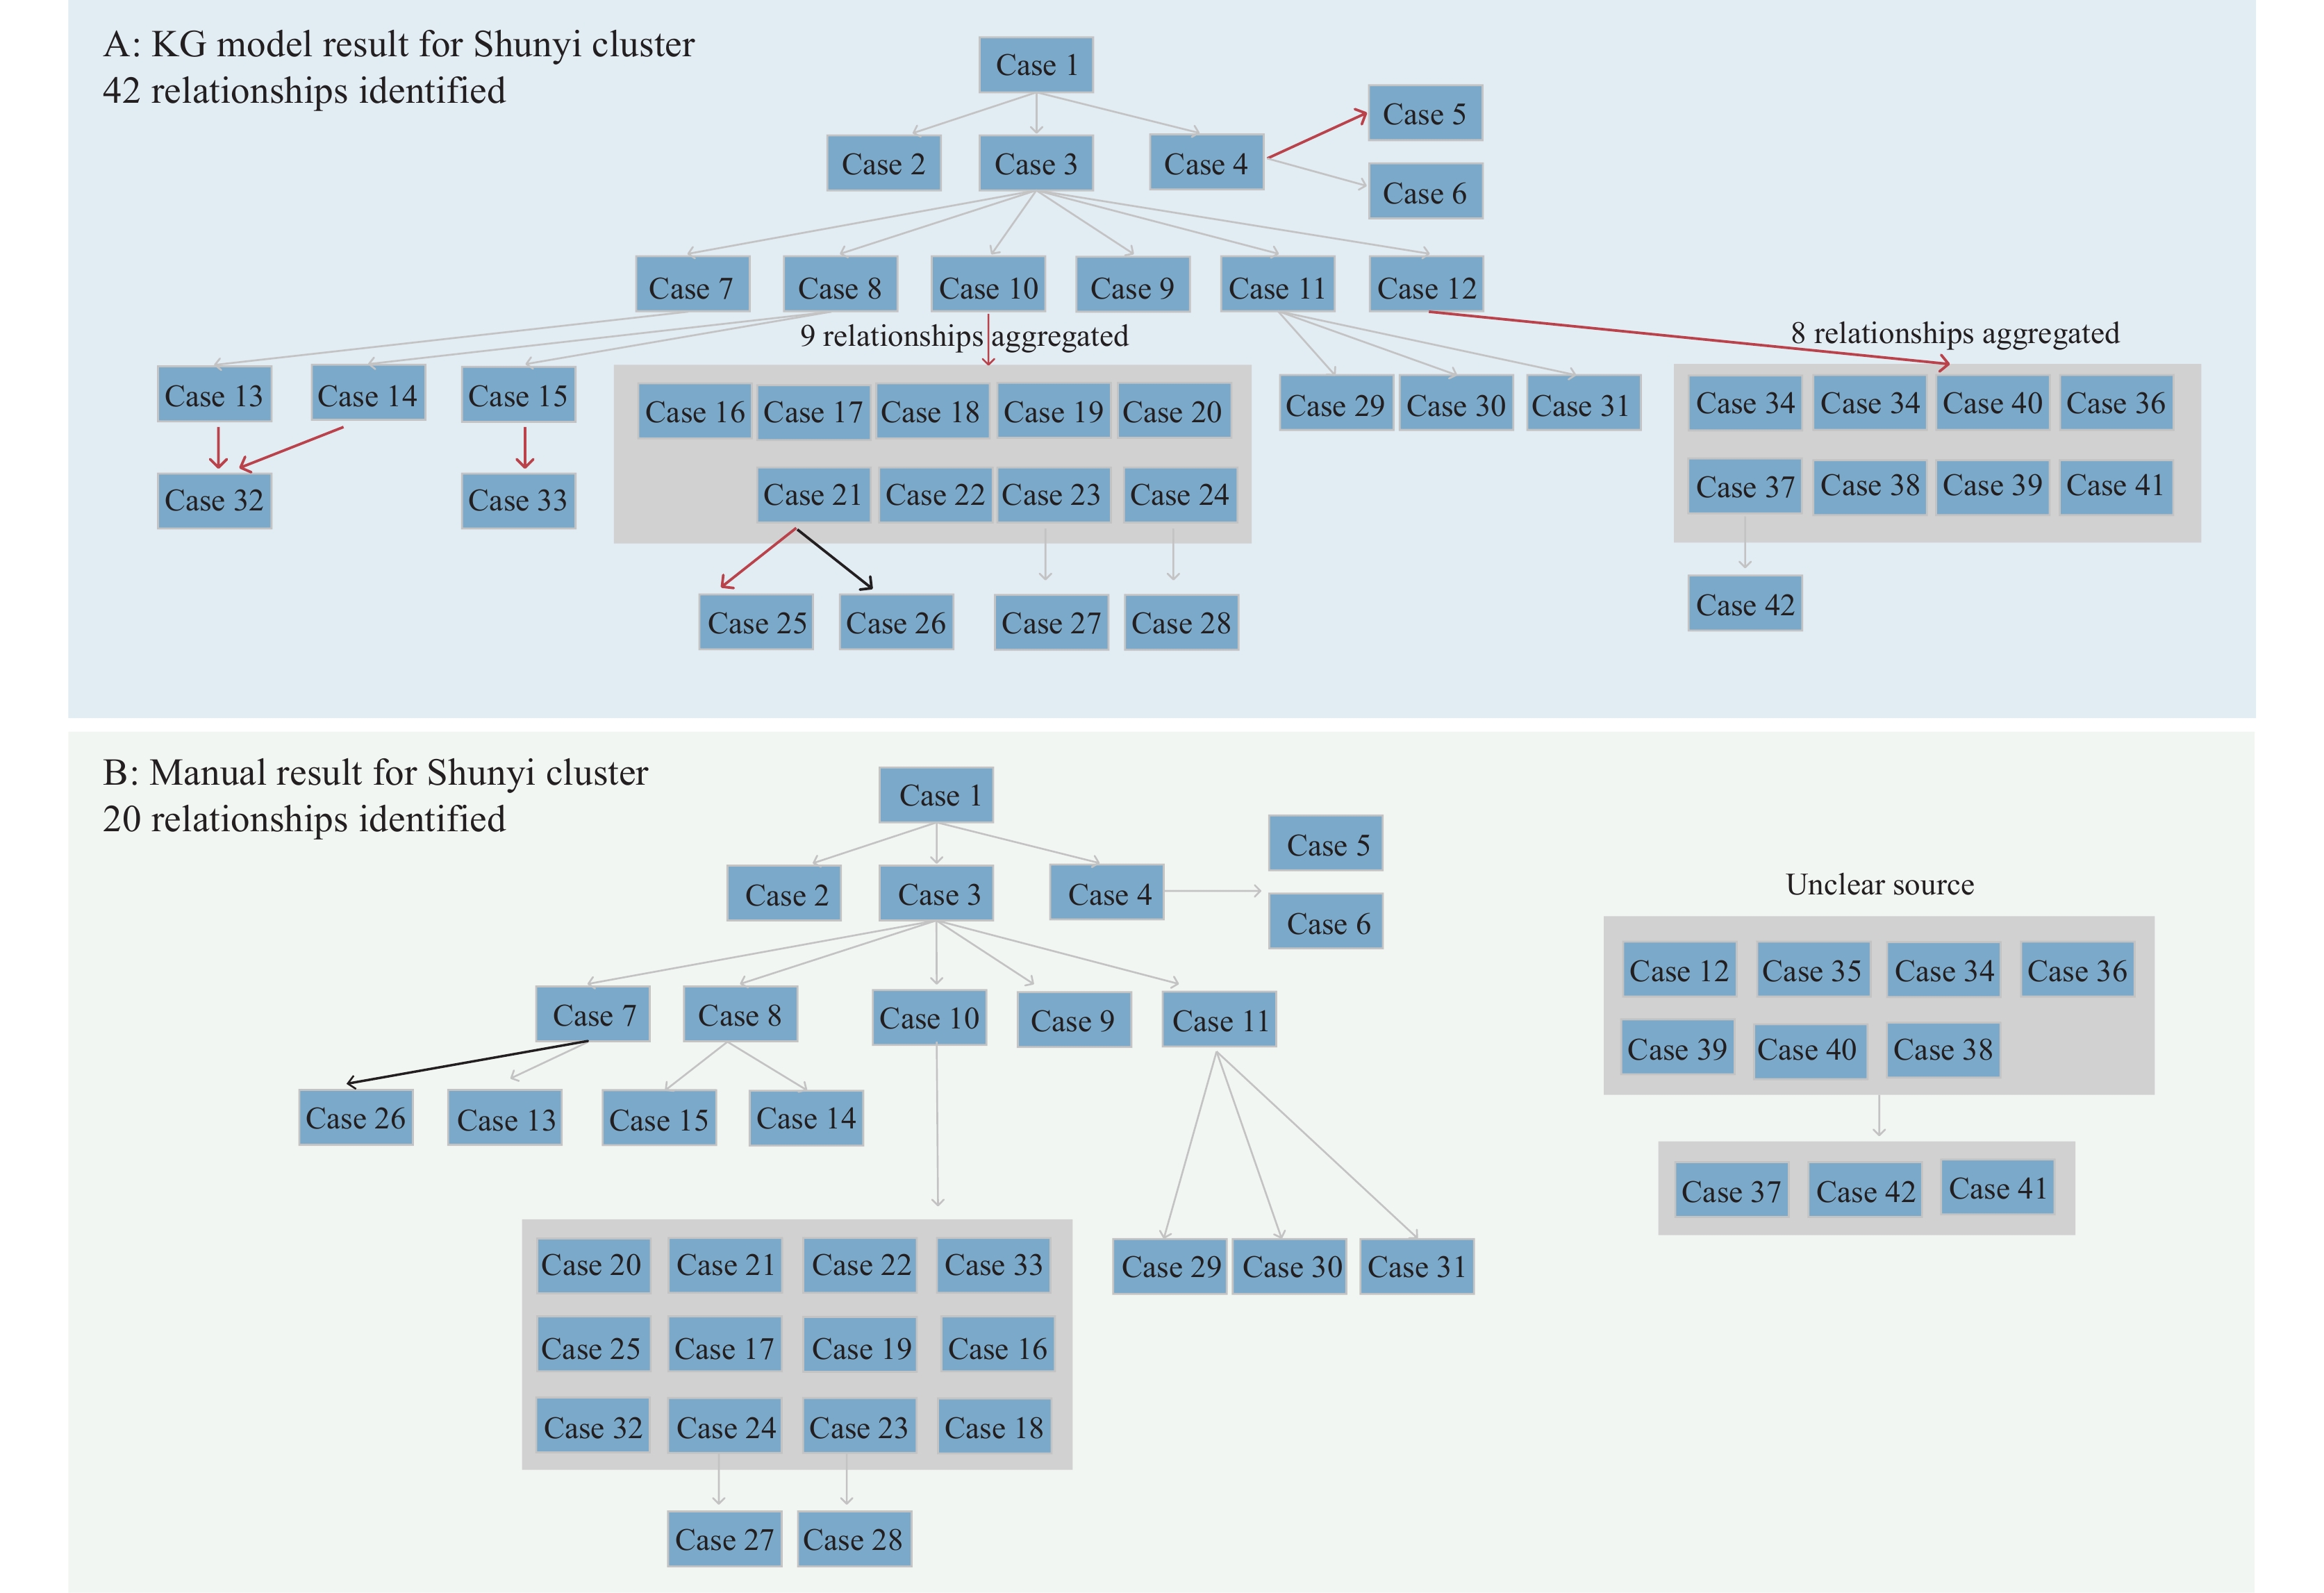 Figure 2.
Transmission paths for Shunyi cluster. (A) A total of 42 relationships were identified in the knowledge graph (KG) model for the Shunyi cluster. (B) A total of 20 relationships were identified by public health professionals for the Shunyi cluster. Sources for Cases 12, 34–36, and 30–40 were unclear and were presented separately.
Note: Red arrows represented additional relationships identified by the KG model; black arrows represented different relationships between the KG model and manual determination; gray arrows represented the same relationships. For illustration purposes, 9 relationships from Case 10 to Case 16–24 were aggregated and presented in a gray square; 8 relationships from Case 12 to Case 34–41 were aggregated and presented in a gray square. The edge weights for Case 13 → Case 32 and Case 14 → Case 32 were the same thus both were kept. Sources for Cases 12, 34–36, and 30–40 were unclear and were presented separately. or illustration purposes, 9 relationships from Case 10 to Case 16–24 were aggregated and presented in a gray square; 8 relationships from Case 12 to Case 34–41 were aggregated and presented in a gray square. The edge weights for Case 13 → Case 32 and Case 14 → Case 32 were the same thus both were kept.
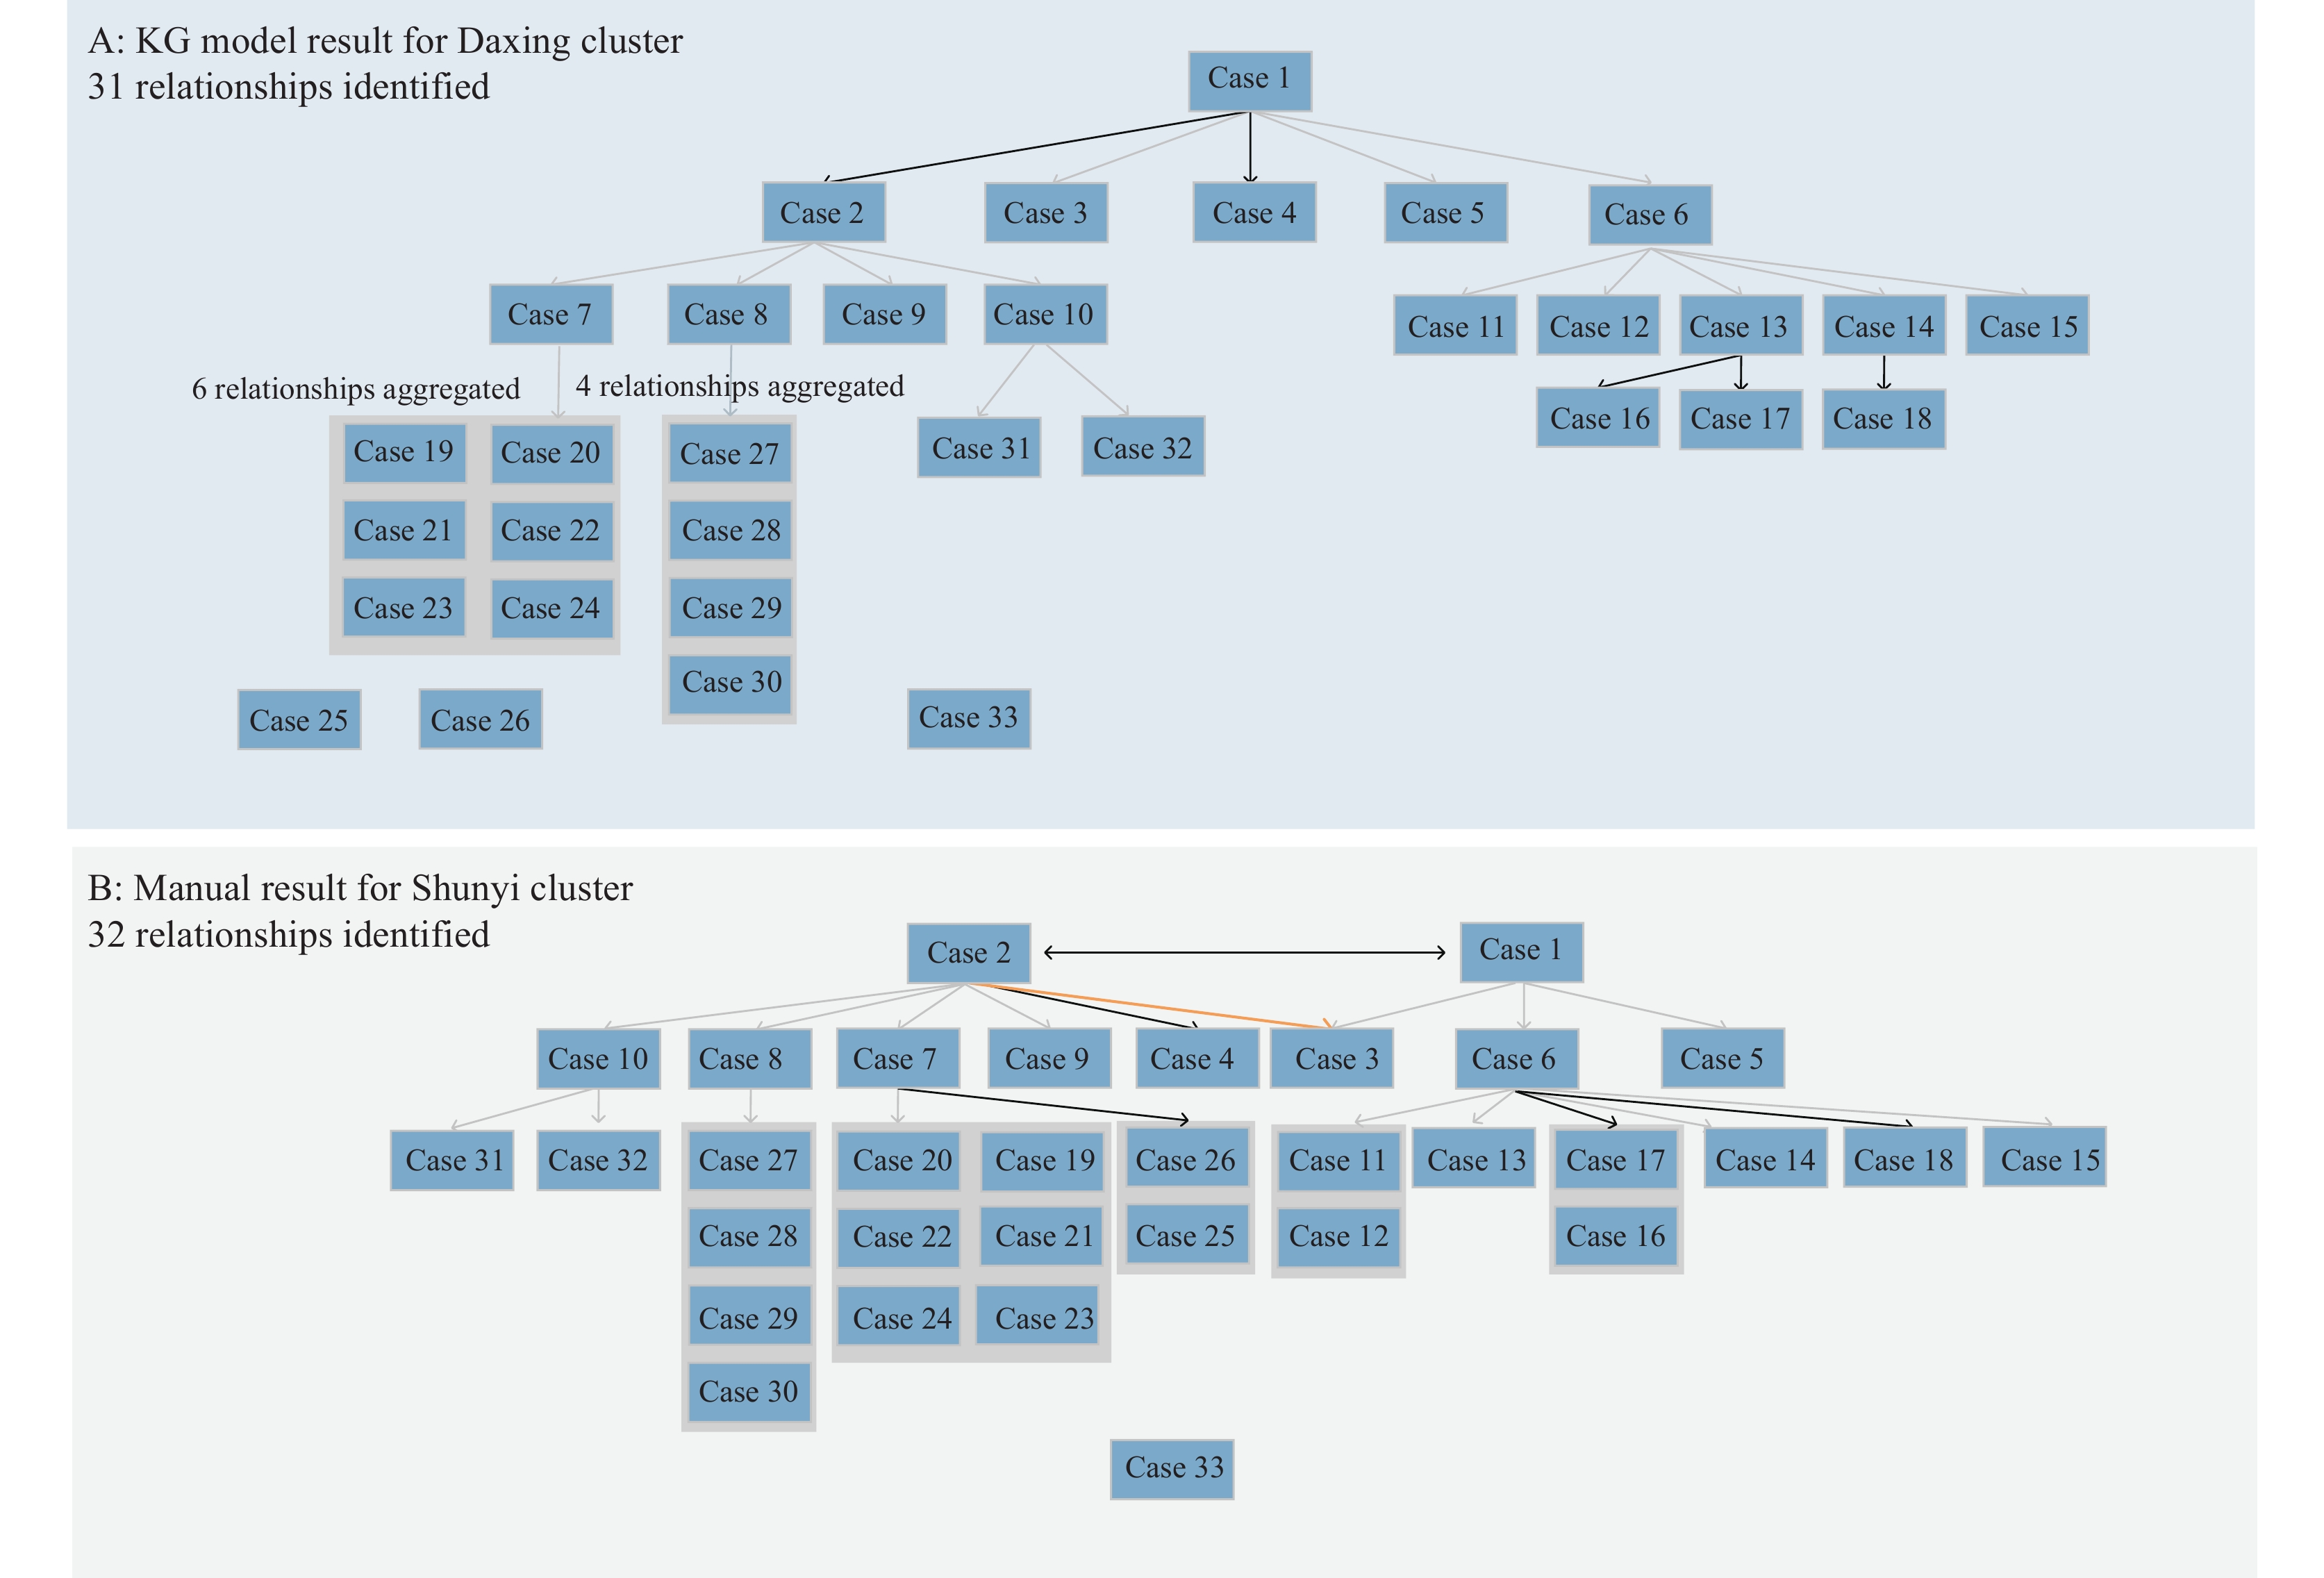 Figure 3.
Transmission paths for Daxing cluster. (A) A total of 31 relationships were identified in the KG model for the Daxing cluster. (B) A total of 32 relationships were identified by public health professionals for the Daxing cluster.
Note: Red arrows indicated additional relationships identified by the KG model; black arrows indicated different relationships between the KG model and manual determination; gray arrows indicated the same relationships; and orange arrows indicated relationships omitted by the KG model. For illustration purposes, 9 relationships from Cases 7 to 21–24 were aggregated, and four relationships from Case 8 to Cases 27–30 were aggregated. The infection source for Case 33 was unclear. For illustration, 4 relationships from Cases 8 to 27–30 were aggregated; 8 relationships from Cases 7 to 19–23 and 25–26 were aggregated; and 4 relationships from Cases 6 to 11–12 and 16–17 were aggregated. The infection source for Case 33 was unclear, while Cases 1 and 2 were both possible sources.
Abbreviation: KG=knowledge graph.
A cluster of COVID-19 cases caused by the wild-type strain of SARS-CoV-2 occurred in Shunyi District, Beijing in 2020, involving a total of 42 cases. Through epidemiological investigation and professional judgment, 20 infection relationships were identified manually. The KG model identified 42 relationships, and an additional 22 relationships were found to be possible after one-by-one deduction, which could serve as an important supplement in the judgment of the epidemic's development. One relationship was different between the KG model and manual determination, but both were found to be possible (Figure 2).
An outbreak of the SARS-CoV-2 Alpha variant occurred in Daxing District, Beijing in 2021, involving 33 cases in total. Manual tracing identified 32 relationships, while the KG model identified 31. Of these, 24 edges were the same as those traced manually, 7 were different, and 1 edge was omitted. In manual deduction, both infection paths were deemed possible; thus, both were preserved, while the KG model only kept the most likely infection path and pruned the other. Among the seven edges, five were related to the identification of index cases in households. The model suggested that, compared to family member B, family member A had a greater likelihood of introducing the virus into the household. The other two edges were identified after a detailed analysis of case reports (Figure 3).
-
The KG model described herein was able to automatically extract data from unstructured text in epidemiologic case reports and sort out complex infection relationships. A directed KG that depicted the identified case relationships and infection sources was successfully constructed through a detailed pruning and reconstruction process. We tested the KG model using two actual COVID-19 outbreaks that occurred in Beijing, China, and the model was proven effective in targeting the infection source.
Using the KG model to deduce transmission pathways, “Case Zero” can be quickly identified, allowing the government to direct limited resources and determine the possible infection source (6). Furthermore, the KG model can be used to identify key transmission sites and key spreaders, which can then inform the detection of populations at higher risk, improve the efficiency of case screening, and help contain the spread of an outbreak in a timely manner. Additionally, a focused investigation could be organized for lonely nodes in the KG (i.e., cases whose transmission paths were not clear) to identify hidden infection sources in a timely fashion. This could help to quickly review the overall epidemic prevention and control direction and address potential issues rapidly, thus avoiding worsening of a current outbreak and preventing future outbreaks. Although the prevention and control strategy for COVID-19 has changed substantially, the KG technology presented in this paper could still enrich the current toolbox of public health countermeasures and offer insights for future epidemics caused by other emerging or existing infectious diseases.
This study has some limitations. First, the KG model is a tool for analyzing infection sources, and its performance is largely affected by the completeness of epidemiological case reports. To be used in future epidemics, essential information from case reports must be clarified in advance. Second, this model was tested in small outbreaks, with good performance; however, the model requires further validation in larger outbreaks.
-
No conflicts of interest.
-
All health professionals fighting against COVID-19, especially our colleagues in Beijing Center for Disease Prevention and Control.
HTML
Study Design
KG Model Framework
Preliminary Construction of Directed Knowledge Graph
Pruning and Reconstruction of Directed Knowledge Graph


Identifying the Source of Infection
| Citation: |

|