-
Lead (Pb) and cadmium (Cd) are heavy metal pollutants that are widespread in the environment. Pb mainly damages nervous systems and particularly impacts children’s cognitive ability and intelligence. Cd causes damage to multiple body systems and was identified as a human carcinogen by the International Agency for Research on Cancer (1). The dietary intakes of Pb and Cd have always been a major concern in the world.
Since 1990, China has conducted six Total Diet Studies (TDSs) to evaluate the dietary intake of various chemical substances and to assess the related health risks among Chinese population. The samples of this study were collected from the Sixth China TDS during 2016−2019. The dietary survey methods, sample collection, and processing methods are referenced in the Foreword of this special issue (2). The health risks of Pb intake were assessed using the margin of exposure (MOE) approach and that of Cd intake was assessed based on the provisional tolerable monthly intake (PTMI).
The levels of Pb and Cd in the food samples were determined by inductively coupled plasma mass spectrometry (ICP-MS). The limits of detection (LOD) of Pb and Cd determination were 0.08 μg/kg and 0.05 μg/kg, respectively. Data below the LOD was processed using the methods recommended by the World Health Organization (WHO) (3).
The point estimate method was used to calculate the dietary intake of Pb and Cd and the contribution rate of various diets. In 2010, the provisional tolerable weekly intake (PTWI) value for Pb was withdrawn in the 73rd meeting of the Joint Food and Agriculture Organization of the United Nations (FAO)/WHO Expert Committee on Food Additives (JECFA). According to the evaluation results from JECFA, there is currently no health guidance threshold that can be established for Pb. A margin of exposure (MOE) approach was initially recommended by the European Food Safety Authority (EFSA) to assess the risk caused by substances that were both genotoxic and carcinogenic. For adults, Pb exposure of 1.2 µg/kg body weight per day will lead to an increase of 1 mmHg in systolic blood pressure (4). In this study, the benchmark dose level (BMDL0.1) of 1.2 µg/kg body weight per day was used for calculation. When the MOE value was greater than one, it indicated that the health risk of the current intake level was acceptable. In terms of Cd, the PTWI value was replaced by PTMI value at the 73rd JECFA meeting because long-term Cd exposure poses a great threat to health and deserves more attention (5). Therefore, the health risk of dietary exposure to Cd was assessed based on the PTMI of 25 μg/kg body weight per month.
Of all composite samples from 24 provincial-level administrative divisions (PLADs) analyzed, 99.3% had detectable residues of Pb and 88.9% had detectable residues of Cd. Table 1 lists the national mean levels and ranges of Pb and Cd in 12 food categories. Foods with the highest mean Pb levels include vegetables (15.7 µg/kg), aquatic foods (14.1 µg/kg), legumes (12.9 µg/kg), cereals (11.9 µg/kg), and potatoes (11.2 µg/kg). Foods with the highest mean Cd levels include aquatic foods (16.9 µg/kg), legumes (16.8 µg/kg), cereals (14.5 µg/kg), vegetables (12.5 µg/kg), and potatoes (11.1 µg/kg).
Food category Lead Cadmium Detection rate (%) Mean Min Max Detection rate (%) Mean Min Max Cereals 100 11.9±20.6 1.2 47.6 100 14.5±33.5 3.0 83.2 Legumes 100 12.9±15.5 4.7 34.9 100 16.8±18.5 4.5 41.9 Potatoes 100 11.2±16.2 0.4 35.5 100 11.1±14.4 2.3 30.8 Meats 100 10.3±15.3 1.3 28.9 100 2.4±3.7 0.6 8.1 Eggs 95.8 9.7±12.4 <LOD 25.3 100 1.1±4.0 0.1 9.0 Aquatic foods 100 14.1±19.4 2.2 37.4 100 16.9±46.3 0.9 83.8 Dairy products 95.8 1.6±2.6 <LOD 4.8 50.0 0.1±0.5 <LOD 0.9 Vegetables 100 15.7±24.4 3.6 54.0 100 12.5±19.1 2.9 46.6 Fruits 100 5.0±8.6 0.3 19.1 100 0.9±1.7 0.3 4.3 Sugar 100 9.7±30.4 0.4 75.0 100 3.4±19.5 0.1 49.0 Beverages & water 100 1.9±2.7 0.2 5.7 50.0 0.1±0.4 <LOD 0.9 Alcohol 100 1.9±3.4 0.1 7.1 66.7 0.35±1.3 <LOD 2.9 Note: When calculating the median/mean, the results below the LOD were set to 1/2 LOD.
Abbreviations: TDS=total diet study; LOD=limit of detection.Table 1. The descriptive statistics of lead and cadmium from the Sixth China TDS, 2016–2019 (μg/kg).
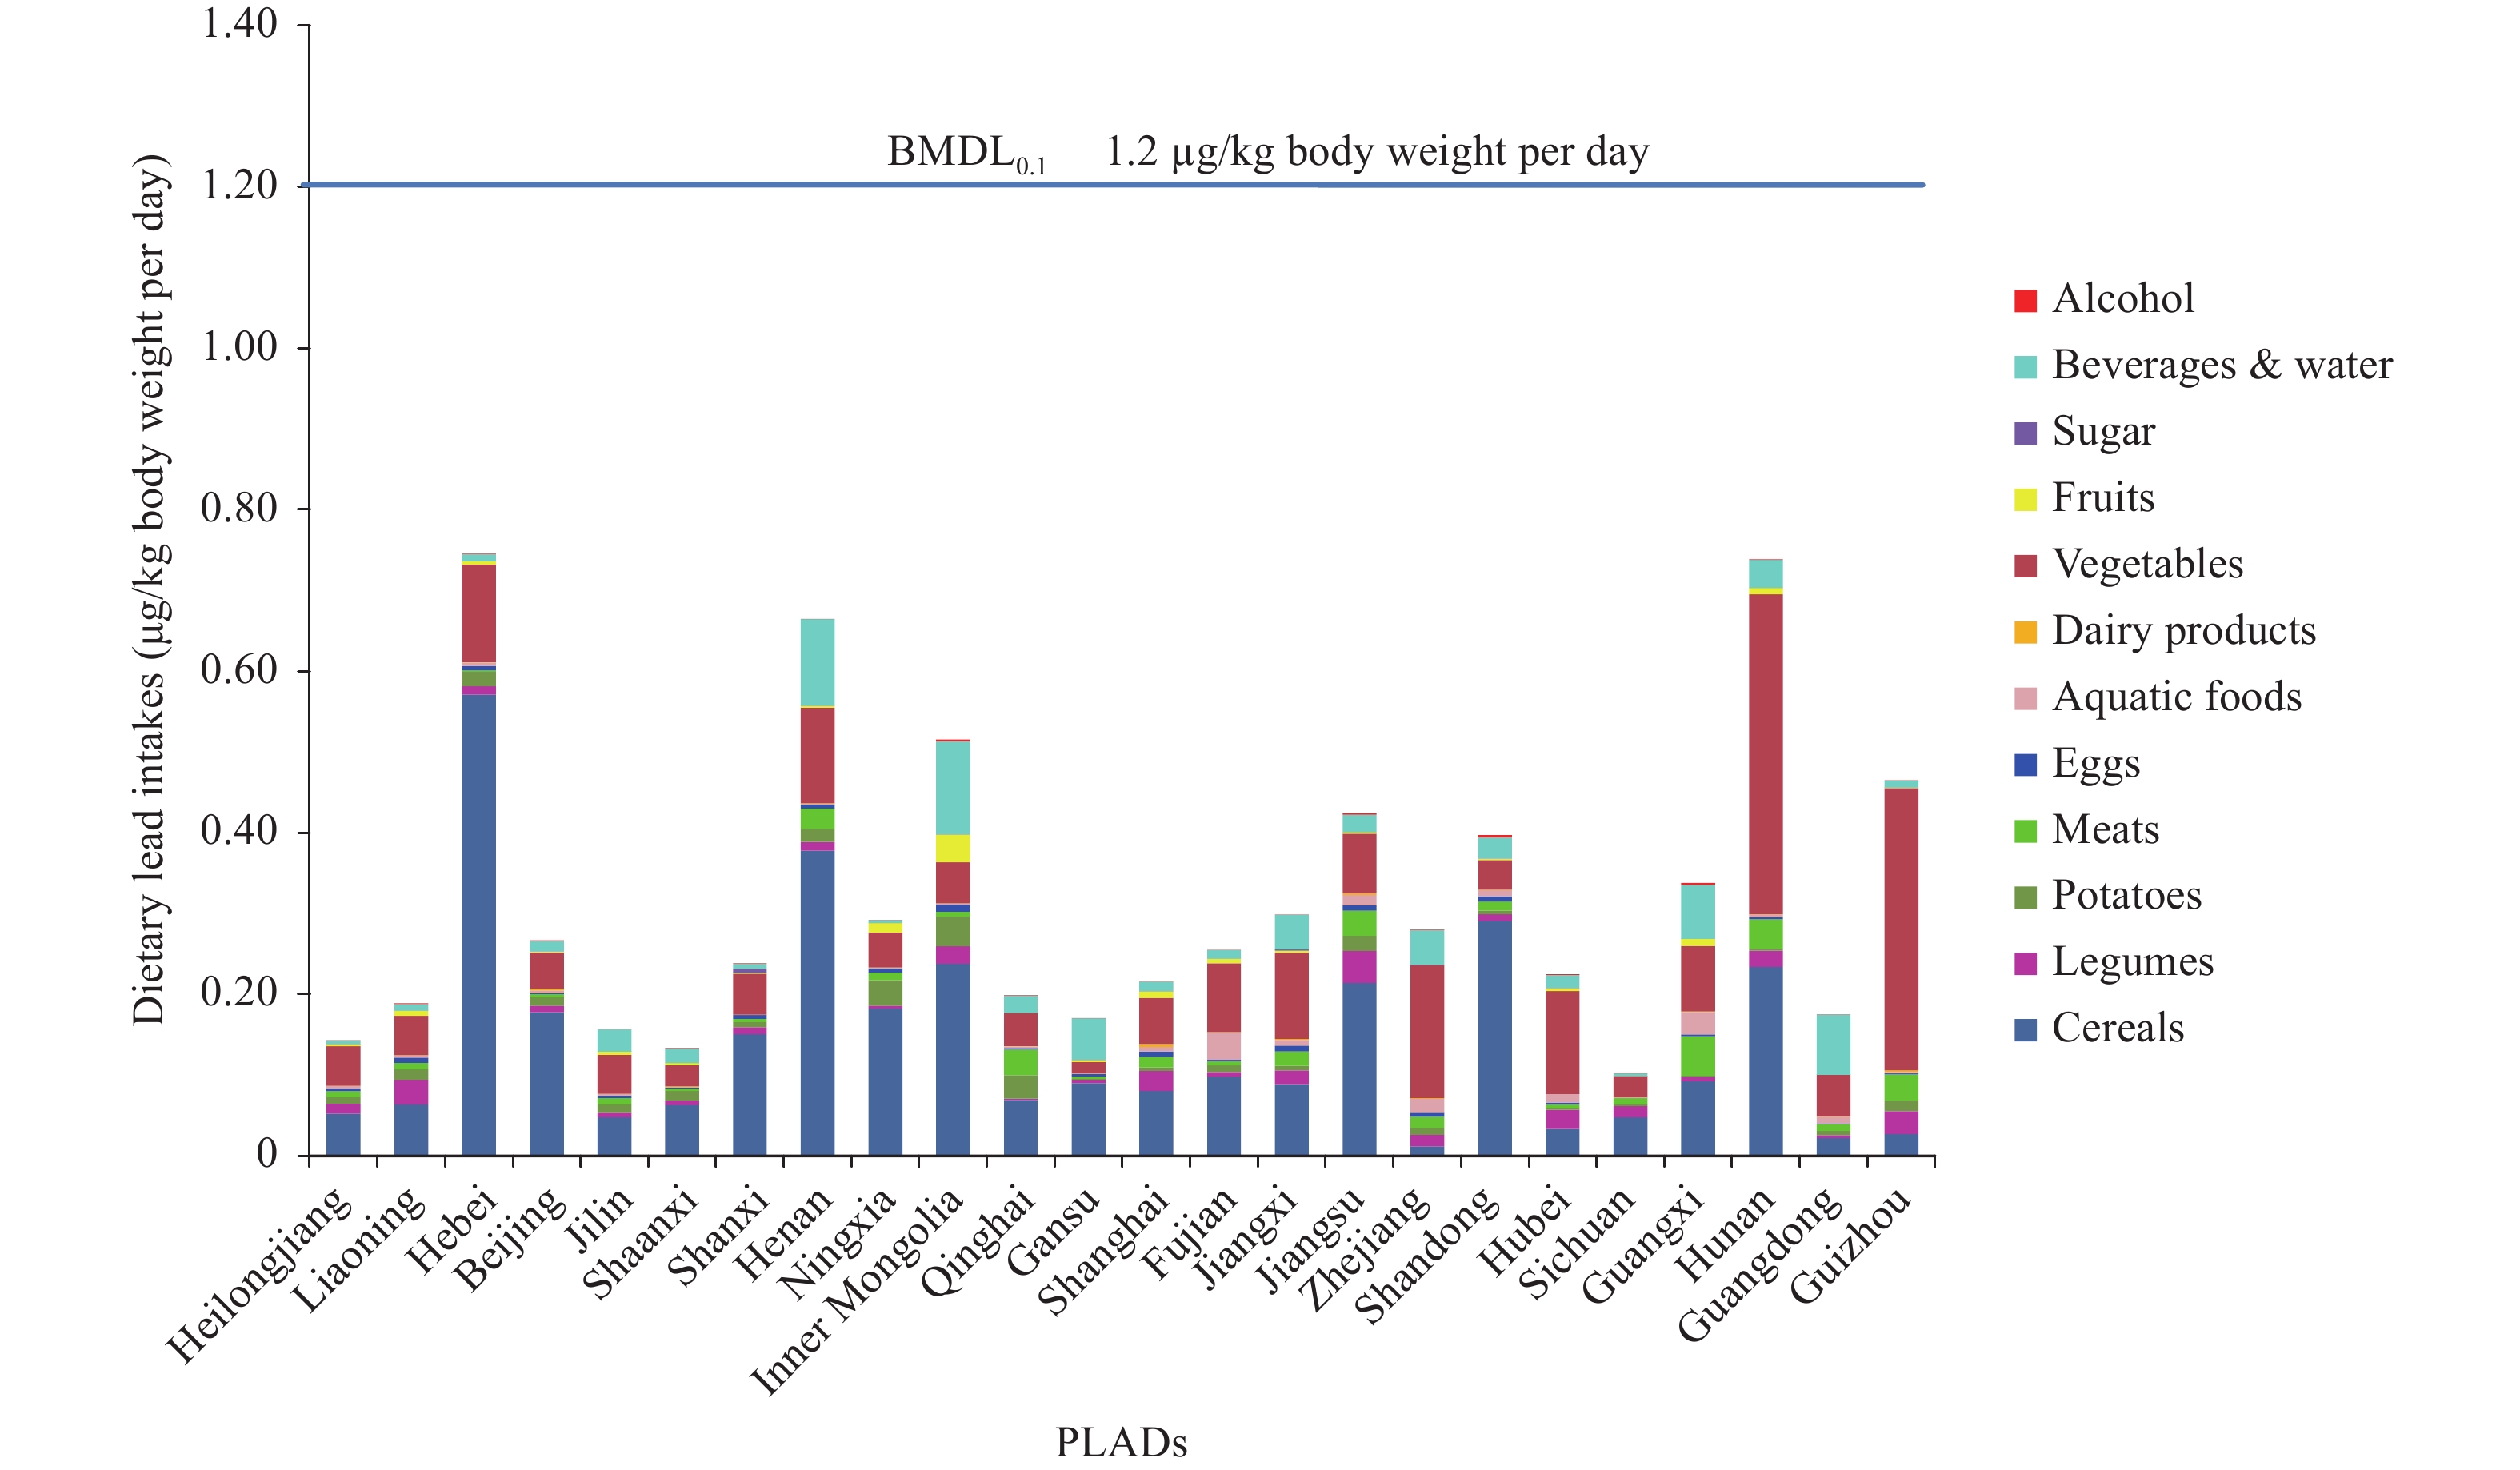
The mean dietary Pb intake for Chinese adult male was 0.318 µg/kg body weight per day, ranging from 0.103 µg/kg body weight per day to 0.746 µg/kg body weight per day in 24 PLADs. The mean Pb intake in northern regions and southern regions were 0.326 µg/kg body weight per day and 0.310 µg/kg body weight per day, respectively. Dietary intake of Pb from 12 food categories for adult males in 24 PLADs from the Sixth China TDS was shown in Figure 1. The top 3 dietary sources of Pb were cereals (43.5%), vegetables (29.0%), and beverages and water (9.8%). The MOE value for the dietary exposure to Pb among adult male in 24 PLADs ranged from 1.6 to 11.7.
 Figure 1.
Dietary intake of lead for adult male in 24 PLADs from the Sixth China TDS, 2016–2019.
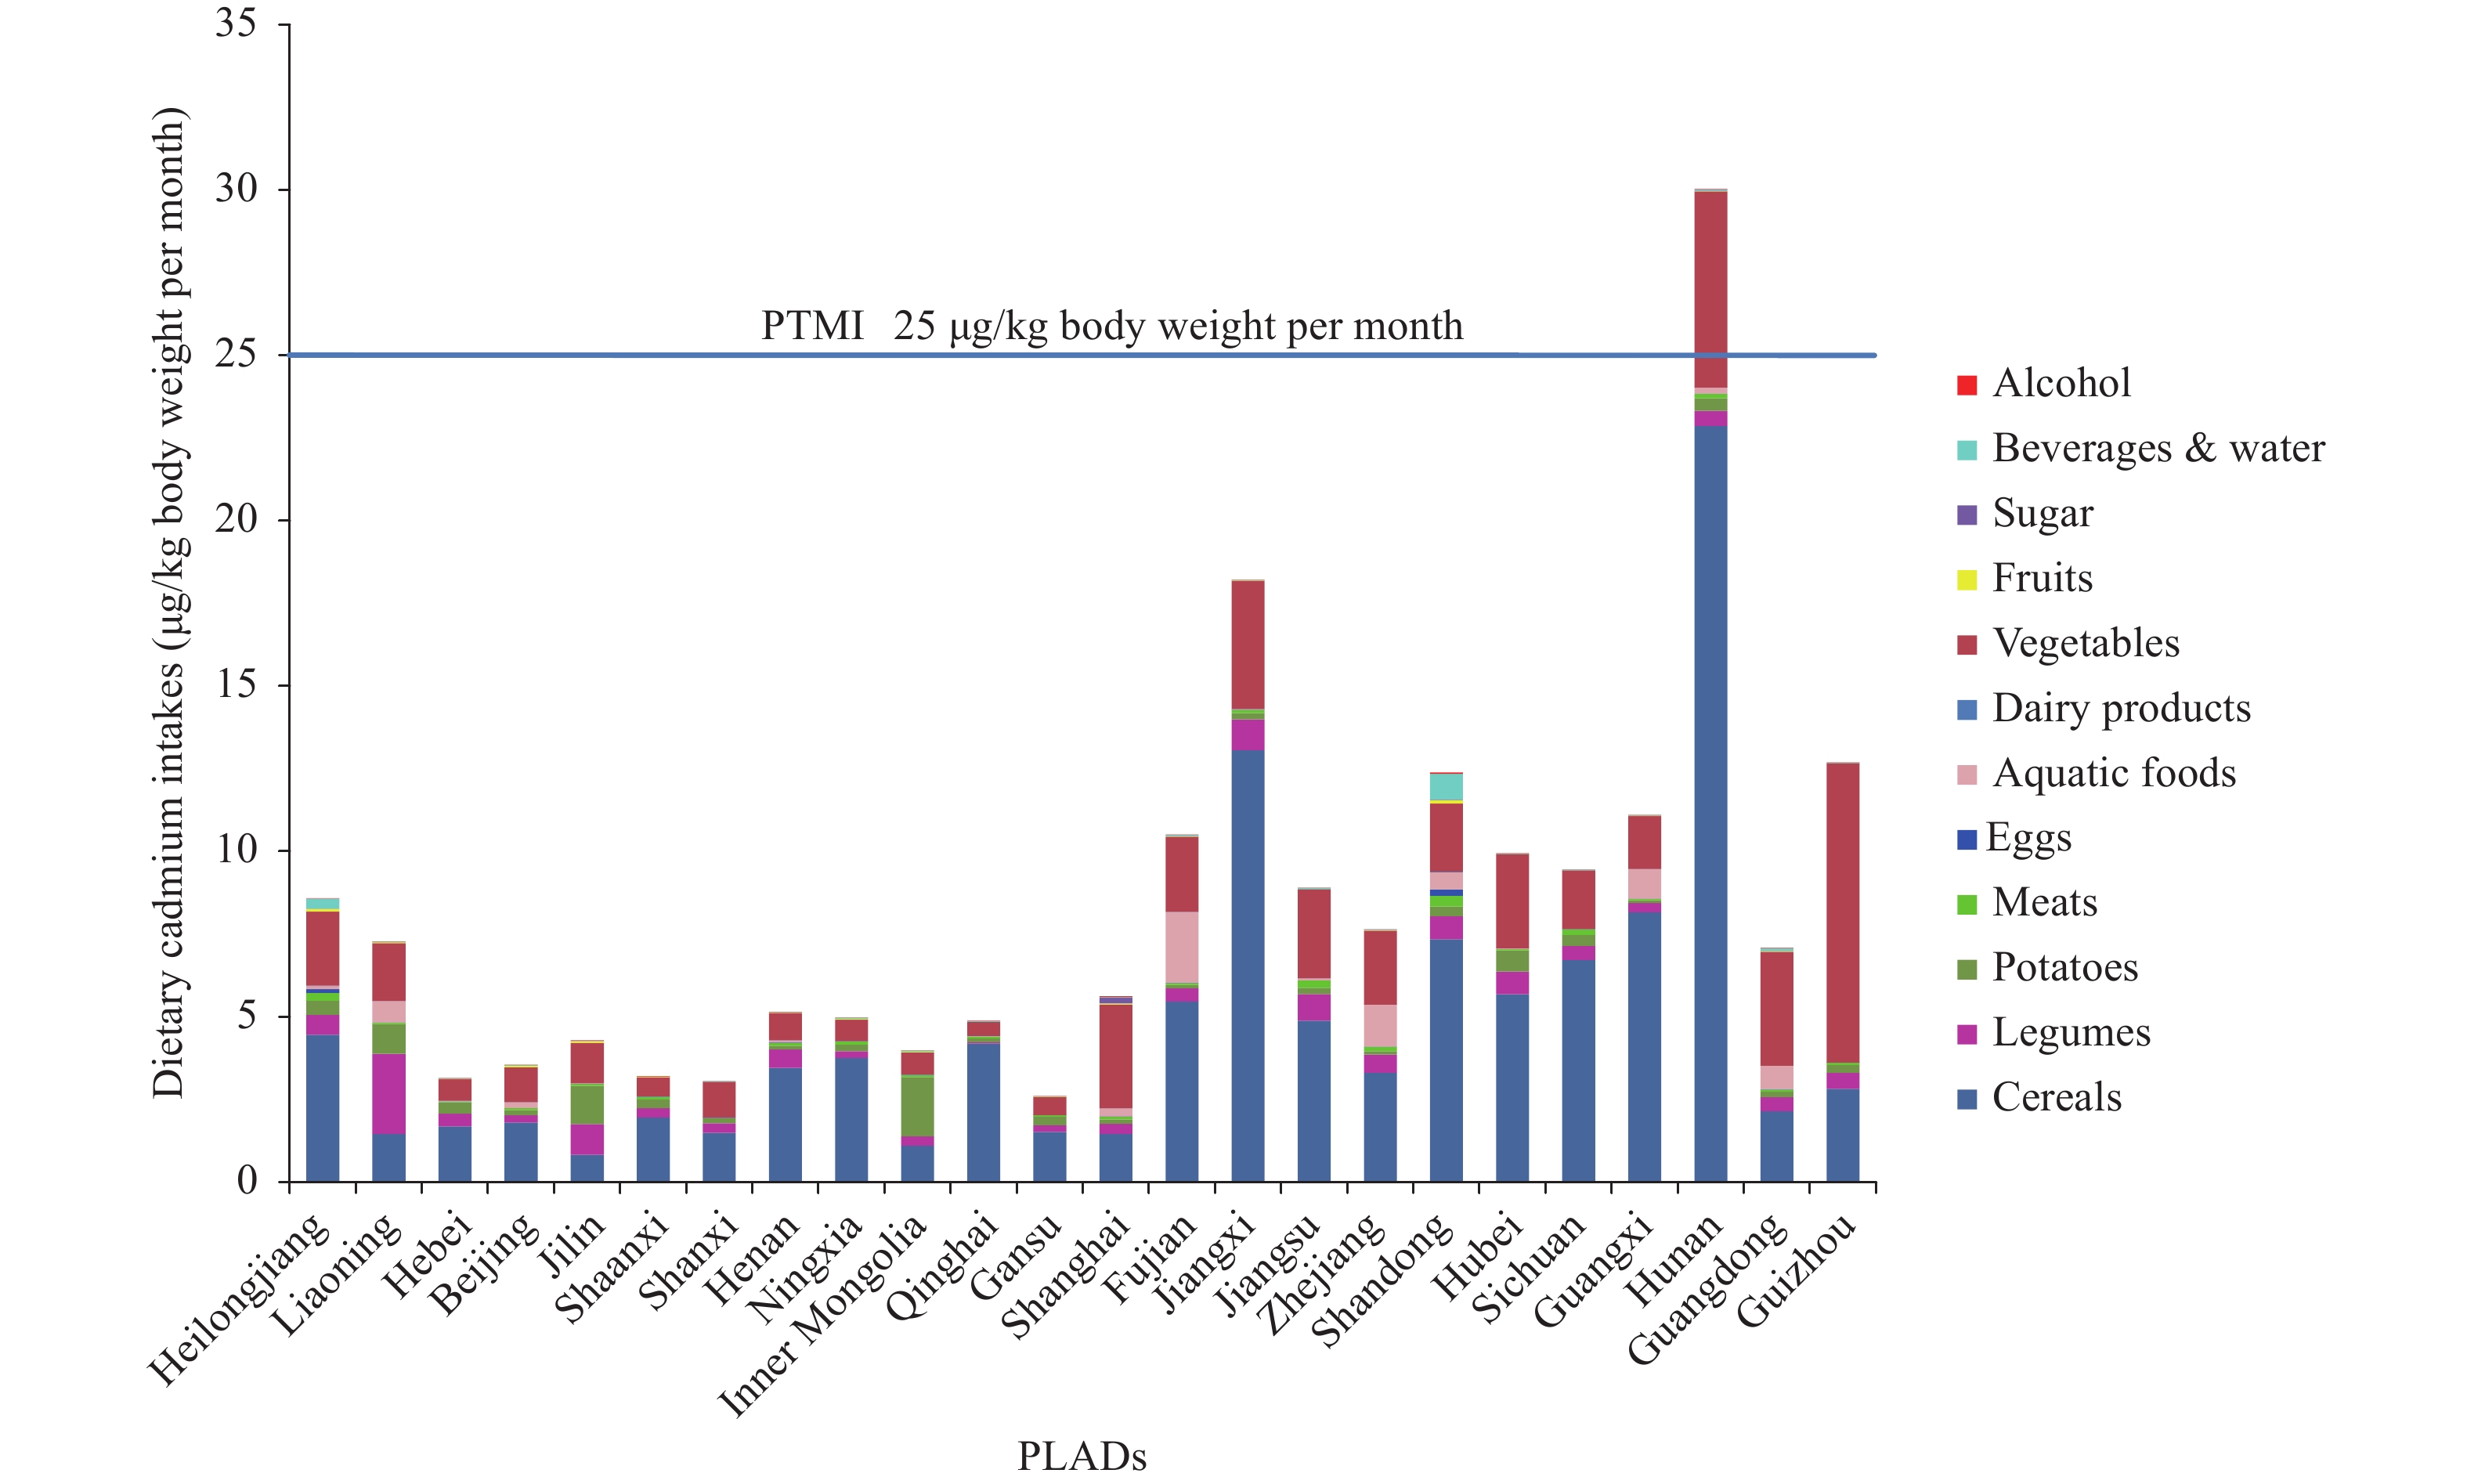
Abbreviations: BMDL=benchmark dose level; TDS=total diet study; PLADs=provincial-level administrative divisions.The mean Cd intake for Chinese adult males was 8.26 µg/kg body weight per month (2.60–30.02 µg/kg body weight per month). The mean dietary Cd intakes in southern regions and northern regions were 11.96 µg/kg body weight per month and 4.55 µg/kg body weight per month, respectively. Figure 2 showed the dietary intake of Cd from 12 food categories in 24 PLADs from the Sixth China TDS. The main contributors to Cd intake were cereals and vegetables (56.3% and 26.6%, respectively). The national mean intake of Cd was 33.0% of the PTMI, and the dietary intake of Cd in 24 PLADs ranged between 10.4% and 120% of the PTMI. Only the Cd intake of adult males in Hunan Province (120% PTMI) exceeded the PTMI.
-
The levels of Pb and Cd in all the dietary samples in Sixth China TDS were lower than the China General Standard for Contaminants in Foods (GB 2762–2017). The dietary Pb intake levels were similar in northern and southern regions, but the sources of dietary Pb intake were different. The contribution of cereals to lead intake in the southern region was similar to that of vegetables (31% and 37.1%, respectively). While in the northern region, the contribution of cereals (50.6%) was higher than that of vegetables (19.7%). Although Pb levels in beverages and water were low, but the consumption of beverages and water was large. As a result, the national mean contribution rate of beverages and water reached 9.8%. The estimated MOE values were all above 1 for adult males of 24 PLADs, indicating that the risk of dietary exposure to Pb among Chinese adult male was at a safe level.
The dietary Cd intake was significantly higher in the southern region (11.96 µg/kg body weight per month) than in the northern region (4.55 µg/kg body weight per month). There were three possible reasons: 1) the mean Cd levels in many foods were higher in the south than that in the north; 2) the consumption of vegetables was significantly higher in the southern region than that in the northern region (397.8 g/d vs. 297.3 g/d) and vegetables were one of the main sources of Cd intake; or 3) southern and northern regions had different dietary habits. Rice is the main staple food in the south while wheat flour is the main staple food in the north, and rice had higher levels of Cd than flour. For adult males from Hunan Province, cereals contributed up to 76% of the dietary Cd intake. Cereals from Hunan Province contained the highest Cd level among all cereals from the 24 PLADs (83.17 μg/kg; 5.8 times the national mean cereal Cd level of 14.45 μg/kg), which could be a potential health risk to adult males in that region.
Since 1990, China has conducted 6 China TDSs (6-10). Supplementary Figure S1 shows that dietary Pb intake remained relatively stable during the first three TDSs, and gradually decreased during the latter three TDSs. The dietary Cd intake presented a slight increasing trend from the First TDS to the Fifth TDS, while a significant decrease of 47% (compared with the Fifth TDS) was observed in the Sixth TDS. This was likely due to China’s efforts in controlling environmental pollution during recent years. However, compared to other countries (Supplementary Table S1), Pb and Cd intakes remained at relatively high levels, which was concerning.
There were some limitations in this study. The current exposure assessment was conducted based on the consumption pattern of Chinese adults and did not involve that of infants and young children.
The present study revealed that the risks of dietary exposure to Pb and Cd among Chinese adult male were generally low, except for the risk of Cd exposure in Hunan Province. Since it is difficult to establish a safety threshold for Pb, JECFA recommended that countries should try to reduce Pb intake to as little as possible. It is necessary to continuously monitor the levels of Pb and Cd in foods to ensure the food safety and health of Chinese population.
-
The 24 provincial-level CDCs.
-
The authors declare that there are no conflicts of interest.
HTML
| Citation: |


 Download:


