
 Download:


-
High blood pressure (BP) is the leading risk factor for cardiovascular disease (CVD) in China. Previous studies from either lowly or highly polluted regions have revealed that increased fine particulate matter (particles with aerodynamic diameter ≤2.5 µm; PM2.5) exposure was associated with elevated BP levels and higher risk of hypertension (1). In recent years, using personal portable devices to record individual PM2.5 exposure and ambulatory BP monitoring (ABPM) to measure BP levels periodically, panel studies also identified the relationship of short-term PM2.5 exposure with hourly, 24-hour, daytime, and nighttime average BP levels (2-3). However, few studies assessed the adverse impacts of PM2.5 with other ABPM indicators, such as BP variability, circadian rhythm of BP, and BP load, and the modifying effects of BP control status and antihypertensive therapy were also unclear. To clarify these issues, these associations were assessed using a multicity and municipality panel study conducted from 2017 to 2019 in China. BP levels and BP load elevation were associated with short-term PM2.5 exposure. Further stratified analyses demonstrated that the adverse impacts of PM2.5 on BP variability, circadian rhythm of BP, and BP load were attenuated among patients with well-controlled BP or taking angiotensin receptor blockers (ARBs), which provided hints about the prevention of PM2.5-related adverse outcomes.
This study used data from a three-phase (winter, summer, spring/autumn) panel study conducted in Beijing, Shanghai, Wuhan, and Xi’an from 2017 to 2019. This panel study recruited participants at intermediate-to-high risk of CVD who were defined as having prehypertension or hypertension combined with at least 1 of the 3 conditions (i.e., central obesity, diabetes mellitus, and dyslipidemia) from the community (2). Questionnaires were administrated to collect demographic characteristics, lifestyle and risk factors, medication uses, etc. Each participant carried a portable monitor to measure real-time individual PM2.5 from the first day to the third day during each phase, and a 24-hour ABPM was scheduled on the third day. This study was approved by the Institutional Review Board of Fuwai Hospital in Beijing, and written informed consent was obtained from all participants before data collection.
This study assessed the association of short-term PM2.5 exposure with several ABPM indicators, including 24-hour, daytime, and nighttime average systolic BP (SBP) and diastolic BP (DBP), SBP and DBP variability (i.e., the standard deviation of BP), SBP and DBP load [i.e. the percentage of the counts for BP readings beyond certain threshold (130/80 mmHg, 135/85 mmHg, and 120/70 mmHg for 24-hour, daytime and nighttime, respectively)], and the percentage of nocturnal BP decline [i.e., (daytime BP-nighttime BP)/daytime BP×100%]. In addition, three methods were used to calculate morning BP surge, including morning BP (i.e., the average BP during the first 2 hours after waking), pre-waking BP surge (i.e., the mean BP during the 2 hours after waking minus the mean BP during the 2 hours before waking), and sleep-trough BP surge (the mean BP during the 2 hours after waking minus the mean BP of the lowest BP and the BP before and after the lowest one during sleeping). The exposure windows of PM2.5 included the concurrent day with ABPM (lag0d), lag 1 day (lag1d), lag 2 days (lag2d), and moving average of previous 2 days (MA2d). Estimated changes and 95% confidence intervals (CIs) with per interquartile range (IQR) increment of PM2.5 exposure (41.96 μg/m3) were calculated using a mixed linear model adjusted for age, gender, current alcohol drinking status, ideal level of physical activity, body mass index (BMI), antihypertensive medication uses, diabetes mellitus, dyslipidemia, and natural splines with 3 degrees of freedom for the daily average of personal environmental temperature and relative humidity at the same exposure windows as PM2.5. City-specific and subject-specific random intercepts were used to account for the variations in different cities and within-subjects correlations. Stratified analysis of BP control status (hypertensive patients with SBP/DBP of less than 140/90 mmHg were defined as individuals with controlled BP, otherwise as uncontrolled BP), and for those with uncontrolled BP, a further stratified analysis of ARB uses was conducted. Z tests were conducted to explore the group difference. All analyses were performed using the SAS software (version 9.4; SAS Institute, Cary, NC, USA). A 2-side P of <0.05 was demonstrated statistical significance.
After excluding participants attending only one visit, those missing ABPM data or not fulfilling the valid criteria of ABPM data and prehypertensive patients, a total of 277 hypertensive patients with 802 visits were included for analysis. At baseline, the average age was 59.1±8.5 years and 113 (40.8%) participants were men. The mean office SBP and DBP were 134.5 mmHg and 80.4 mmHg, respectively. Overall, 91.7% patients were taking antihypertensive medications, with 33.2% being taking ARBs (Table 1). Across the three phases, a total of 557 (69.5%) visits reached well-controlled BP status. Among those without controlled BP, 65 (26.5%) visits had been taking ARBs. Generally, short-term PM2.5 exposure was associated with BP levels and BP load; for example, the 24-hour, daytime, and nighttime average SBP increased by 0.68 mmHg (95% CI: 0.07–1.29), 0.82 mmHg (95% CI: 0.19–1.45) and 0.93 mmHg (95% CI: 0.17–1.70) per IQR increment of the lag2d PM2.5 concentration (Figure 1A). The 24-hour SBP load and DBP load increased by 1.28% (95% CI: 0.01%–2.56%) and 1.38% (95% CI: 0.22%–2.54%), respectively, with per IQR increment of the lag1d PM2.5 concentration (Figure 1C). However, short-term PM2.5 exposure may not be associated with BP variability, morning BP surge, or the percentage of nocturnal BP decline (Figure 1B, 1D, 1E). When stratified by BP control status, the increment of 24-hour or daytime BP levels associated with PM2.5 exposure tended to be higher among those with uncontrolled BP, but the difference was not statistically significant (Figure 2A). Those with uncontrolled BP were more prone to have higher morning BP surges than those with controlled BP. For example, per IQR increment of the lag2d PM2.5 concentration was associated with 2.19 mmHg (95% CI: 0.47–3.91), 1.72 mmHg (95% CI: 0.20–3.24) and 1.47 mmHg (95% CI: -0.14–3.07) elevation for morning SBP, pre-waking SBP surge, and sleep-trough SBP surge, respectively, among patients without controlled BP, while no significant changes were noted in patients with controlled BP (all P<0.05) (Figure 2D). Among patients with uncontrolled BP, the association of PM2.5 exposure with 24-hour, daytime SBP variability was modified by treatment with ARB. For example, 24-hour SBP variability increased by 0.49 mmHg (95% CI: -0.22–1.20) per IQR increment of lag0d PM2.5 exposure among patients taking ARB, which was significantly higher than those not taking ARB (Figure 2G). In addition, patients taking ARB were more likely to have better circadian rhythms for DBP (Figure 2J).
Characteristics Overall
(n=277)Beijing
(n=64)Shanghai
(n=68)Wuhan
(n=75)Xi'an
(n=70)Age, years 59.1±8.5 53.5±8.1 60.3±8.6 62.6±6.0 59.3±8.8 Male, n (%) 113 (40.8) 35 (54.7) 23 (33.8) 23 (30.7) 32 (45.7) BMI, kg/m2 26.2±3.2 27.2±2.6 25.0±3.0 26.1±3.5 26.6±3.2 Current alcohol drinking status, n (%) 67 (24.2) 29 (45.3) 11 (16.2) 12 (16.0) 15 (21.4) Ideal level of physical activity, n (%) 101 (36.5) 23 (35.9) 14 (20.6) 35 (46.7) 29 (41.4) Central obesity, n (%) 184 (66.4) 53 (82.8) 28 (41.2) 57 (76.0) 46 (65.7) Office SBP, mmHg 134.5±13.6 134.1±11.4 134.4±12.0 132.6±15.4 137.2±14.7 Office DBP, mmHg 80.4±10.8 83.3±9.4 79.9±13.0 76.7±8.6 82.1±10.7 Diabetes mellitus, n (%) 78 (28.2) 13 (20.3) 29 (42.6) 16 (21.3) 20 (28.6) Dyslipidemia, n (%) 224 (80.9) 54 (84.4) 55 (80.9) 63 (84.0) 52 (74.3) Antihypertensive drug use, n (%) 254 (91.7) 54 (84.4) 64 (94.1) 70 (93.3) 66 (94.3) ACE inhibitor 18 (6.5) 4 (6.3) 2 (2.9) 5 (6.7) 7 (10.0) ARB 92 (33.2) 15 (23.4) 36 (52.9) 27 (36.0) 14 (20.0) β-receptor blocker 36 (13.0) 14 (21.9) 6 (8.8) 5 (6.7) 11 (15.7) CCB 161 (58.1) 42 (65.6) 30 (44.1) 49 (65.3) 40 (57.1) Diuretics 16 (5.8) 2 (3.1) 6 (8.8) 4 (5.3) 4 (5.7) Others 13 (4.7) 5 (7.8) 1 (1.5) 2 (2.7) 5 (7.1) One type of medications 178 (64.3) 32 (50.0) 48 (70.6) 49 (65.3) 49 (70.0) Two types of medications 61 (22.0) 16 (25.0) 12 (17.6) 18 (24.0) 15 (21.4) Three or more types of medications 15 (5.4) 6 (9.4) 4 (5.9) 3 (4.0) 2 (2.9) PM2.5, μg/m3 Lag0d 50.1±43.9 49.8±45.3 33.6±32.3 57.4±37.8 57.5±52.3 Lag1d 48.5±46.0 48.4±47.9 31.3±26.0 52.4±36.6 60.1±60.4 Lag2d 54.2±50.9 64.6±66.8 34.0±34.6 66.6±45.6 51.8±47.0 MA2d 51.2±44.6 56.5±51.0 32.9±29.0 59.4±38.2 55.8±51.7 PET, ℃ Lag0d 22.3±5.5 23.8±3.8 20.9±6.1 21.8±7.1 22.5±4.3 Lag1d 22.1±5.7 23.7±4.2 21.1±5.9 21.3±7.3 22.5±4.5 Lag2d 22.2±5.6 23.6±3.8 21.2±5.8 21.2±7.3 22.9±4.2 MA2d 22.1±5.6 23.6±3.9 21.1±5.8 21.2±7.3 22.7±4.3 Relative humidity, % Lag0d 53.5±16.2 40.8±17.3 66.1±11.1 59.6±10.8 49.3±12.6 Lag1d 54.7±16.0 41.8±17.3 67.5±10.6 61.1±10.0 49.4±12.0 Lag2d 54.1±15.6 41.6±17.9 64.7±7.9 62.7±8.7 47.2±12.2 MA2d 54.5±15.4 41.7±17.3 65.7±8.6 61.9±9.0 48.3±11.8 Note: Results are presented as mean±SD for continuous variables, and frequency (proportion) for categorical variables.
Abbreviations: SD=standard deviation; BMI=body mass index; SBP=systolic blood pressure; DBP=diastolic blood pressure; ACE=angiotensin-converting enzyme; ARB=angiotensin receptor blockers; CCB=calcium channel blocker; PM2.5=particles with aerodynamic diameter ≤2.5 µm; PET=personal environmental temperature; lag0d=current day with BP measurement; lag1d=lag of 1 day; lag2d=lag of 2 days; MA2d=the 2-day moving average of PM2.5.Table 1. Baseline characteristics of study participants in two cities and two municipalities, China, 2017−2019.
 Figure 1.
Estimated changes and 95% CIs of BP levels (A), BP variability (B), BP load (C), morning BP surge (D) and the percentage of nocturnal BP decline (E) with per IQR (41.96 μg/m3) of PM2.5 exposure among participants in two cities and two municipalities, China, 2017−2019
Note: Statistically significant changes were shown in red. Abbreviations: CI=confidence interval; BP=blood pressure; IQR=interquartile range; PM2.5=particles with aerodynamic diameter ≤2.5 µm; SBP=systolic blood pressure; DBP=diastolic blood pressure; lag0d=current day with BP measurement; lag1d=lag of 1 day; lag2d=lag of 2 days; MA2d=the 2-day moving average of PM2.5.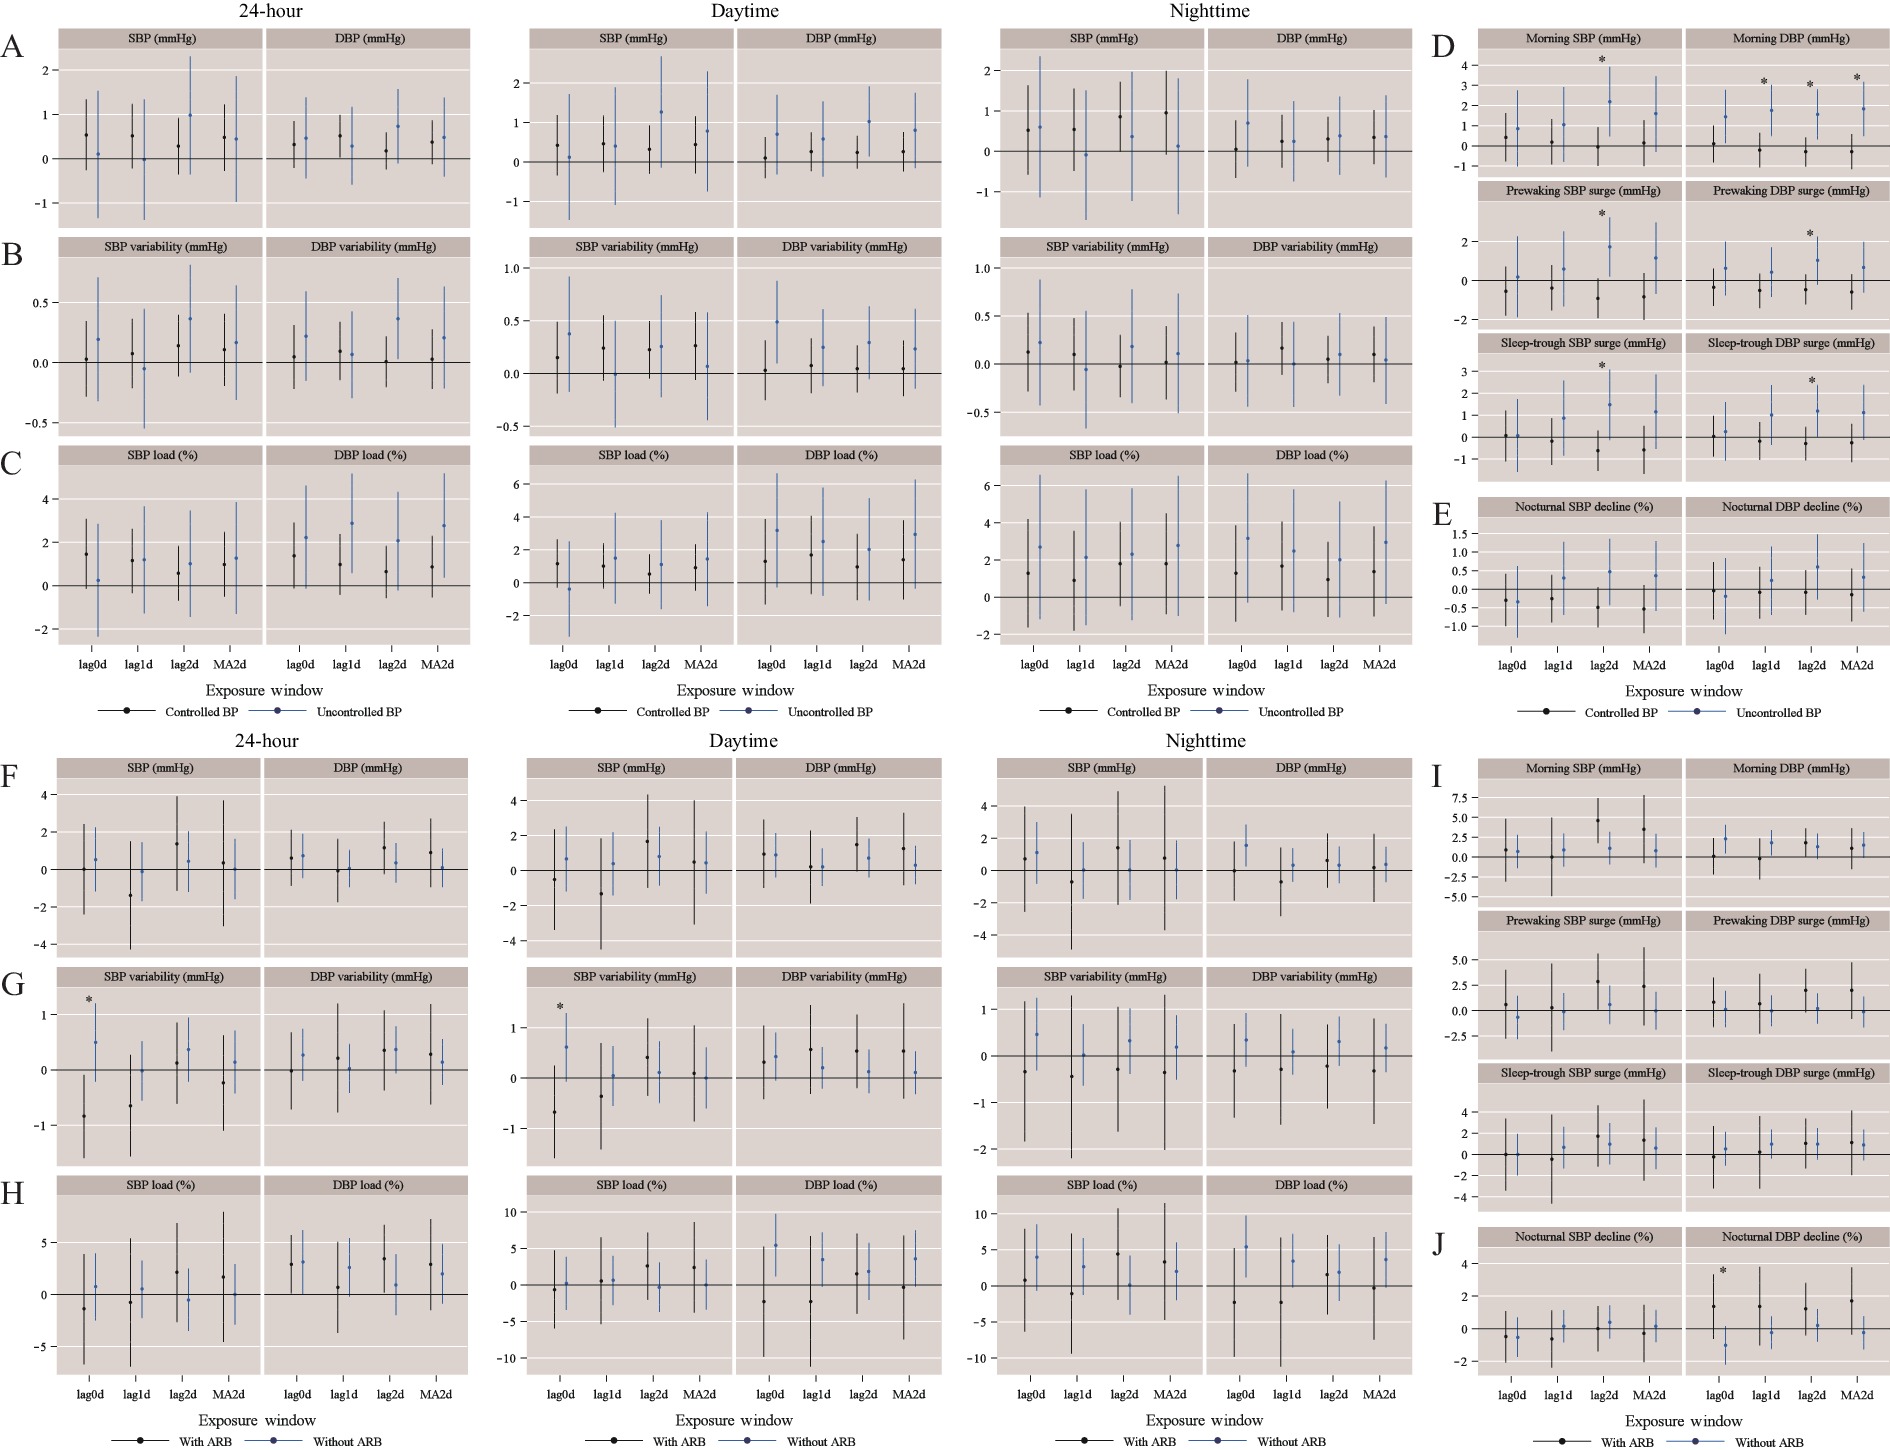 Figure 2.
Estimated changes and 95% CIs of BP levels (A, F), BP variability (B, G), BP load (C, H), morning BP surge (D, I) and the percentage of nocturnal BP decline (E, J) with per IQR (41.96 μg/m3) of the PM2.5 exposure, stratified by BP control status in overall population and by ARB use in patients without controlled BP in two cities and two municipalities, China, 2017−2019.
* P<0.05 for differences between two groups. Abbreviations: CI=confidence interval; BP=blood pressure; IQR=interquartile range; PM2.5=particles with aerodynamic diameter ≤2.5 µm; SBP=systolic blood pressure; DBP=diastolic blood pressure; ARB=angiotensin receptor blockers; lag0d=current day with BP measurement; lag1d=lag of 1 day; lag2d=lag of 2 days; MA2d=the 2-day moving average of PM2.5. -
This study observed that short-term PM2.5 exposure was associated with BP elevations and BP load and was the first to report the associations of short-term PM2.5 exposure with BP variability, as well as the circadian rhythm of BP among hypertensive patients being modified by a controlled BP status or by taking ARBs.
BP follows a circadian rhythm with an increase in the morning after waking and a dip during sleep. The existing studies have demonstrated that a disturbed circadian rhythm, including increases of pre-waking BP surges or blunted nocturnal BP declines were associated with increased CVD risk (4). In addition, BP variability and BP load were also associated with CVD or all-cause mortality (5-6). Up to now, only one study has found that increased short-term PM10 exposure was associated with blunted SBP dipping, and evidence for PM2.5 is still very lacking (7). Therefore, findings from the current study may provide evidence on the mechanism linking air pollution to increased CVD risk, and potential preventive measurements, such as a well-controlled BP and taking ARBs, to attenuate the adverse impacts of PM2.5.
Sympathetic nerve activation may play a role in the morning BP surge (8), and nocturnal BP non-dipping may be associated with endothelial dysfunction (9). In accordance with the findings of this study, people reaching well-controlled BP had more stable ANS, hence the adverse impacts of PM2.5 on morning BP surges were attenuated. On the other hand, exposure to PM2.5 may increase angiotensin II (10), which could induce oxidative stress and inflammation and further promote endothelial dysfunction. ARBs could inhibit the effects of angiotensin II. The potential endothelial dysfunction among patients without taking ARBs interfered the dipping of nocturnal BP. Additionally, the different lag effect trends of PM2.5 on different BP traits may be due to the various mechanisms of PM2.5-mediated BP elevation, which is an issue worth to exploring in future.
This study firstly reported the association of short-term PM2.5 exposure with various ABPM indicators, which may provide hints for preventing people from the influences of PM2.5. Additionally, this study was a stringent panel study with a multiphase and multicity design, with individual PM2.5 monitoring and ABPM, which allowed time-dependent covariates to be adjusted, and was less likely to cause misclassification, making the findings more accurate. However, this study was still subject to some limitations. First, owing to the absence of individual gaseous pollutants, the independent effects of PM2.5 have not been assessed. Second, this study used BP measurements from 06∶00 to 08∶00 instead of BP levels 2 hours after waking to calculate morning surge due to missing information on waking time in this study.
In conclusion, this study added evidence of the associations between short-term PM2.5 exposure and ABPM indicators, and further highlighted antihypertensive therapy, especially with well-controlled BP status, which may be a potential measurement to attenuate adverse impacts of PM2.5 for patients with intermediate-to-high risk of CVD.
HTML
| Citation: |

|