-
Macrosomia refers to livebirths with birth weight ≥4,000 g and is an important public health concern. A wealth of evidence has indicated that macrosomia is associated with risk of infant and maternal complications and long-term morbidities in infants (1), which carries emotional and economic costs to families and society. Recent decades witnessed rising trends in incidence of macrosomia in many developing countries (2). Due to lack of a national vital statistics system with detailed information on birth indicators, China’s secular and temporal changes in macrosomia incidence were unclear, with large variations across years and regions in different reports (3–4). Earlier research has found significant differences in macrosomia incidence between urban and rural areas (5), yet most studies were mainly based on hospital data in urban areas, especially in southern or northern regions. Henan, located in central China, was among the largest populated and agricultural provinces in China with over 109 million people, while its incidence of adverse pregnancy outcomes including macrosomia was scarcely reported. The aim of the present study was to use a large population-based birth cohort study to depict the incidence of the macrosomia among live births in rural areas of Henan Province of China from 2013 to 2017.
-
The study data came from the National Free Pre-Pregnancy Check-Up Project (NFPCP) in Henan Province. The NFPCP has been providing free health examinations and counselling services for couples intending to become pregnant, especially in rural areas, and following up with pregnancy outcomes since 2010. Basic sociodemographic information of participants, including maternal age and educational level were collected at baseline. Healthcare workers then interviewed women face-to-face or by telephone from beginning of pregnancy to delievery or termination of pregnancy, recording their pregnancy outcomes (normal birth, miscarriage, induced abortion, or stillbirth, etc.), delivery date, gestational weeks, and newborn information (gender and birth weight, etc.) Detailed design of the project was described elsewhere (6). A total of 1,262,916 pregnant women delivered live births in 2013–2017 and were thus included in our analysis. The study protocol was reviewed and approved by Ethics Committee of Henan Institute of Reproductive Health Science and Technology, and written informed consent was obtained from all participants.
Birth indicators were measured by trained obstetricians. Macrosomia was defined as live births with ≥4,000 g birth weight. Subgroups of macrosomia were also analysed, including term macrosomia (gestational weeks ≥37 and <42), post-term macrosomia (≥42 gestational weeks), macrosomia with birth weight <4,500 g, and macrosomia with birth weight ≥4,500 g. The incidence of macrosomia was calculated by using total number of macrosomia as the numerators and all live births as the denominators. We used chi-squared tests to compare incidence (denoted as χ2) and chi-squared trend tests to examine the trends of incidence across years (denoted as
$ {\chi }_{trend}^{2} $ ). The significance level of tests was <0.05. R software (version 4.0.2, R Development Core Team, Vienna, Austria) was used for the analysis. -
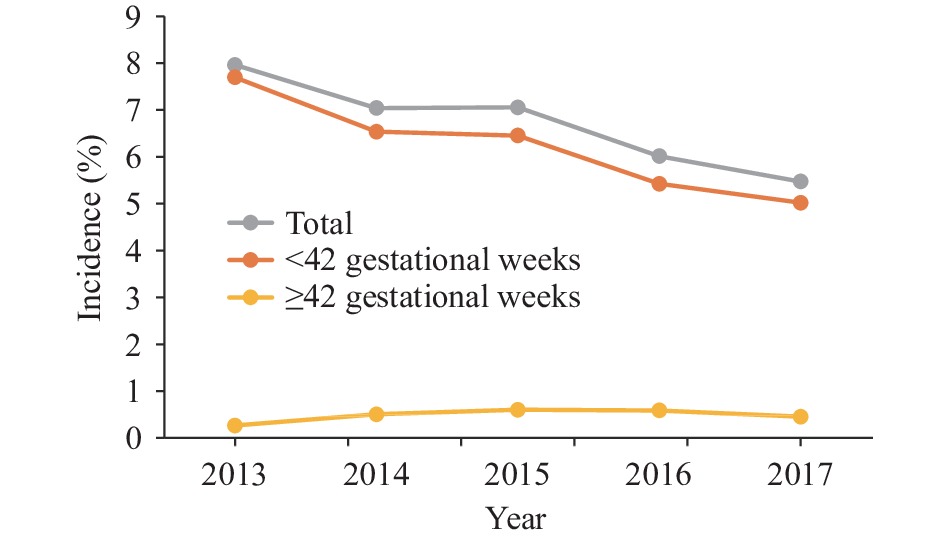
Among the 1,262,916 births, 82,353 were cases of macrosomia (Table 1). The total incidence of macrosomia was 6.52%. The incidence of macrosomia with birth weight <4,500 g and macrosomia with birth weight ≥4,500 g were 5.30% and 1.22%, respectively. Male infants have significantly higher incidence of macrosomia than that of female infants regardless of birth weight (P<0.001). Incidence of macrosomia with ≥42 gestational weeks was much higher than that of <42 gestational weeks regardless of birth weight (P<0.001). Figure 1 showed the incidence trend of macrosomia from 2013 to 2017. The incidence of total macrosomia decreased by 31.28% overall from 7.96% in 2013 to 5.47% in 2017 (
$ {\chi }_{trend}^{2} $ =946.96,$ {P}_{trend} $ <0.001). The term macrosomia subgroup also showed similar decreases, yet post-term macrosomia rose from 0.27% in 2013 to 0.60% in 2015 and dropped to 0.45% in 2017 ($ {\chi }_{trend}^{2} $ =4.64,$ {P}_{trend} $ <0.05).Item Births Macrosomia Total <4,500 g ≥4,500 g n n Incidence, % n Incidence, % n Incidence, % Total 1,262,916 82,353 6.52 66,988 5.30 15,365 1.22 Year 2013* 56,816 4,524 7.96 3,615 6.36 909 4.60 2014 314,403 22,142 7.04 17,771 5.65 4,371 1.39 2015 320,878 22,638 7.06 18,782 5.85 3,856 1.20 2016 333,564 20,061 6.01 16,322 4.89 3,739 1.12 2017 237,255 12,988 5.47 10,498 4.42 2,490 1.05 Ptrend <0.001 <0.001 <0.001 Maternal age (years) 15–19 12,364 781 6.32 644 5.21 137 1.11 20–24 385,873 26,190 6.79 21,448 5.56 4,742 1.23 25–29 628,185 40,620 6.47 33,013 5.26 7,607 1.21 30–34 168,905 10,656 6.31 8,578 5.08 2,078 1.23 35–39 52,306 3,157 6.04 2,528 4.83 629 1.20 40–49 14,807 916 6.19 750 5.07 166 1.12 P <0.001 <0.001 0.648 Maternal education College and above 104,252 7,319 7.02 5,703 5.47 1,616 1.55 Senior high school 196,481 13,144 6.69 10,676 5.43 2,468 1.26 Junior high school 918,954 58,779 6.40 48,155 5.24 10,624 1.16 Primary school and below 11,368 718 6.32 574 5.05 144 1.27 P <0.001 <0.001 <0.001 Gender Male 645,042 56,079 8.69 46,753 7.25 9,326 1.45 Female 621,982 26,211 4.21 20,187 3.25 6,024 0.97 P <0.001 <0.001 <0.001 Gestational weeks <41 1,195,938 75,652 6.33 61,596 5.15 9,326 0.78 ≥42 66,978 6,701 10.0 5,392 8.05 6,024 8.99 P <0.001 <0.001 <0.001 * Only part of study areas were included. Table 1. Incidence of macrosomia in rural areas of Henan Province from 2013 to 2017.
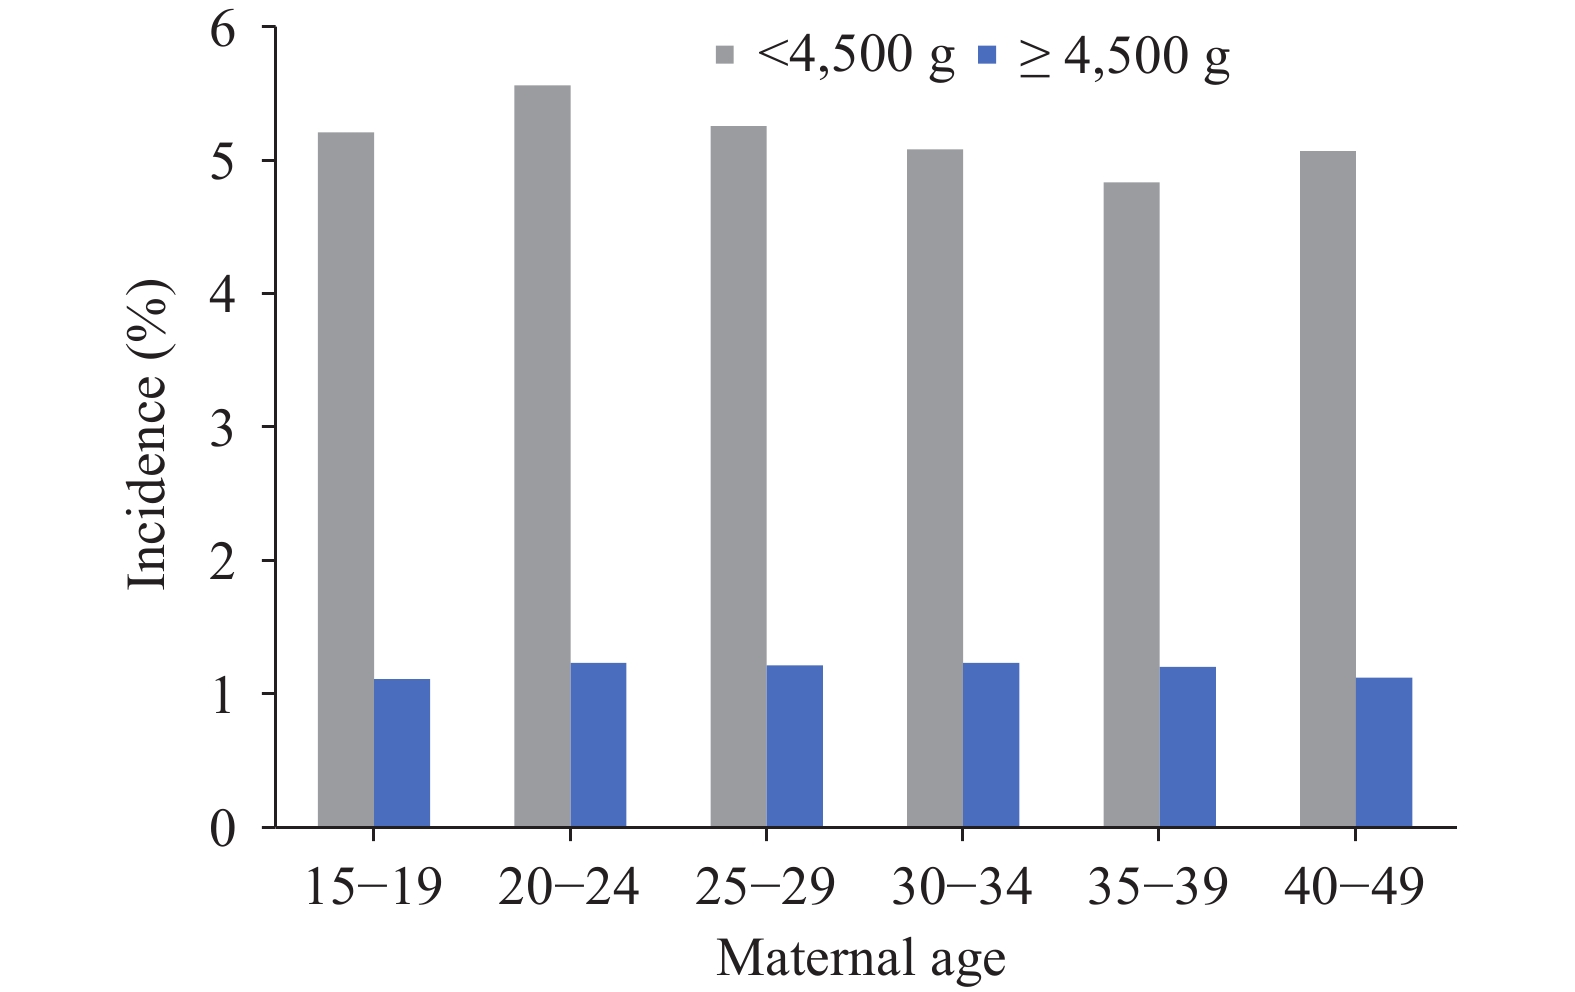
Figure 2 showed incidence of macrosomia subgroups by maternal age. The incidence of macrosomia <4,500 g increased from age 15–19 (5.21%) to age 20–24 (5.56%), decreasing afterwards until age 35–39 (4.83%) and then increasing slightly at age 40–49 (5.07%, χ2=94.73, P<0.001). There was no significant changes in incidence of macrosomia with ≥4,500 g by maternal age (χ2=3.34, P=0.648).
Figure 3 showed incidence of macrosomia subgroups by maternal education. Significant differences existed across maternal education levels in both macrosomia subgroups. The incidence of macrosomia with ≥4,500 g subgroup in college and above education group was the highest (1.55%), followed by primary and below and senior high school (1.27% and 1.26%, respectively), and the lowest incidence was in junior high school (1.16%) (χ2=127.25, P<0.001). While the incidence of <4,500 g subgroup monotonously decreased with declining maternal education level (χ2=127.25, P<0.001, respectively).
-
This study described the distribution characteristics of macrosomia in a large population-based cohort study in rural areas of Henan Province of central China between 2013 and 2017. The total incidence of macrosomia was 6.52%, consistent with results in a population-based survey also in rural areas in two counties in Shanxi (6.45%) in 2007–2012 (7) and another sample survey in rural areas of 14 provincial-level administrative divisions (PLADs) in 2006 (6.3%) (5). Previous research has reported relatively large variations of macrosomia incidence across regions. For example, a sample survey in 23 PLADs from 2010 to 2014 reported macrosomia’s incidence to be 8.7% (4), yet another survey covering 14 PLADs reported the rate to be 7.3% in 2011 (3). A regional survey in Foshan City, Guangdong Province reported the incidence at 2.5% (8), while another survey in Beijing Municipality reported 7.6% (9). These large disparities in macrosomia incidence could come from “true” differences due to different demographic, socioeconomic, and medical characteristics in different regions and years (10–11), but could also come from different ways and accuracies in estimating gestational age and birth weight, sampling errors, and whether the data were at the hospital or population level.
Our study observed that although there were signs of decrease, the incidence of macrosomia in rural Henan Province was still high. Our previous study indicated the macrosomia comprised 41% of all adverse pregnancy outcomes (7). A body of literature has revealed macrosomia to be pertinent to hypertension and metabolic sydrome from childhood to adulthood (1). Gestational weight gain and maternal age are the most crucial drivers of macrosomia (12). With spread of healthcare education, nutrition intervention and weight control for pregnant women, the incidence of macrosomia has been found to reduce in urban areas (9,13), while in rural areas, such healthcare services are less available and the traditional perception of weight gain during pregnancy — “the bigger and heavier, the better” — are still popular. Our study thus suggests the local government and people implement targeted measures to reduce occurrences of macrosomia. For example, education and nutrition consultation should be strengthened among women preparing for pregnancy or who are currently pregnant, especially in rural areas. Besides, local pregnancy nutrition clinics can be established for accurate intervention on gestational weight management.
This study showed disparities in occurrences of macrosomia across different maternal ages and education levels, yet diverse patterns of these disparities were observed in different macrosomia subgroups. Past literature has confirmed an association between macrosomia and maternal sociodemographic factors, but specifics are still unclear as different patterns were observed in different populations (11). Understanding the underlying mechanisms behind relationship between macrosomia and sociodemographic factors would help take targeted measures in different sub-populations.
This study had some strengths. First, the large sample involving more than 1.2 million live births in our study made it possible for us to calculate stable and reliable incidence rate of macrosomia across different sub-populations. Second, as all couples preparing for pregnancy got free check-up in the project, our study was at the population level, thus reducing selection bias.
This study was also subject to some limitations. First, gestational age and birth weight were self-reported by women and thus there might be recall bias. Second, because only those preparing for pregnancy would participate in the Pre-Pregnancy Check-Up Project, our research could not cover unplanned pregnancies. As planned pregnancies have been found to be associated with lower risks of adverse birth outcomes (14), this could partly explain the lower incidence rate in our study.
In conclusion, the present study used a large population-based cohort data to describe the variations of macrosomia incidence in a rural central China PLAD, providing a baseline indication for the researchers and decisionmakers to understand the status of macrosomia. Our findings suggested incidence of macrosomia in Henan Province generally decreased, yet the incidence was still high. Given the short-term and long-term impacts on population quality caused by macrosomia, our study thus calls for maternal healthcare personnel and pregnant women paying attention to nutrition and weight management during pregnancy, especially in rural areas.
HTML
| Citation: |


 Download:


