
 Download:


-
Since the outbreak of coronavirus disease 2019 (COVID-19), caused by severe acute respiratory syndrome coronavirus 2 (SARS-CoV-2) in December 2019, the total number of related deaths worldwide has exceeded 2.8 million (1). Every country is currently taking various measures to combat the spread of this disease. However, eradication of this virus or stopping its transmission has been a challenging task. Evidence has shown herd immunity is unlikely to be achieved without intervention or vaccination (2-4). With the increase of daily new cases (5) and the lag in the production of antibodies by the vaccine and their uncertain effectiveness, it is urgent to first control the spread of COVID-19 via non-pharmaceutical interventions (NPIs). NPIs that limit social contact and enable continuance of protective behaviors, such as social distancing, night curfews, mask requirements, and area lockdowns, can help curb the pandemic until vaccines are rolled out (6-9).
Several countries have experienced three or more waves of the pandemic thus far. In most cases, outbreaks have occurred after the government loosened or withdrew the use of NPIs when the number of infections was lower than a certain threshold. To achieve an optimal balance between public health risks and economic recovery, in addition to the effects of the different NPIs, policymakers must understand the type of NPIs, i.e., mandatory or voluntary compliance, that should be implemented and during which phase of the pandemic these NPIs should be withdrawn.
While vaccines are being rolled out in several countries, it is still crucial to understand the types and timings of the different NPI measures that should be implemented to contain the pandemic effectively. Since the first COVID-19 vaccine was administered in the United Kingdom (UK) in December 2020, followed by numerous countries including the United States (US), Canada, some European countries, and China (10), studies on the effect of vaccines at each stage of the shifting population-vaccination ratio are being conducted. Most countries are still far from the goal of having more than 80% of their total population vaccinated. Implementing the most effective and appropriate NPIs during this transition period will help get people’s life back to as close to normal as possible.
-
A number of epidemiological transmission models have been established to evaluate and predict the increase in the number of COVID-19 cases (11-18). Some predictions were made based on the mobility of the virus spread represented by the basic reproduction number, R0. However, the parameters used in these models were complicated for two reasons. First, there are several unknown aspects of COVID-19, and it remains unclear as to why the virus mutates rapidly. Second, different social and environmental factors, such as government policies, environmental temperature, and population density, had different effects on these parameters. For instance, it would be inappropriate to use the epidemiological parameters of a cold, low-population-density country with good sanitary conditions to forecast the pandemic trajectory in a hotter, high population-density country with minimal government intervention measures.
This study developed a new model, called the Braking Force Model on Virus Transmission to examine and evaluate the validity and efficiency of different anti-contagion policies, including NPIs and vaccines under different situations and conditions and with different sample numbers. Most importantly, the Braking Force Model is not correlated to epidemiological parameters and it extracts information directly from the pandemic data. If we consider the pandemic to be a moving car, SARS-CoV-2 with its high transmissibility can be regarded as stepping on the accelerator, where the speed of spread or transmission of the virus is represented as R0. The higher the speed, the faster and wider is the spread of the pandemic. Governments brake the car by implementing different NPIs. In other words, whenever governments release the brakes, the car will pick up the speed again. Another way to slow down the car would be to increase the friction between the ground and the wheels of the car by making the ground extremely muddy or bumpy, such that the car stops — in other words, the pandemic stops, which is the desired effect of vaccination and can be achieved by breaking the chain of transmission. This analogy demonstrates that the speed of virus transmission is directly related to the dynamics of virus transmissibility, use of NPIs, and vaccination. These are the key factors determining the shape of the pandemic wave.
The proposed model can be expressed as follows:
$$ {a}_{Covid19}={\mu }_{vaccine}{ \cdot a}_{R0}+\sum {a}_{NPI} \cdot \gamma $$ $ {a}_{Covid19} $ =the acceleration of the pandemic at a particular point in time.$ {a}_{R0} $ =acceleration of the basic reproduction number.R0=a variable that depends on the mutation of the virus, temperature, and local population density.
$ {\mu }_{vaccine} $ =the coefficient or the vaccination ratio, which is 1 for no antibodies produced by vaccination and 0 when herd immunity is achieved.$ {a}_{NPI} $ =the acceleration of NPIs. This value is generally negative if it acts as the braking force. The deceleration, which is the absolute value of NPIs from high to low, is in the order of levels A, B, and C. Such a deceleration of the same NPI could vary according to the differences in factors such as anti-contagion policies, local sanitation, and the habits and customs of local people.$ \gamma $ =coefficient of execution efficiency of the NPIs; a multiplier of$ {a}_{NPI} $ .To bring down the number of new cases, the absolute value of NPIs and vaccine deceleration must be higher than the basic acceleration of COVID-19. By studying the acceleration
$ {a}_{Covid19} $ , we can assess the effect of each intervention by profiling the pandemic peak.At present, policymakers need a model that can be easily adopted to analyze unknown epidemic transmission behaviors by identifying and foreseeing the growth of the pandemic based on the actual circumstances. Drawing from the widely used peak profile method in the field of physics, the Braking Force Model fits the wave without assuming any epidemiological parameters. It is expected that policymakers will be able to refer this model to examine the validity and efficiency of different anti-contagion policies, including the use of NPIs and vaccines to achieve desirable and effective outcomes.
-
Every increase and subsequent drop in new COVID-19 cases is described as a peak, or a wave. In our study, we extracted information using the peak profile method and determined the pandemic trajectory based on data from the database of new COVID-19 cases in different countries and regions (10). We first classified the epidemic control effectiveness manually into three levels. Level A efficiency represented a very efficient control of the pandemic, and the shape of the wave was fairly symmetric. Level B represented a mild control, with a longer tail in the wave shape. Level C represented an unsuccessful control with the number of daily new cases decreasing very slowly with repeated fluctuations (Supplymentary Figure S1).
Our data outlined the interval of the fitting parameters of each level. By using semi-supervised learning, our model can classify the ongoing wave and study the effect of different NPIs as well as vaccines in controlling the pandemic. Using the parameters obtained from peak fitting, our model can also forecast the pandemic tendencies of each ongoing wave under the current anti-contagion policy and provide a prediction parameter t30% for each wave. This prediction parameter, t30%, represents the time required for the number of new cases to decrease to 30% of the highest number of new cases in a particular wave (see Supplementary Materials “forecast method” for detailed information), which could partially represent the speed of controlling the epidemic. A flow chart of the algorithm is presented in Figure 1. (Detailed information of the model and algorithm in the Supplementary Materials).
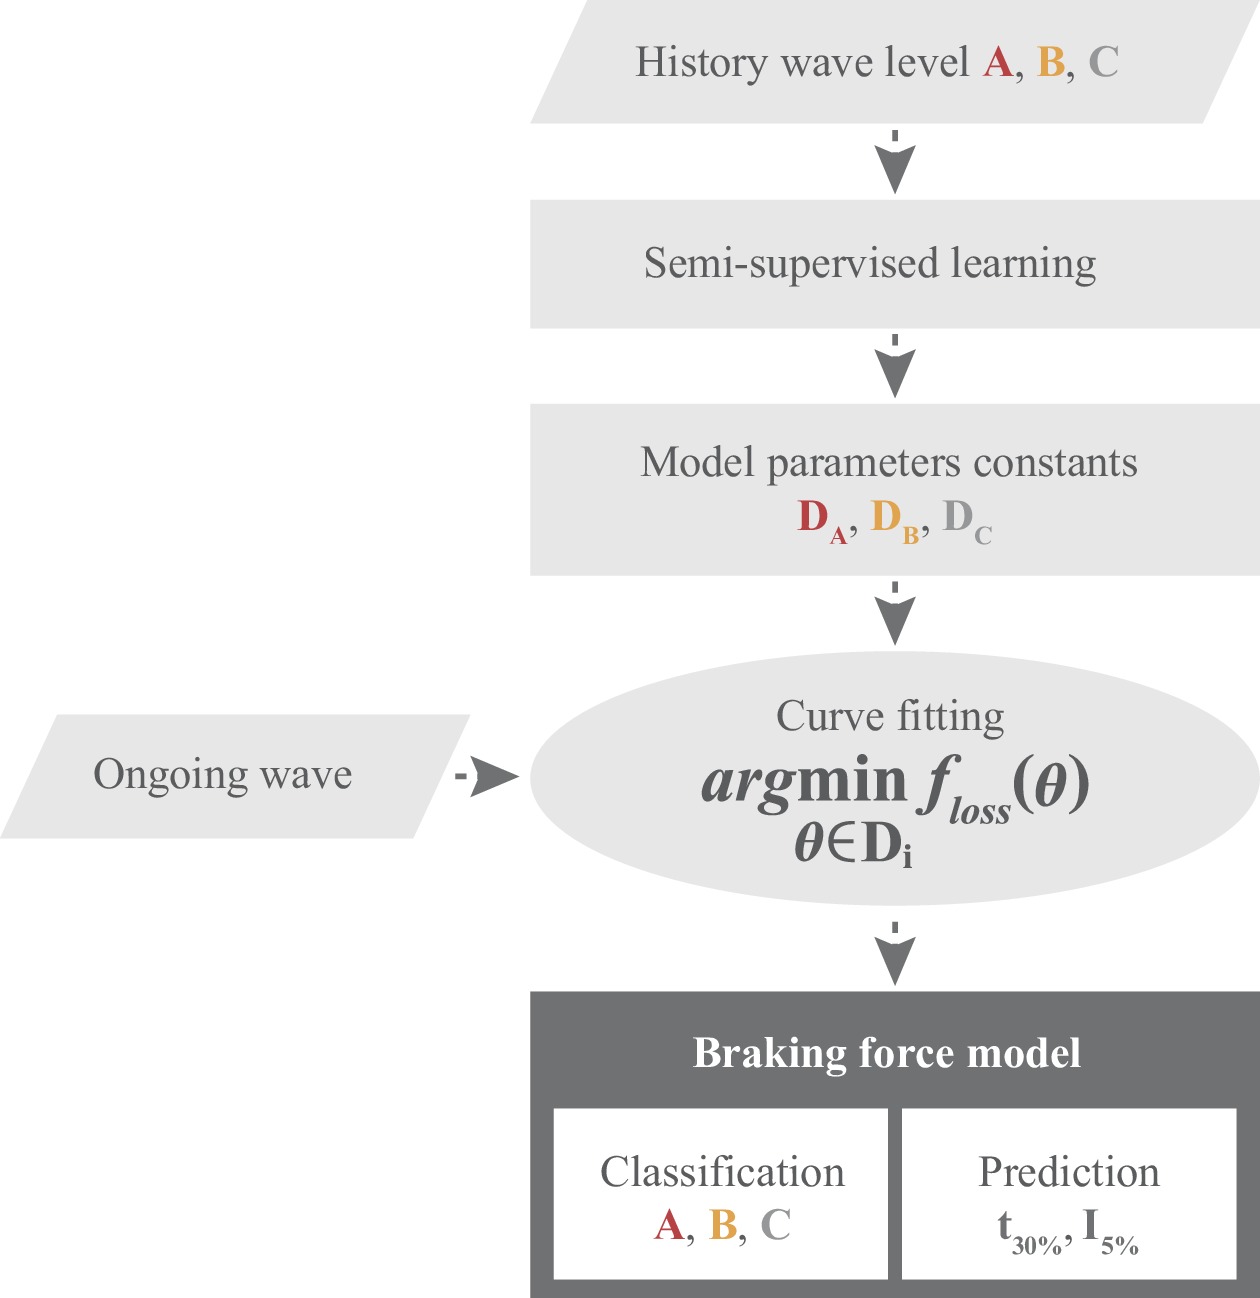 Figure 1.
Flow chart of the classification and forecast of pandemic waves using the peak profile method.
Note: I%: A parameter to predict the number of new daily cases as a percentage relative to the highest number of daily cases during the current wave of the pandemic.Compared to the classic epidemic model, one of the significant characteristics of the Braking Force Model lies in the fact that all the information is drawn directly from the pandemic data, i.e., historical daily new cases. No hypotheses are made on epidemiological transmissions, like the basic reproduction number (R0), infection rate, or recovery rate, offering novel perspectives to understanding COVID-19.
-
We used the Braking Force Model to further study the effectiveness of the most commonly used NPIs, such as lockdowns, mask-wearing, and social distancing, on controlling the pandemic as well as their optimal implementation periods. Notably, the effectiveness of each NPI can vary according to people’s actual behaviors in different countries and during different time periods. The classification is based on the assumption that the interventions are correctly and strictly implemented. Another assumption is that, in most parts of the world, the COVID-19 pandemic was much more severe in the second half of 2020. Hence, we study mainly the history of waves after July 2020 (1,19), in order to achieve better comparisons between parameters.
-
As one of the most severe NPIs, lockdown is usually complemented with other NPIs such as social distancing, night curfews, and mask-wearing. We studied the data of five countries (Supplymenatary Table S1) and classified the effectiveness of lockdown on controlling COVID-19 as Level A, with an average prediction of t30% of approximately 23 days. Its high effectiveness showed that lockdown is the fastest way to control the outbreak. However, lockdown causes serious societal and economic disruptions, which highlights the importance of finding the optimal duration. Thus, a prediction parameter I5% was set up for the daily number of new cases being 5% of the highest number of this wave. It is recommended that the lockdown policy should continue until it meets this 5% parameter, i.e., when the current pandemic wave is under control.
-
The second round of lockdown in France occurred from October 30 to November 30 of 2020. After two weeks of lockdown, by incorporating the number of new infections on November 10, our Braking Force Model classified this wave as Level A with high efficiency and forecasted that the number of new infections could be reduced to I5% on December 12. In other words, our model suggested that by December 12, the wave of COVID-19 in France would be under control. It was found that such a forecast had close alignment with reality until the lockdown was lifted on November 30, when the number of new cases were approximately 25% of the peak. Subsequently, the daily new cases bounced back immediately and deviated from our forecast (Figure 2B).
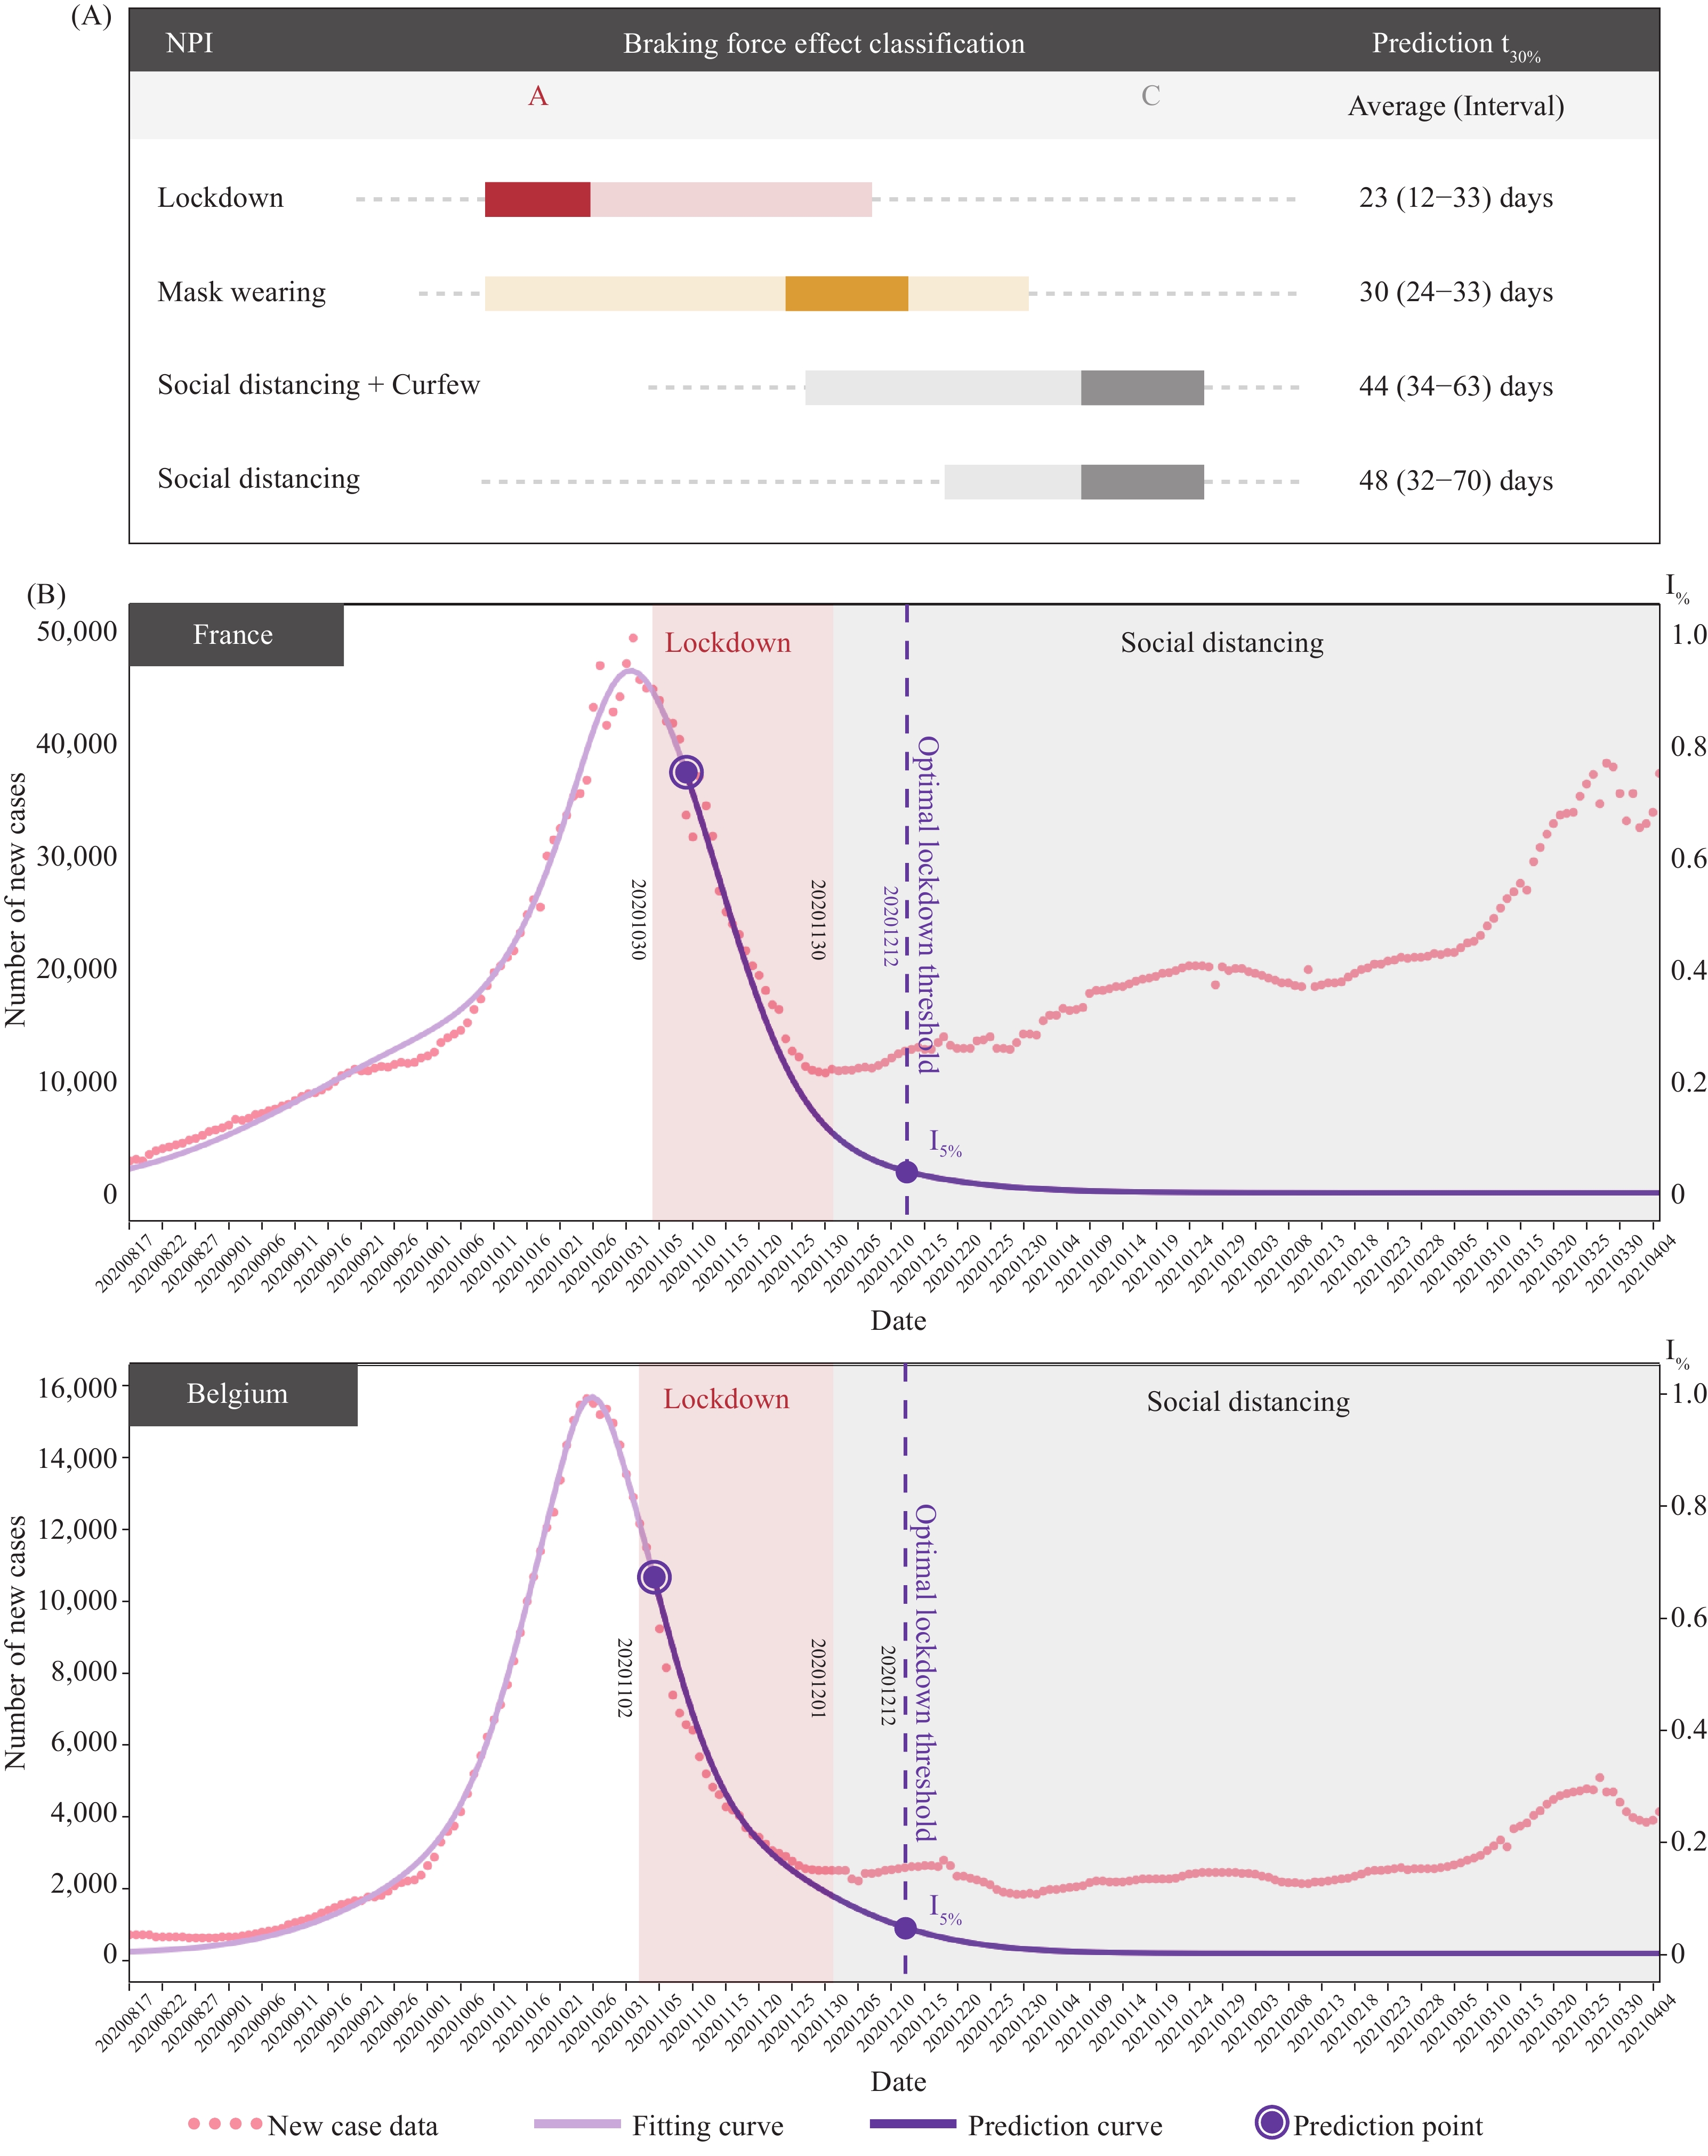 Figure 2.
Non-pharmaceutical interventions (NPIs) classification and pandemic wave analysis. (A) Braking force effect classification of NPIs and their prediction t30% value; (B) analysis of pandemic wave of France and Belgium.
Note: I%: A parameter to predict the number of new daily cases as a percentage relative to the highest number of daily cases during the current wave of the pandemic. -
Belgium had a pandemic wave tendency and anti-contagion policy similar to that of France before the end of November 2020. Belgium had also lifted their lockdown on December 1 at around the same time as France. However, at that time, the number of new cases in Belgium was approximately I15%; the mobility data (Supplymenatary Figure S3) showed that Belgium succeeded to maintain a lower mobility trend than France and the number of new cases continued to decrease to I10% around the time of Christmas. Despite the gap between reality and our projection of I5%, the pandemic stabilized eventually, as was predicted by our model (Figure 2B).
-
If strictly and correctly implemented, mask-wearing can help reduce virus transmission with a high effectiveness of Level B, and sometimes, even Level A. The t30% of mask-wearing is commonly greater than the lockdown of Level A and the shape of wave is less symmetrical. However, its effectiveness is dependent on public behavior (20) and can drop to Level C if people do not strictly abide by the rules. For example, Singapore adopted a strict mask-wearing policy that required 95% of the population to wear a mask outside their homes, starting from September 2020 (20). According to our model, such policies have the potential to achieve Level B effectiveness, with an average t30% for approximately 30 days (Supplementary Table S1).
-
The effectiveness of less strict NPIs, such as social distancing and night curfew were studied (Supplementary Table S1) based on the data of 10 countries and regions, including Germany, Sweden, and New York State. The effectiveness of social distancing was not found to be highly satisfactory, even when accompanied by the night curfew policy, mainly fluctuating between Level B to C, with an average t30% of approximately 44 and 48 days, respectively. By adopting these measures, a community will take at least twice as long to end the pandemic wave using less strict NPIs instead of lockdown.
By analyzing the history of the pandemic waves and the actual public response to the NPIs, we confirmed that leniency in implementing any anti-contagion policy would likely cause delays in pandemic control. Meanwhile rigorous execution of NPIs increases the braking force effectiveness. Consequently, when facing an outbreak, Level A measures should be implemented to promptly put the virus spread in control. Level B measures are also helpful but require additional time to curb the pandemic, whereas Level C NPIs have very limited contribution in this regard. Nevertheless, both Level B and C policies can be helpful for maintaining a low transmission level when the number of new cases decreases below I5%.
-
With regard to investigating the effectiveness of vaccines in controlling the pandemic, our study focused on two countries, Israel and the United Arab Emirates (UAE), which had the highest vaccination ratios. We found that both these countries had inflection points of deceleration that were probably uncorrelated with the NPIs. The inflection point of the deceleration indicates the point at which the growth rate of epidemic cases has decreased, which in our model, is the date when the daily new cases start to decrease for a long period in the future. The inflection points of Israel took place on February 5, 2021, on which the braking force effect classification of its NPIs increased from Level C to Level B. For the UAE, despite its continuous use of Level C NPIs, an inflection point was still observed on February 24 (Figure 3).
Since antibodies develop approximately 10 to 14 days after the vaccination, we found that the day when the vaccine was given was also when both Israel and the UAE reached 50 vaccine doses administered (VDA) per 100 people in the total population. While Israel had NPIs such as lockdown, few NPIs were implemented in the UAE, such as partial border closing. Since the inflection point of Israel occurred after the lockdown was called off, and the NPIs of the UAE remained stable before and after the inflection point, it was likely that the effectiveness of vaccination led to the inflection, so we could conclude that it is probably the vaccination played an important role in driving the wave to its inflection point.
In addition, Israel and UAE used different vaccines (Pfizer and Moderna for Israel, mRNA type and Sinopharm for UAE, inactivated type). These vaccines required two doses. Since the inflection point appeared synchronically around VDA=50, we could deduce that mRNA and inactivated vaccines showed an effect after VDA=50. Before that, the contribution of the vaccine to controlling the pandemic was uncertain.
After incorporating the daily new cases in Israel on February 27, 2021, our model projected that the virus spread could be controlled to reach I5% on April 3; this finding showed good alignment with the later trajectory (Supplementary Figure S4). For the UAE, if the current anti-contagion policy continues, I5% should be reached around June 5, 2021 (Supplementary Figure S4). Theoretically, continuous vaccination will result in herd immunization. Since different manufacturers stated that their current vaccines would provide at least six months of immunity, it is crucial to achieve herd immunity in 6 months.
When evaluating vaccine effectiveness, the US was also studied because this country had both a large number of new cases as well as vaccine doses that were administered. We focused on three states in the US: Florida, New York, and Texas, wherein different NPIs were implemented. To date, their VDA had not reached the delay of 50 + 14 days. Further, evident inflection points were observed. Notably, under similar VDA rates, the pandemic wave tendency and the braking force effectiveness classification of the three states were found to differ; thus, we can infer that the NPIs are the primary factors influencing the pandemic wave in the US.
 Figure 3.
Braking Force Effectiveness classification of Israel, United Arab Emirates (UAE), and the United States (US) states of Florida, Texas, and New York with comparisons of different vaccination ratios.
Note: I%: A parameter to predict the number of new daily cases as a percentage relative to the highest number of daily cases during the current wave of the pandemic. -
Utilizing the Braking Force Model for COVID-19, we revealed the braking effect of NPIs and vaccines on the pandemic and provided a forecast method on when the pandemic could be controlled. Furthermore, this model also helps to propose a pandemic control strategy framework (Figure 4) when an outbreak occurs by implementing strict Level A NPIs, such as lockdown, to promptly and effectively curb virus transmission. In the first stage, the faster the spread of the pandemic can be restrained, the fewer the people who will be infected. Notably, the optimal threshold moment occurred when the number of new infections reduced to 5% of the summit of the wave, denoted I5% (as predicted using our model); this was when the lockdown restrictions should be relaxed. Afterwards, less strict NPIs can be implemented to maintain the stability of the situation when the number of new cases is relatively low. In the second stage, there was a risk that the NPIs may become too lenient or relaxed, and this could lead to the sparking of a new outbreak.
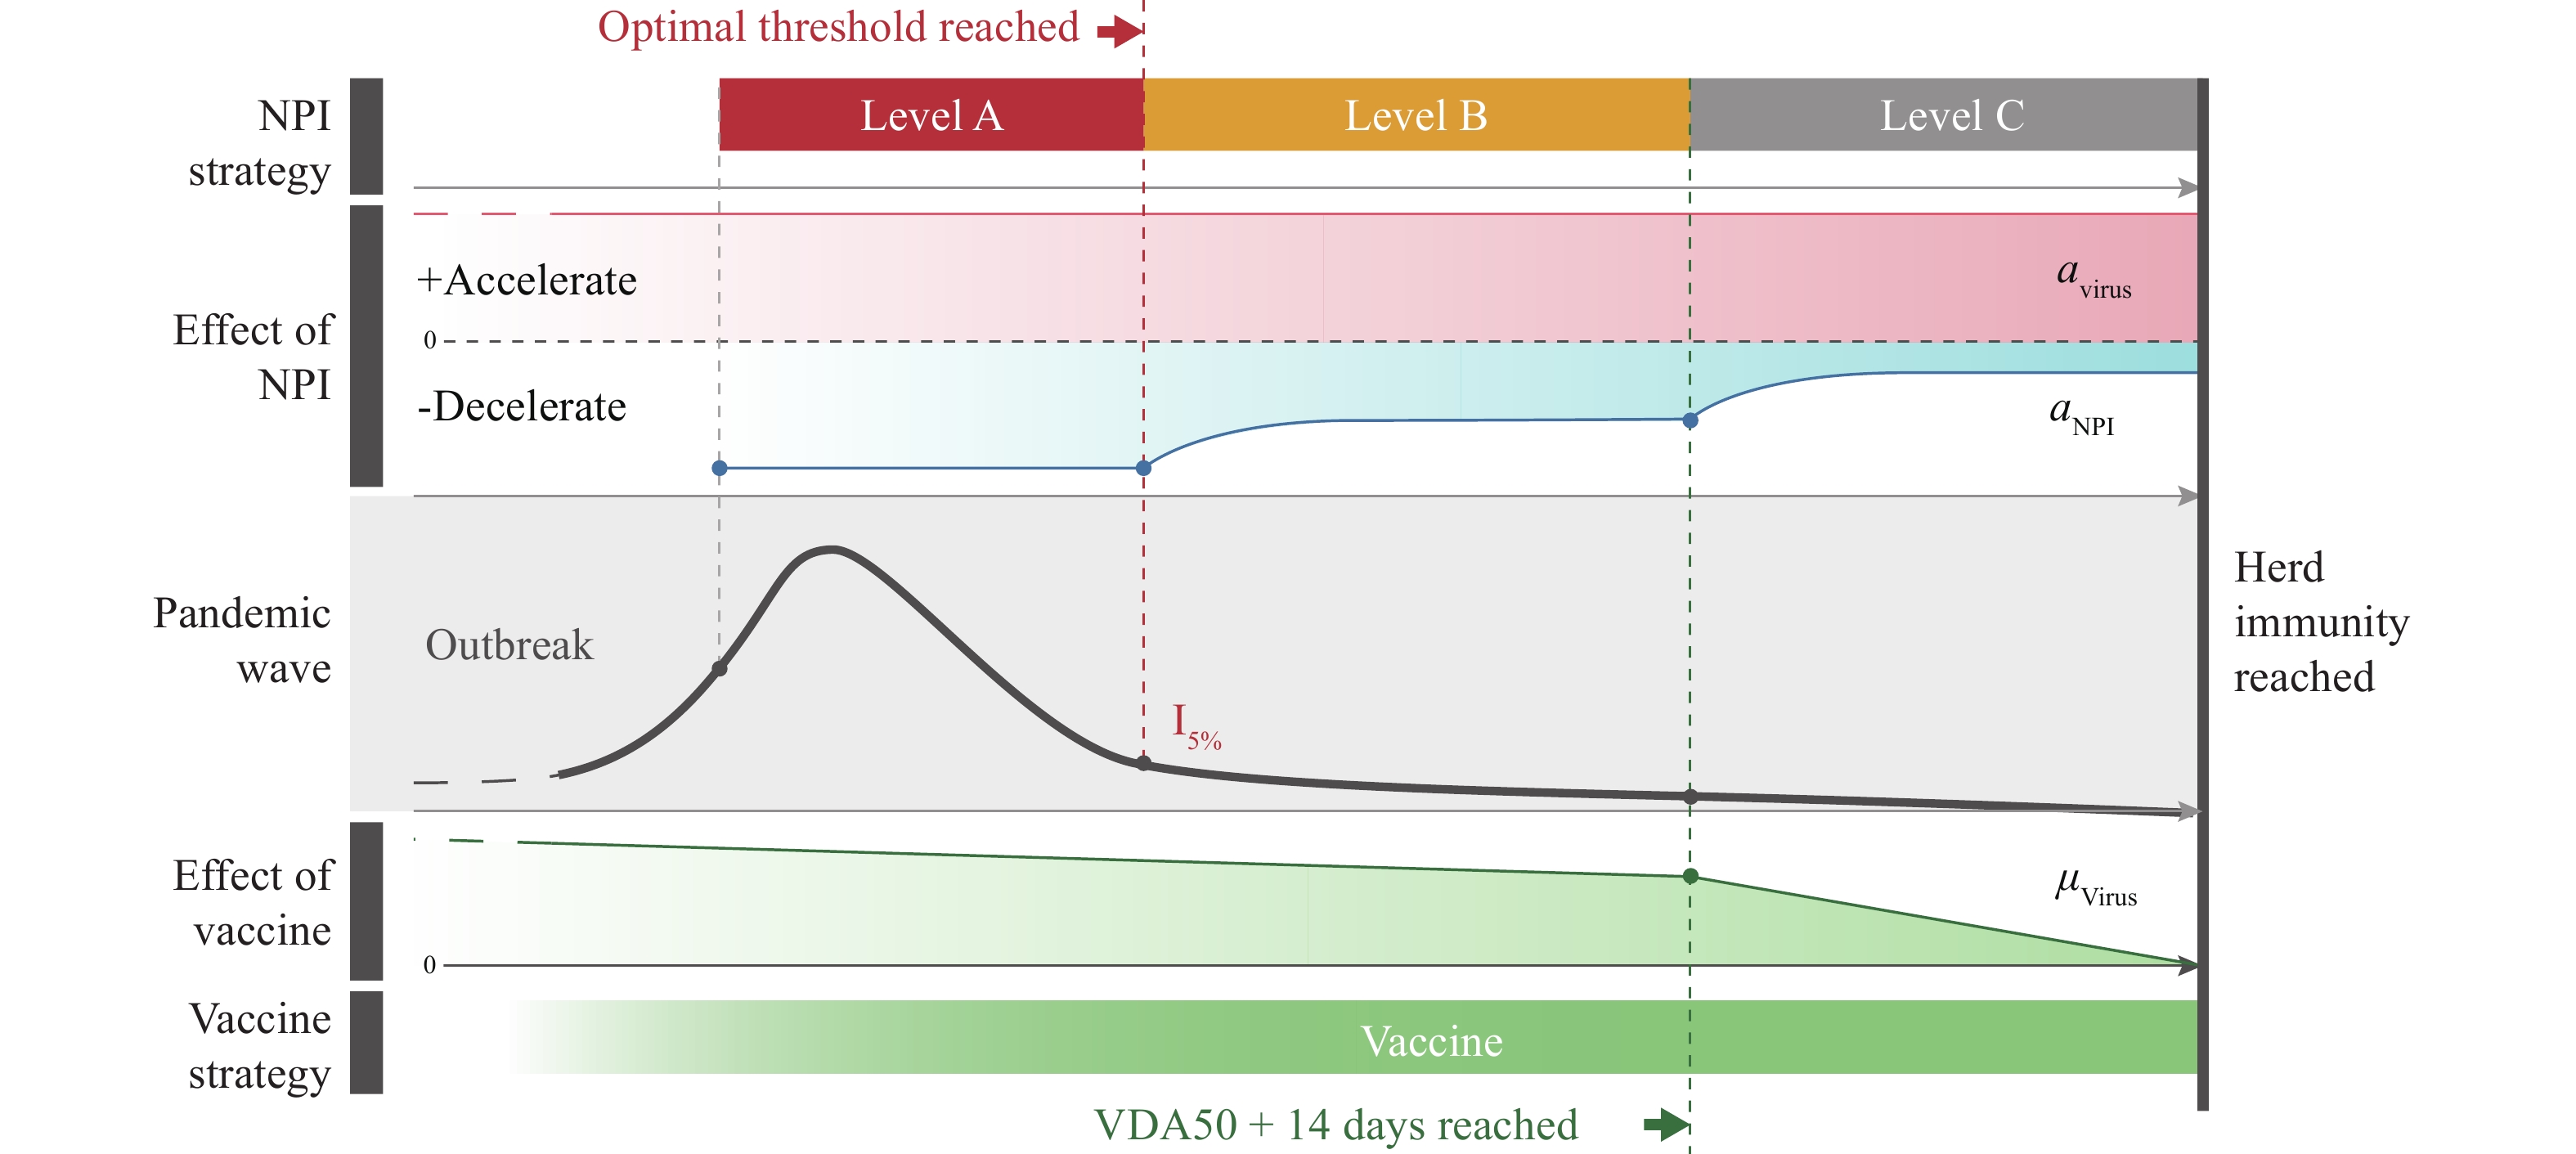 Figure 4.
Anti-contagion strategy chart on COVID-19 obtained using the Braking Force Model.
Note: I%: A parameter to predict the number of new daily cases as a percentage relative to the highest number of daily cases during the current wave of the pandemic. Abbreviation: NPI=non-pharmaceutical interventions.To achieve herd immunity, vaccinating the majority of the population is paramount. Our study found that 14 days after VDA>50, the vaccine had a remarkably decelerating effect on controlling the pandemic. In the last stage, NPIs can be made more flexible, allowing the resumption of social life to a certain extent.
According to our model, the UK is a good example that demonstrates the effectiveness of vaccination. In its previous wave from last December, a new mutant virus in addition to cold weather posed a very high risk for a serious outbreak in the UK. However, the UK government imposed a strict lockdown policy until April 1, when new infections reduced to roughly I5%. At the same time, they continued their NPI measures, such as social distancing and mask-wearing and administered a large number of vaccines. The VDA of the UK has reached 50 and the vaccination effect can be increased if the vaccination can be done within a short period of time, aiming to achieve herd immunity
Projection and recommendation of the anti-contagion policy for several countries and regions by using the Braking Force Model can be found below (Supplementary Figures S5–S6). The limitation of this model is that it provides less information during the pandemic. However, this model offers insights into the dynamics of NPIs and vaccines in the pandemic with the help of peak or wave shape data analysis, and the results are easier to understand than those provided by conventional epidemic models.
The Braking Force model presented a new paradigm to predict the evolution of the COVID-19 pandemic. The effectiveness of different NPIs and vaccination were analyzed to help policymakers perform better forecasts with the measures they chose to implement. Our results showed that NPI intervention could likely only slow down the pandemic evolution but failed to eradicate the disease. Only vaccination had a higher likelihood of ending the pandemic, starting with VDA with approximately 50 + 14 days of delay for antibody production. The UK and Israel were close to the end of the national-level pandemic situation by successfully combining NPIs and high coverage of effective vaccinations.
HTML
Braking Force Model


Classification and Forecast
Braking Force Effects of NPIs
Level A Effectiveness — Lockdown
Lockdown Example: France
Lockdown Example: Belgium
Level B Effectiveness — Mask-Wearing
Level C Effectiveness — Night Curfews and Social Distancing
Braking Force Effect of Vaccines
| Citation: |

|