Download:


-
Rising temperatures due to changing climate is a major public health concern. There is a great need to better estimate the disease burden related to temperature in China, considering changing population adaptation. A two-stage analysis was used in this study to obtain effect-modifiers in temperature-mortality relationships in 105 counties of China, then 3 united scenarios were constructed, future curves were fitted, and the numbers of attributable deaths in the 2050s and 2080s were estimated. Compared with the baseline period, the future cold effects show an upward trend, and the heat effects downward, indicating adaptability to cold would reduce while to heat would increase. The future temperature-related excess mortality was projected to increase in the 2050s and decrease in the 2080s, and cold-related mortality had a similar trend; however, heat-related mortality generally showed a continuously rising trend. Developed areas had greater cold effects and faced an increase of heat effects, while developing regions faced different situations, indicating different mitigation measures were needed. The medium-speed scenario could be the most appropriate developing scenario for China in the future, providing important sustainable policy implications.
Increasing temperatures under a changing climate are one of the major public health concerns in the 21st century. According to the Fifth Report of the Intergovernmental Panel on Climate Change (2013), the future global temperature will increase by 0.3 °C–4.8 °C under the different representative concentration paths (RCPs) by 2100. In 2070–2099, the annual averaged temperature was projected to increase by 1.9 °C–3.3 °C in China (1). China may face a larger burden of disease from a warming climate in the near future (2).
Studies have shown that human adaptability and adaptation measures can greatly affect the health effects of temperature (3). The adaptability to heat has been well-studied and will probably increase according to these previous studies, but the adaptability to cold remains unclear, although it is critical in projecting the temperature-related mortality burden (3-4). Additionally, in recent years, many studies have established a matrix of shared socioeconomic pathways-representative concentration paths (SSP-RCPs) to represent future human adaptability to temperature (5). However, there is a certain relationship between SSPs and RCPs, and each RCP in some aspects is corresponding with certain socioeconomic development pathways, and it may be unreasonable to simply use the matrix (6).
To address these gaps, this report constructed three united scenarios by linking the social economic development and climate change scenarios and projected the future mortality burden caused by high and low temperature in China under each scenario.
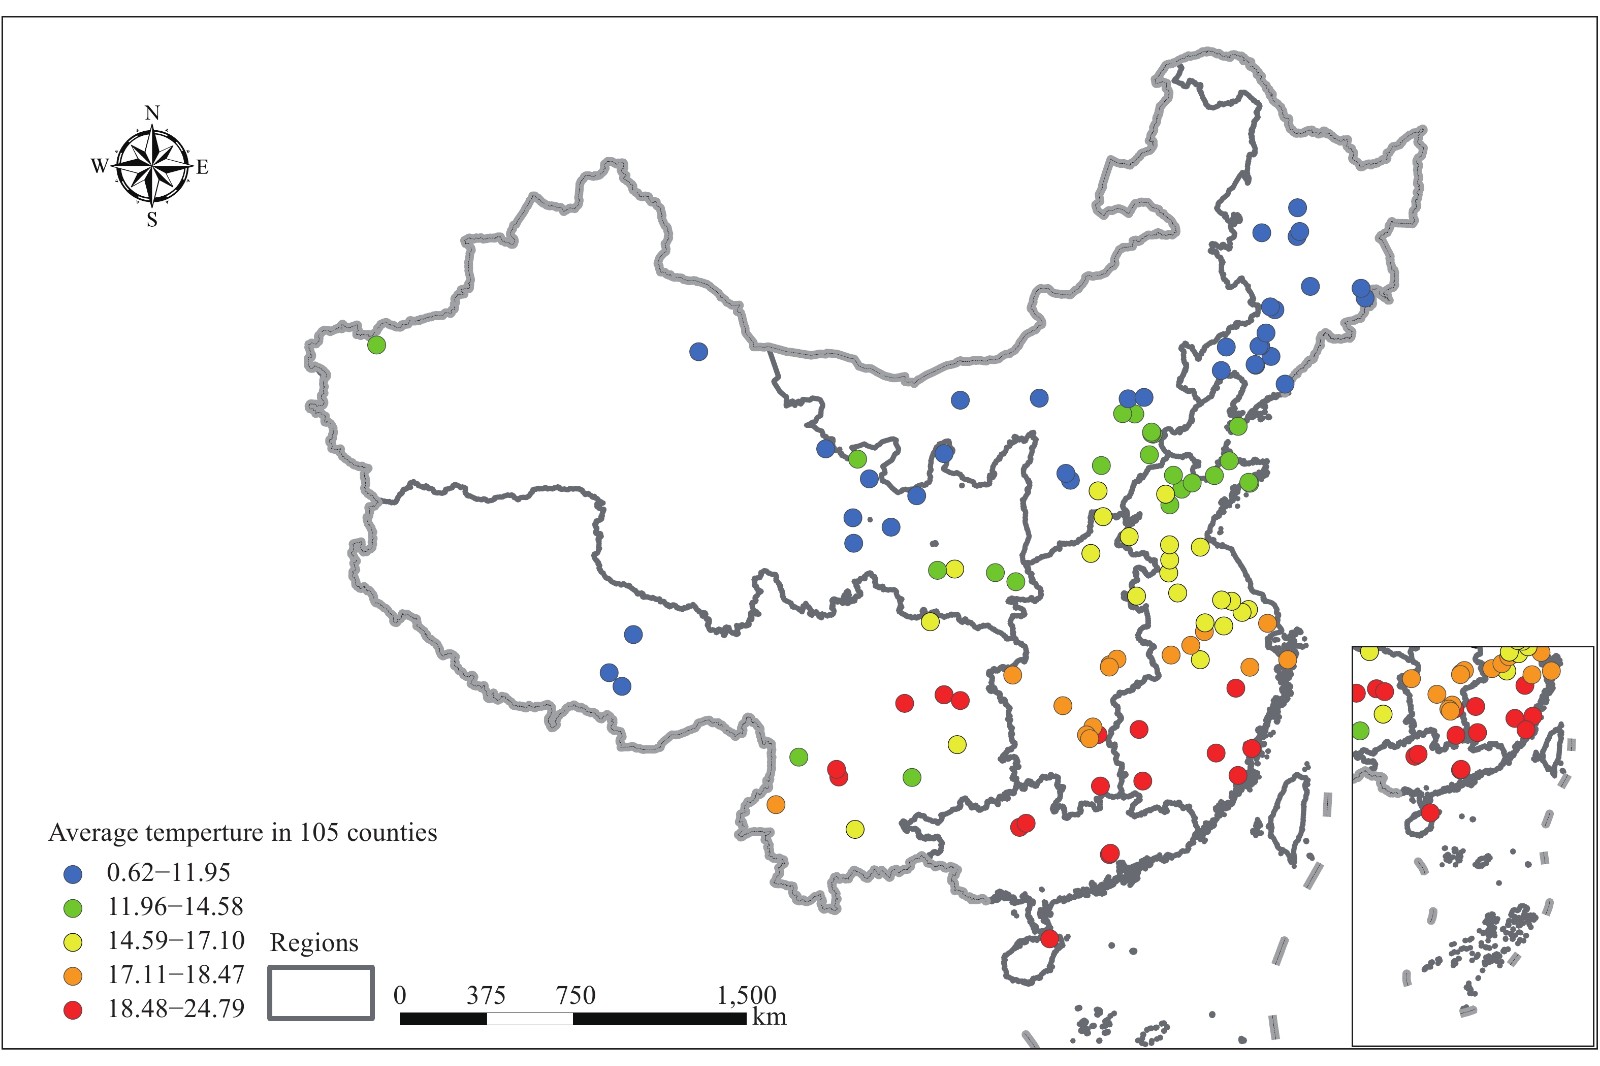
This paper included 105 counties distributed over the 7 geographical regions of the mainland of China (Supplementary Figure S1 and Supplementary Table S1) and defined the baseline period as 2013–2017 and two future periods as 2050s (2041–2070) and 2080s (2071–2099) based on the literature. This report conducted the project through three main steps (Supplementary Figure S2). First, the report modeled the exposure-response relationship between temperature and mortality in 105 counties through distributed lag nonlinear model (DLNM) and a meta-regression. Through the Wald test, Cochran Q test, and I2 in the regression, the report determined the effect modifiers, including the population size, birth rate, mortality, gross domestic product (GDP), air conditioning possession rate, heating in winter, latitude, and provinces (Supplementary Tables S2–S3). Second, predicting the temperature-morality relationship curves in the 2050s and 2080s. Three united scenarios (low, medium, and high-speed scenarios) were established by integrating the effect-modifiers and based on the mapping relationship between SSPs and the RCPs for future temperature, birth rate, mortality, and gross GDP (Supplementary Tables S4–S6, Supplementary Material). All these analyses were carried out using the packages “dlnm” and “mvmeta” in R (version 3.3.2, R Foundation for Statistical Computing, Vienna, Austria).
Item Number of days Mean SD Minimum P25 P50 P75 Maximum Daily death data Total 1,826 9.54 6.83 0 5.00 8.00 13.00 221.00 Male 1,826 5.43 4.10 0 2.00 5.00 8.00 121.00 Female 1,826 4.11 3.41 0 2.00 3.00 6.00 100.00 0–64 years 1,826 2.38 2.08 0 1.00 2.00 3.00 47.00 65–74 years 1,826 1.94 1.86 0 1.00 2.00 3.00 53.00 ≥75 1,826 5.22 4.40 0 2.00 4.00 7.00 121.00 Daily Meteorological data Mean temperature (°C) 1,826 14.26 10.94 −29.5 6.70 15.90 23.10 36.50 Maximum temperature (°C) 1,826 19.50 10.97 −24.3 11.70 21.30 28.20 42.60 Minimum temperature (°C) 1,826 9.89 11.36 −34.6 2.10 11.40 19.00 32.40 Mean relative humidity (%) 1,826 64.84 18.93 4.00 52.00 67.00 79.00 100.00 Table S1. Describe of meteorological and death data in 105 counties of China, 2013–2017.
Sensitivity analysis I2 Q (P) Core model 46.8% 977.43 (P<0.05) Add PM2.5 46.8% 993.10 (P<0.05) Change degree of time Time/df=6 48.8% 1,016.36 (P<0.05) Time/df=5 52.2% 1,087.91 (P<0.05) Add relative humidity + ns (rh/df=3) 46.9% 979.69 (P<0.05) + ns (rh/df=5) 46.8% 977.82 (P<0.05) Table S2. Sensitivity analysis of the relationship between temperature and mortality of 105 counties in China, 2013–2017.
Factors I2 Q(P) / 39.70% 838.33 (P<0.05) The total population 39.40% 842.14 (P<0.05) Birth rate 38.10% 823.47 (P<0.05) Mortality 38.20% 825.33 (P<0.05) GDP 38.70% 832.03 (P<0.05) Air-conditioning ownership 37.40% 813.23 (P<0.05) Heating 35.40% 789.22 (P<0.05) Latitude 36.00% 796.27 (P<0.05) Province 38.90% 834.68 (P<0.05) Note: “/”=meta-regression without adding any factors.
Abbreviations: GDP=gross domestic productTable S3. The result of meta-regression including different factors.
SSP RCP SSP1 4.5 SSP2 6.0 SSP3 8.5 SSP4 8.5 SSP5 / Source: Zhang J, Cao LG, Li XC, Zhan MJ, Jiang T. Advances in shared socio-economic pathways in IPCC AR5. Advances in Climate Change Research, IPCC AR5. Advances in Climate Change Research 2013;9(3):225−8. http://www.climatechange.cn/EN/Y2013/V9/I3/225. Table S4. Correlation between Shared Socio-economic Pathways (SSP) and representative concentration paths (RCP).
United Scenarios Low-speed scenario Medium-speed scenario High-speed scenario Temperature RCP8.5, 5GCMs RCP8.5, 5GCMs RCP4.5, 5GCMs Population SSP3 SSP4 SSP1 Birth rate High Medium Low Mortality High Medium Low GDP 2050s and 2080s increase by 410% and 420%, respectively 2050s and 2080s increase by 570% and 500%, respectively 2050s and 2080s increase by 660% and 680%, respectively Air conditioning possession rate 2050s and 2080s increase by 50% and 100%, respectively 2050s and 2080s increase by 100% and 150%, respectively 2050s and 2080s increase by 150% and 200%, respectively * The three colors represent low, medium, and high levels from light to dark, respectively.
Abbreviations: SSP=shared socioeconomic pathways; RCP=representative concentration pathways.Table S6. Future united scenario settings*.
Figure 1 and Supplementary Table S7 respectively showed the curves and the quantitative results between temperature and mortality at the median of the 5 general circulation models (GCM) under different united scenarios. The future cold effects were projected to increase with time, but the heat effects would decrease with time. Among the three scenarios, the future cold effects and heat effects both would be the greatest under the high-speed scenario.
Periods Scenarios Heat effects-RR (95% CI) 32 °C
(99%) vs. MMT (%)Cold effect-RR (95% CI) −15 °C
(1%) vs. MMT (%)MMT (°C) Baseline period / 17.09 (14.99, 9.23) 12.04 (9.81, 14.31) 23.8 2050s Low-speed 6.36 (5.33, 7.41) 28.16 (23.65, 32.85) 25.6 Medium-speed 6.77 (5.61, 7.95) 38.58 (32.14, 45.34) 25.4 High-speed 7.36 (6.13, 8.60) 39.39 (32.15, 47.04) 25.5 2080s Low-speed 6.47 (5.25, 7.69) 34.60 (29.55, 39.87) 24.6 Medium-speed 6.77 (5.67, 7.89) 42.13 (35.28, 49.32) 25.5 High-speed 6.35 (5.15, 7.57) 47.17 (38.17, 56.75) 25.4 Note: "/"=No scenarios in the baseline period.
Abbreviation: CI=confidence interval; MMT=the minimum mortality temperature.Table S7. The heat and cold effects in different scenarios and periods in China.
The excess mortality from temperature under all three scenarios was projected to generally increase in the 2050s and decrease in the 2080s compared with the baseline period (Figure 2 and Supplementary Figure S3). Cold-related mortality would increase in the 2050s and decrease in the 2080s under the low-speed scenario and decrease in both the 2050s and the 2080s under the medium- and high-speed scenarios. Heat-related mortality had different trends: decreasing in the low-speed scenario, and increasing in the medium- and the high-speed scenarios. Using the mid-level IPSL model and the medium-speed scenario as an example, the excess mortality from cold-and-net effects of temperature were projected to have minor changes (decrease by 5.7% and increase by 5.3%, respectively) in the 2050s and decrease by 81.7% and 46.6% in the 2080s, compared with the baseline period. The excess mortality from heat was projected to increase by 62.7% and 138.0% in the 2050s and 2080s, respectively. Taken together, the medium speed scenario was estimated to have the least temperature-related excess mortality (Supplementary Table S8). The number of cold-related mortality was generally larger than the heat-related excess mortality, except for the numbers in the 2080s under the medium and high-speed scenarios.
GCM Baseline period
(95%CI)2050s 2080s Low-speed
(95%CI)Medium-speed
(95%CI)High-speed
(95%CI)Low-speed
(95%CI)Medium-speed
(95%CI)High-speed
(95%CI)Temperature-related annual death GFDL 18,178
(14,716−21,592)26,791
(19,725−33,726)24,961
(16,850−32,905)28,219
(16,391−39,765)23,580
(17,993−29,060)12,594
(7,414−17672)15,629
(5,597−25,404)HAD 18,178
(14,716−21,592)23,057
(16,205−29,786)19,740
(11,876−27,451)21,944
(10,623−33,015)15,953
(10,852−20,967)11,922
(6,650−17,090)13,787
(3,921−23,415)MIROC 18,178
(14,716−21,592)22,945
(16,239−29,531)17,663
(10,129−25,054)19,341
(8,488−29,959)16,286
(11,176−21,306)9,499
(4,600−14,309)12,393
(3,069−21,501)NOR 18,178
(14,716−21,592)25,522
(18,559−32,357)21,057
(13,083−28,870)23,195
(11,669−34,456)18,511
(13,216−23,709)9,851
(4,802−14,805)11,619
(1,719−21,275)IPSL 18,178
(14,716−21,592)23,308
(16,596−29,899)19,136
(11,481−26,642)21,211
(10,143−32,034)16,808
(11,721−21,805)9,707
(4,740−14,582)12,456
(2,934−21,752)Cold-related annual death GFDL 15,271
(12,224−18,275)25,125
(18,428−31,692)22,701
(15,135−30,102)24,909
(13,892−35,651)22,858
(17,483−28,128)10,321
(5,712−14,833)11,808
(2,897−20,472)HAD 15,271
(12,224−18,275)19,365
(13,194−25,420)13,604
(6,831−20,235)13,251
(3,459−22,810)12,977
(8,516−17,357)5,062
(784−9,250)3
(-7,989−7,782)MIROC 15,271
(12,224−18,275)19,938
(13,808−25,953)12,076
(5,618−18,400)11,378
(2,031−20,507)13,619
(9,095−18,060)1,554
(-2,262−5,293)-1,042
(-8,570−6,293)NOR 15,271
(12,224−18,275)23,568
(17,056−29,956)18,009
(10,739−25,123)18,750
(8,259−28,987)17,187
(12,261−22,020)5,924
(1,744−10,018)5,012
(-3,417−13,213)IPSL 15,271
(12,224−18,275)20,650
(14,510−26,674)14,408
(7,719−20,956)14,413
(4,708−23,885)14,850
(10,251−19,363)2,791
(-1,139−6,641)797
(-6,994−8,383)Heat-related annual death GFDL 2,906
(2,491−3,397)1,667
(1,297−2,034)2,261
(1,715−2,803)3,310
(2,499−4,115)722
(510−932)2,273
(1,701−2,840)3,821
(2,700−4932)HAD 2,906
(2,491−3,397)3,692
(3,011−4,366)6,136
(5,045−7,216)8,693
(7,164−10,205)2,976
(2,336−3,610)6,860
(5,867−7,840)13,784
(11,910−15,634)MIROC 2,906
(2,491−3,397)3,007
(2,431−3,578)5,587
(4,510−6,654)7,962
(6,457−9,453)2,667
(2,082−3,247)7,946
(6,863−9,016)13,435
(11,639−15,208)NOR 2,906
(2,491−3,397)1,953
(1,503−2,401)3,048
(2,344−3,747)4,444
(3,411−5,469)1,323
(955−1,689)3,927
(3,058−4,787)6,606
(5,135−8,062)IPSL 2,906
(2,491−3,397)2,657
(2,086−3,225)4,728
(3,762−5,687)6,798
(5,435−8,149)1,958
(1,470−2,442)6,915
(5,879−7,941)11,658
(9,928−13,369)Abbreviation: GCM=general circulation model; GFDL=GFDL-ESM2M; HAD=HadGEM2-ES; MIROC=MIROC-ESM-CHEM ; NOR=NorESM1-M; IPSL=IPSL-CM5A-LR.. Table S8. Future temperature-related annual death number with 5 GCMs in 3 periods (baseline, 2050s, and 2080s) in China under 3 united scenarios (the low, medium, and high-speed scenarios).
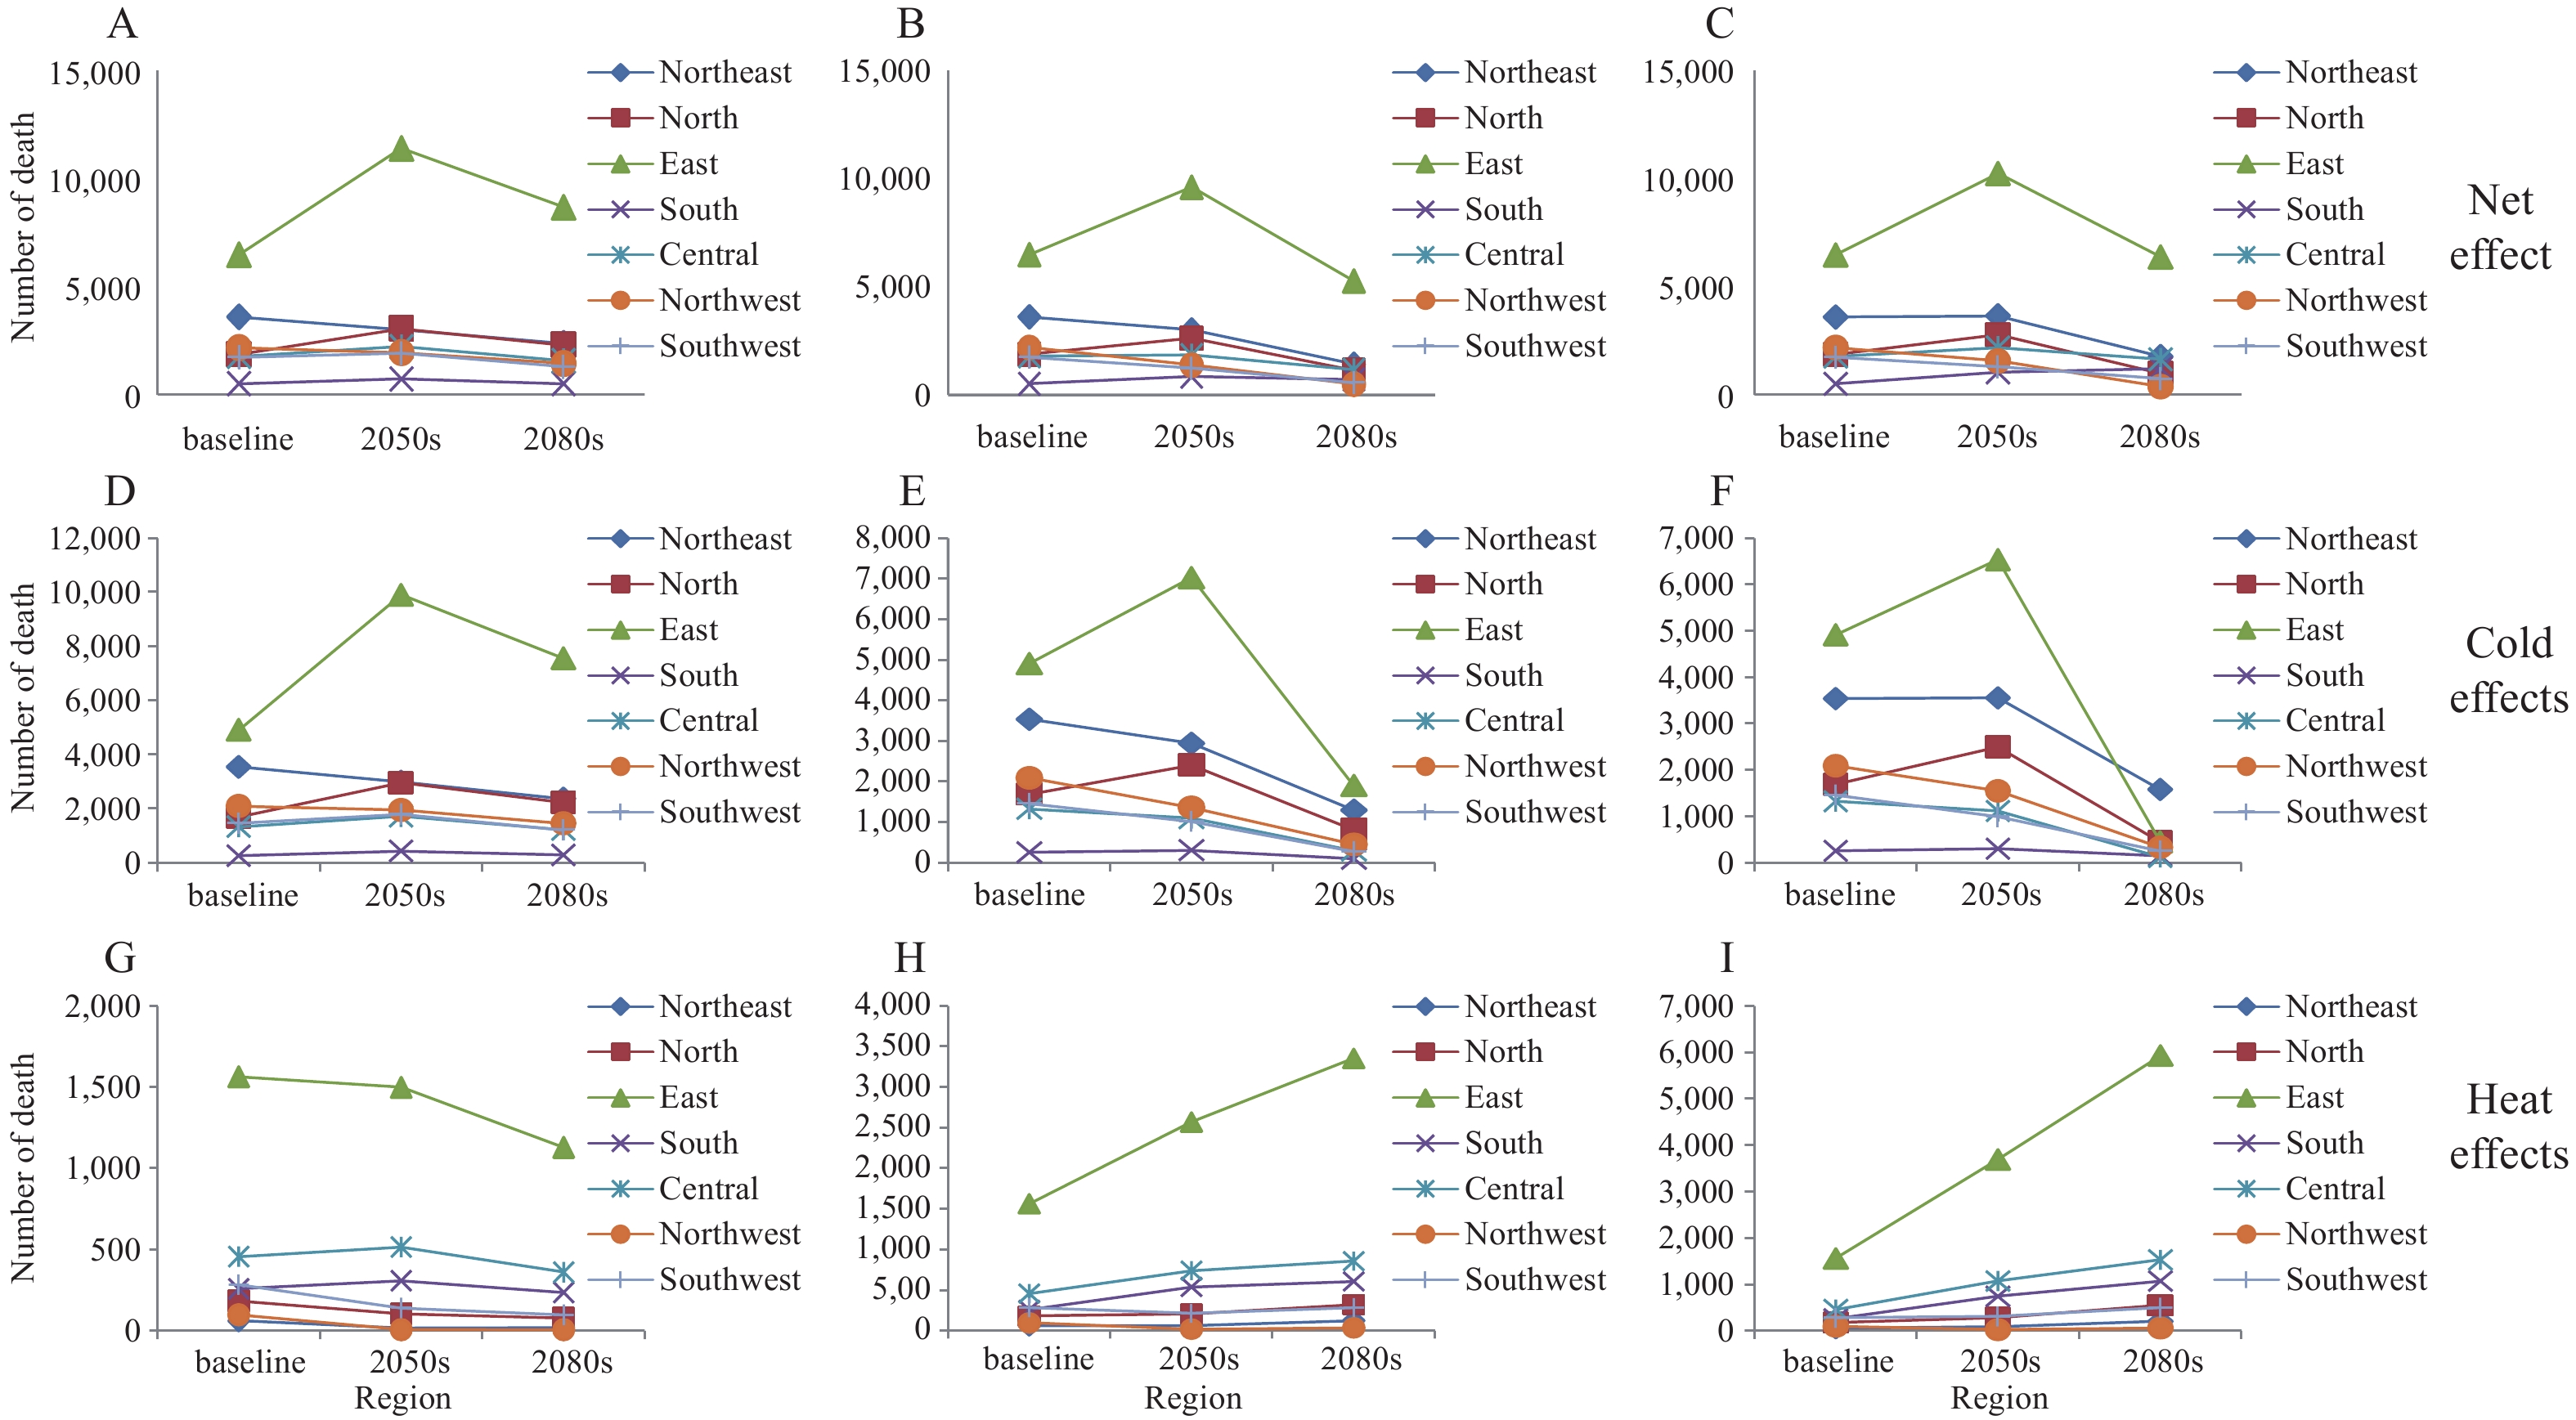
The temperature-related excess mortality would increase in the 2050s and decline in the 2080s (the East, the North, and the Central) or keep decreasing (Northeast, Northwest, and Southwest), and all the regions have the temperature-related excess mortality decreasing at last, except for South China, where it shows a rising trend (Figure 3, Supplementary Figure S4, and Supplementary Table S9).
Regions Baseline period
(95%CI)2050s 2080s Low-speed
(95%CI)Medium-speed
(95%CI)High-speed
(95%CI)Low-speed
(95%CI)Medium-speed
(95%CI)High-speed
(95%CI)Temperature-related annual death Northeast 3,601
(2963−4,229)3,008
(2,348−3,653)3,004
(2,211−3,776)3,647
(2,488−4,770)2,380
(1,880−2,869)1,419
(899−1,925)1,783
(730−2,802)North 1,872
(1,528−2,212)3,062
(2,218−3,889)2,613
(1,642−3,562)2,784
(1,403−4,128)2,305
(1,685−2,912)1,132
(488−1,762)997
(-290−2,247)East 6,476
(5,252−7684)11,400
(7,982−14,758)9,601
(5,542−13,584)10,230
(4,422−15,915)8,683
(5,996−11,323)5,256
(2,599−7,866)6,378
(1,342−11,304)South 516
(398−632)738
(541−933)843
(593−1,090)1,049
(718−1,376)520
(368−670)706
(529−880)1,223
(917−1,525)Central 1,783
(1,443−2,118)2,231
(1,600−2,851)1,840
(1,149−2,519)2,191
(1,130−3,230)1,582
(1,110−2,046)1,154
(705−1,596)1,654
(817−2,473)Northwest 2,189
(1,771−2,601)1,958
(1,431−2,474)1,381
(867−1,883)1,580
(777−2,361)1,457
(1,071−1,835)489
(182−789)388
(-232−991)Southwest 1,741
(1,362−2,116)1,928
(1,346−2,501)1,231
(680−1,772)1,303
(524−2,066)1,300
(880−1,714)559
(239−873)753
(166−1,328)Cold-related annual death Northeast 3,538
(2,915−4152)2,990
(2,337−3,629)2,942
(2,169−3,694)3,555
(2,426−4,649)2,361
(1,869−2,841)1296
(805−1773)1576
(575−2542)North 1,689
(1,375−1,999)2,957
(2,140−3,758)2,406
(1,486−3,304)2,495
(1,186−3,770)2,227
(1,631−2,811)811
(230−1379)444
(-732−1584)East 4,912
(3,900−5,910)9,900
(6,796−12,946)7,029
(3,495−10,491)6,533
(1,473−11,478)7,553
(5,141−9,921)1900
(-213−3972)444
(-3637−4424)South 257
(181−333)430
(295−563)305
(158−449)301
(112−487)284
(186−380)98
(18,177)151
(12,288)Central 1,326
(1,048−1,600)1,715
(1,174−2,246)1,100
(537−1,652)1,114
(241−1,968)1,220
(822−1,611)297
(-30−618)121
(-502−730)Northwest 2,091
(1,690−2,487)1,950
(1,425−2,464)1,362
(854−1,859)1,550
(756−2,323)1,451
(1,068−1,827)454
(156−746)329
(-277−916)Southwest 1,458
(1,116−1,795)1,788
(1,233−2,334)1,016
(509−1,515)991
(275−1,693)1,203
(805−1,593)275
(2−543)251
(-253−745)Heat-related annual death Northeast 62
(47−77)18
(11−25)62
(41−82)92
(62−121)20
(11−28)123
(94−152)207
(155−260)North 183
(153−213)105
(78−131)207
(156−258)288
(217−359)78
(55−101)321
(258−383)553
(442−664)East 1,564
(1,351−1,775)1,500
(1,186−1,812)2,572
(2,047−3,093)3,697
(2,949−4,437)1,129
(855−1,401)3,356
(2,812−3,895)5,934
(4,978−6,879)South 259
(218−299)308
(246−370)539
(435−642)748
(606−889)236
(182−290)607
(511−702)1,072
(905−1,237)Central 457
(395−518)516
(426−605)740
(612−867)1,077
(889−1,262)362
(289−435)858
(735−978)1,532
(1,319−1,743)Northwest 98
(82−115)8
(5−10)19
(13−24)29
(21−38)6
(4−8)35
(27−43)60
(45−75)Southwest 284
(246−321)140
(113−167)214
(171−257)311
(249−373)98
(75−120)284
(237−330)501
(419−583)Table S9. Future temperature-related annual deaths in 3 periods (baseline, 2050s and 2080s) in 7 regions of China under 3 united scenarios (the low, medium, and high-speed scenarios).
HTML
-
This report offers a comprehensive characterization of human adaptability and excess mortality burden of temperature across various regions of China in three future united scenarios, which fully considered the mapping relationships between the demographic characteristics of China and the SSPs, which provide more realistic estimates than previous studies.
The finding of an increase in heat adaptability is consistent with numerous previous studies (7-9), which may be caused by changes or differences in human physiological mechanism adjustment (3), socioeconomic development, the usage rate of air conditioning, and early warning systems (10-11). However, our study also indicated a declining trend in cold adaptability, which has not been reported before. Along with global warming, heat adaptability is increasing, and at the same time, cold adaptability may decrease due to reduced exposure to cold environments (6).
The report also found a generally increasing trend of heat-related excess mortality, and the cold-related and the total excess mortality were generally increasing in the 2050s and followed by a more obvious decrease in the 2080s. The trend is inconsistent with previous studies in the US, Europe, and the Republic of Korea (5,12). The inconsistency may be due to the differences in the sets of adaptation scenarios. Gosling et al. found that the adaptive modeling is a key part of future temperature-related mortality risk projection studies (3-4). Compared with previous studies, this report introduced more socioeconomic variables as adaptation indicators that may modify the temperature-mortality relationship, and the report fully considered the mapping relationship between birth rate, mortality, and SSP, and constructed three united scenarios instead of a simple matrix of the SSPs and RCPs.
There were differences in the changing trends of the temperature-related excess mortality in different geographical regions of China under different united scenarios, which may be caused by both temperature and socioeconomic differences. First, the northwestern, southwestern, and northeastern regions have relatively lower temperatures, but the temperature will rise along with global warming, more attention should be paid to the disease burden caused by high temperatures in the future. Second, Central China, South China, North China, and East China generally had higher development levels, better medical resources, and better resilience to health risks from temperature changes. In these regions, it is worth paying attention to both the high and low temperatures in the 2050s, and more attention should be paid to the impact of heat in the 2080s. South China should prioritize responding to the health risk associated with temperatures, as it is the only region in China that has the temperature-related mortality increasing in all three scenarios.
This study was subject to some limitations. First, the estimation relied heavily on future projection data, which brought some uncertainties. Second, this projection did not consider the change of population age structure, so the future mortality burden due to high and low temperature might be underestimated as China is experiencing a stage of population aging and the elderly are more vulnerable to non-optimal temperatures. Future studies should pay attention to these aspects and provide more insights for policymaking.
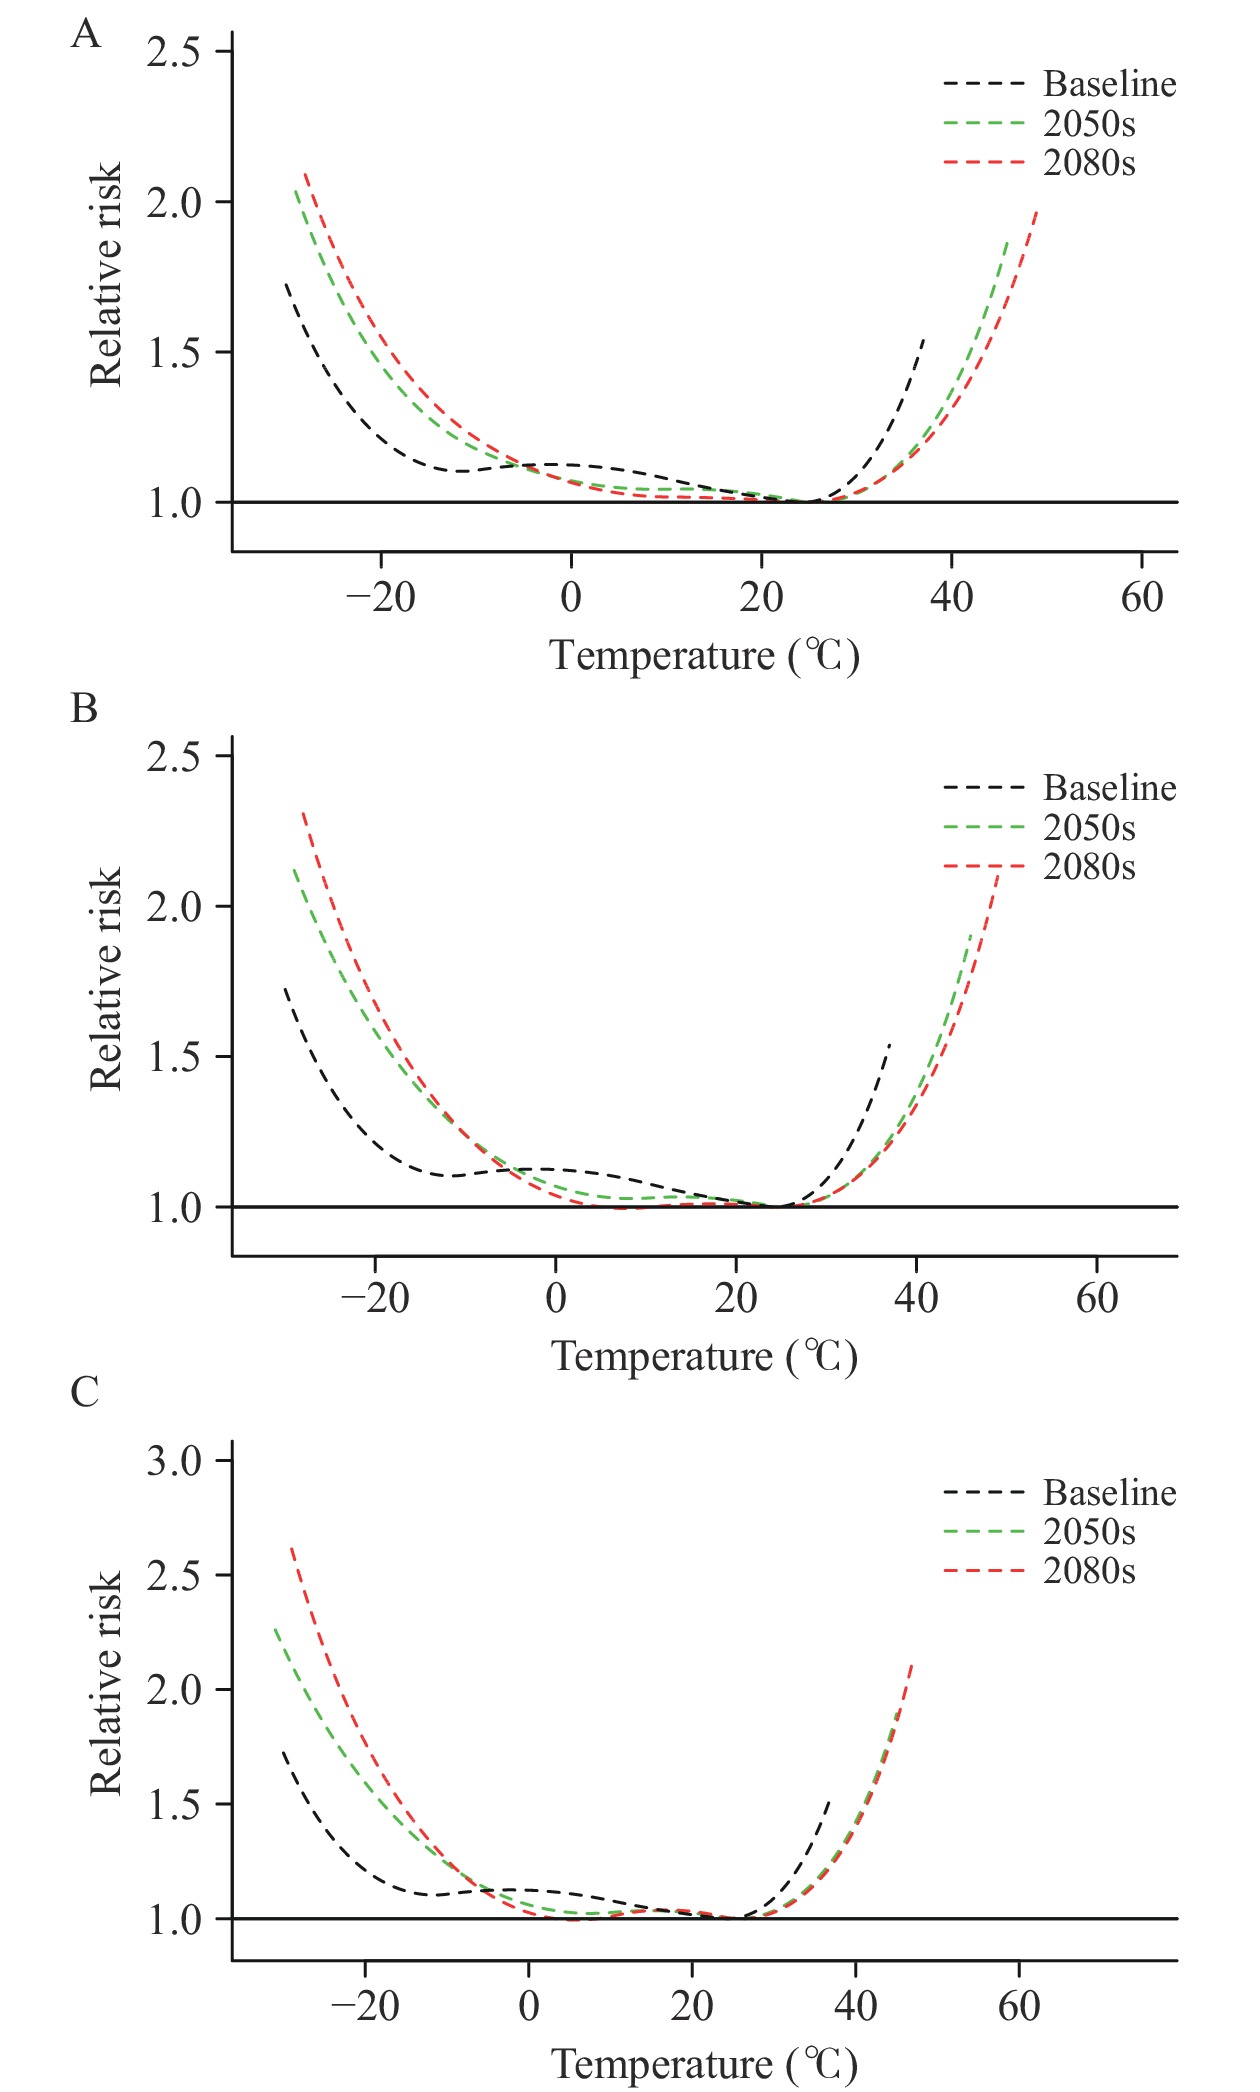 Figure 1.
Future relationships between temperature and mortality in three periods (baseline, 2050s, and 2080s) in China under 3 united scenarios. (A) The low-speed scenario; (B) The medium-speed scenario; (C) The high-speed scenario.
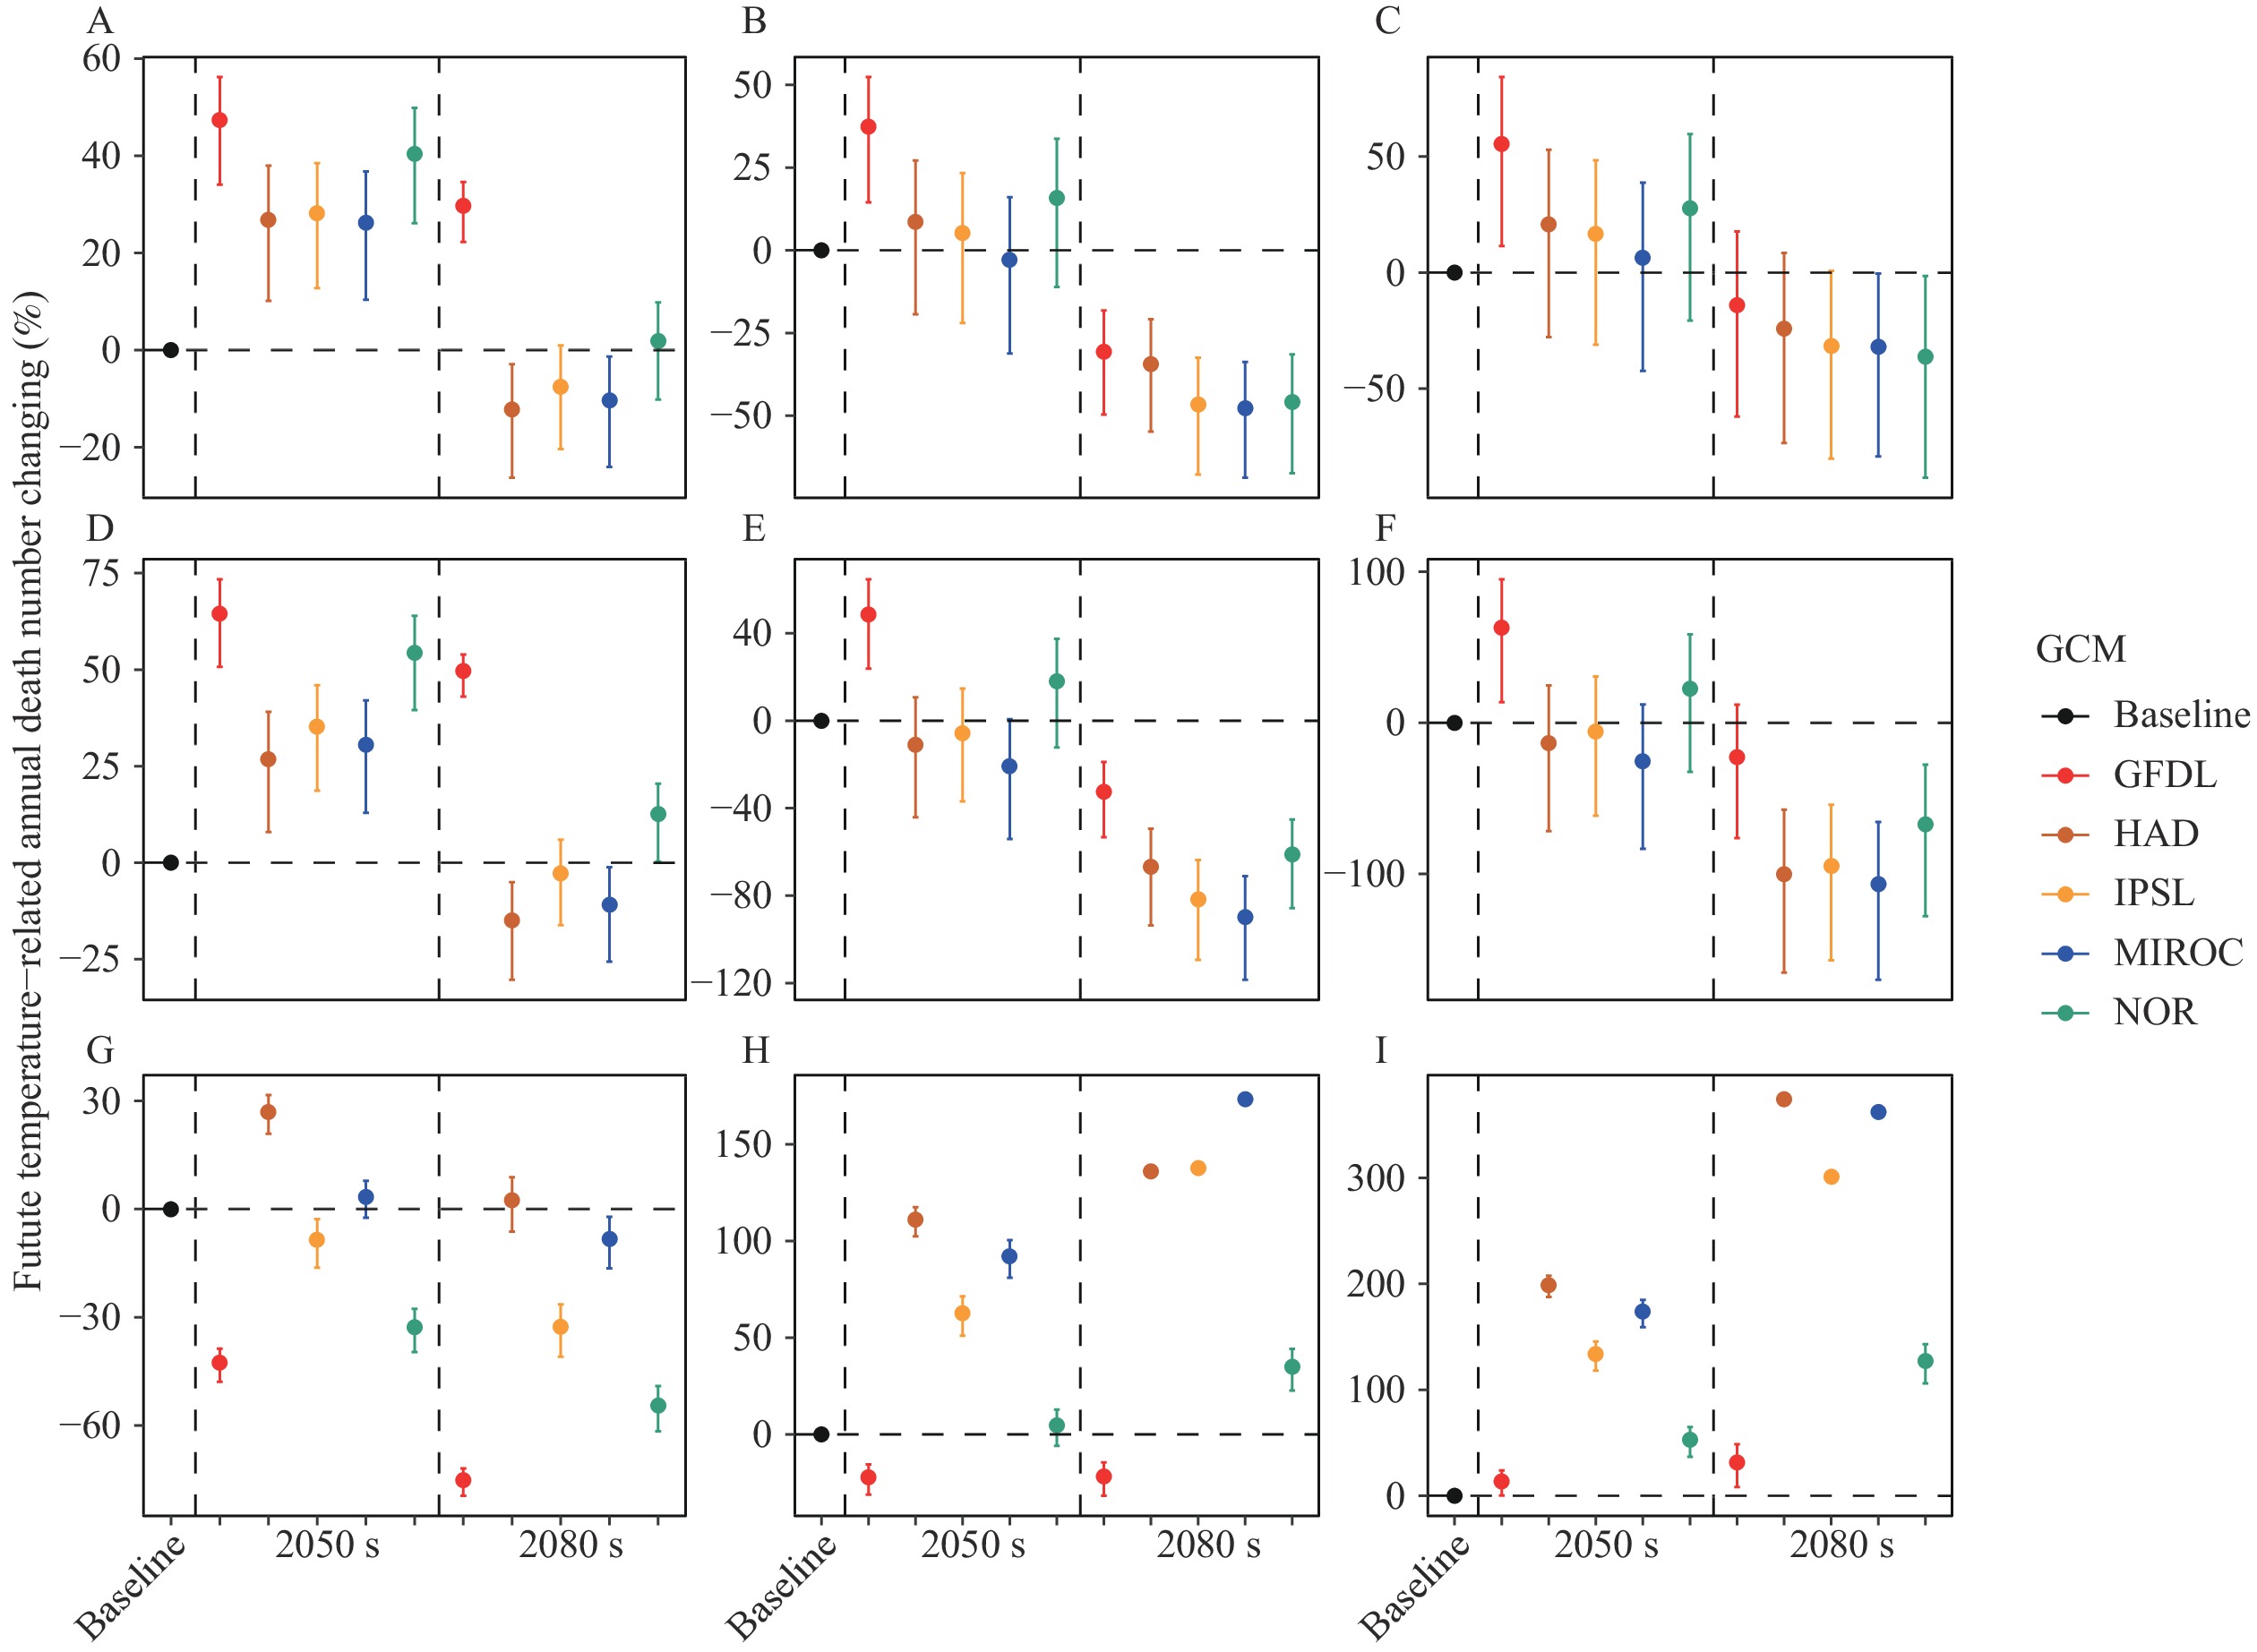 Figure 2.
Changes (%) in projected annual death number caused by temperature in 3 periods (baseline, 2050s, and 2080s) in China under three united scenarios. (A) Net effect under low-speed scenario; (B) Net effect under medium-speed scenario; (C) Net effect under high-speed scenario; (D) Cold effect under low-speed scenario in China; (E) Cold effect under medium-speed scenario; (F) Cold effect under high-speed scenario in China; (G) Heat-effect under low-speed scenario; (H) Heat-effect under medium-speed scenario; (I) Heat-effect under high-speed scenario.
Abbreviations: GCM=general circulation model; GFDL=GFDL-ESM2M; HAD=HadGEM2-ES; MIROC=MIROC-ESM-CHEM; NOR=NorESM1-M; IPSL=IPSL-CM5A-LR.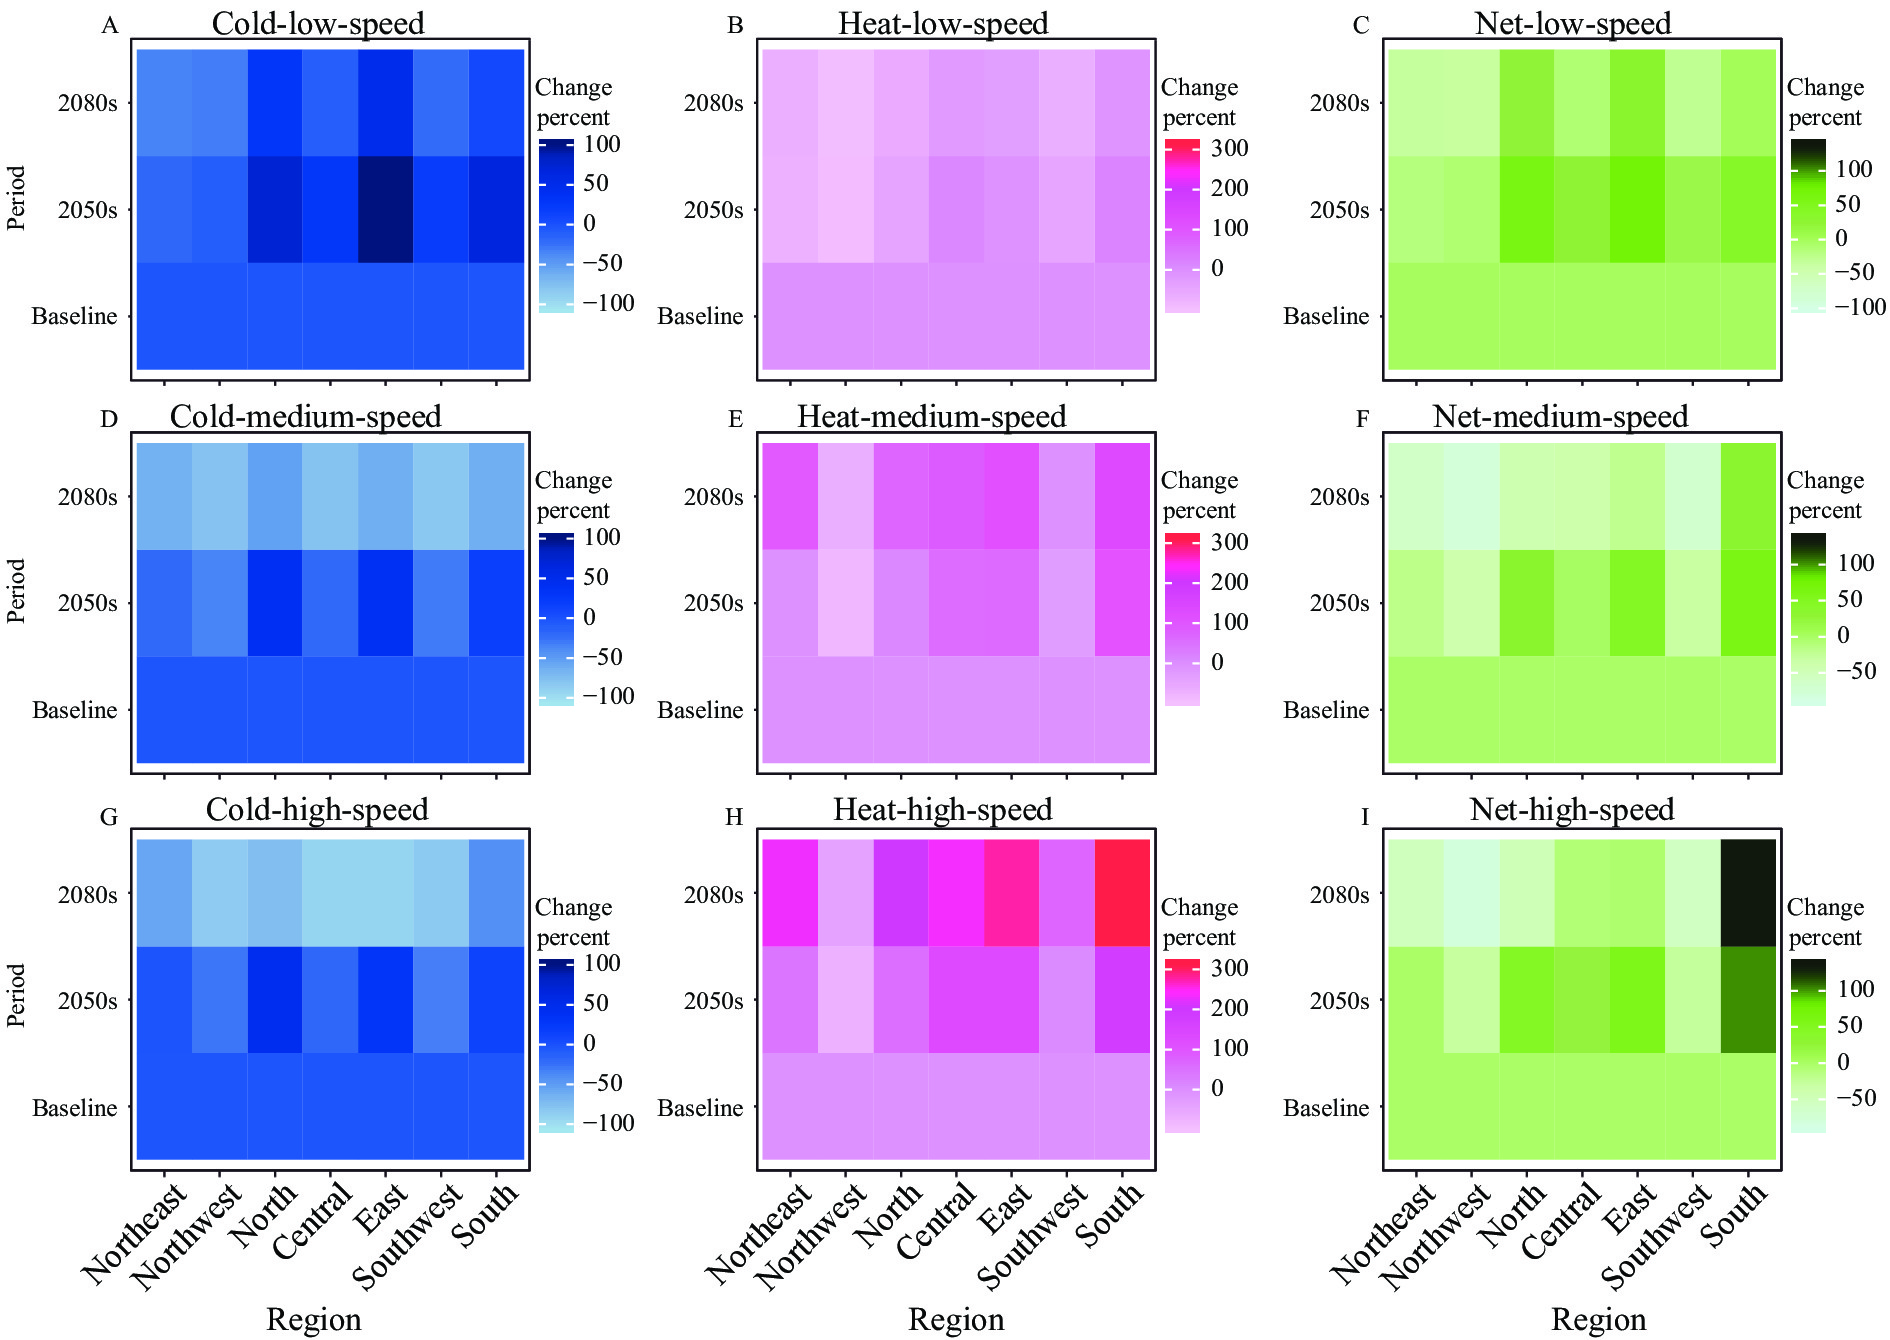 Figure 3.
Changes (%) in temperature-related annual death number in seven regions of China in 3 periods (baseline, 2050s, and 2080s) under 3 united scenarios. (A) The cold-related mortality burden under the low-speed scenario; (B) The heat-related mortality burden under the low-speed scenario; (C) The temperature-related mortality burden under the low-speed scenario; (D) The cold-related mortality burden under the medium-speed scenario; (E) The heat-related mortality burden under the medium-speed scenario; (F) The temperature-related mortality burden under the medium-speed scenario; (G) The cold-related mortality burden under the high-speed scenario; (H) The heat-related mortality burden under the high-speed scenario; (I) The temperature-related mortality burden under the high-speed scenario.
In summary, the findings of this report suggest that the temperature-related excess mortality was projected to increase in the 2050s and decrease in the 2080s. Heat adaptability was projected to increase in the future, but along with rising temperatures, the heat-related excess mortality showed a continuously rising trend, except for low-speed scenarios; although the mortality burden due to the cold was projected to decrease in the nearer future, it might not keep declining in the long run due to the decreasing cold-adaptability, which deserves more attention. Different regions would need different adaptation policies according to the patterns of temperature-related health risk and considering the differences in geographic, climate, demographic, and economic characteristics.
| Citation: |

|