

 Download:


-
Norovirus is the main pathogen responsible for sporadic cases and outbreaks of acute gastroenteritis worldwide (1), and it often causes outbreaks in schools and kindergartens (2-3). Contact with a contaminated environment is the main transmission mode of this virus, but relatively few studies focus on environmental contamination during norovirus outbreaks across a large number of schools and kindergartens (4-6). This study included 45 norovirus outbreaks in schools and kindergartens with environmental positive specimen in Beijing from October to December 2020, among which 44 outbreaks were caused by person-to-person transmission. The environmental detection rate of norovirus was 17.54% in these 44 outbreaks, in the residence of key patients (including initial patients and index patients), the highest norovirus detection rate was found from housewares (e.g., toys, TV remotes, and desk lamps) at 31.25%, and the lowest cycle threshold (Ct) value was found in a door handle sample at 19.59. In the school buildings, the highest norovirus detection rate was found in the lavatory and flush button samples (26.79%), and the lowest Ct value (18.65) was found in a stair handrail sample. These locations are most likely to be contaminated by the virus during norovirus outbreaks, and it is necessary to clean and disinfect these key locations purposefully.
The epidemiological investigation of norovirus outbreaks in schools and kindergartens was conducted in Beijing from October to December 2020. A swab dipped in the solution from a virus sampling tube was smeared on the environmental surface. The sampling locations included the residence of key patients, school buildings, and school canteens. The sampling sites included lavatory and flush buttons, door handles, housewares, cleaning tools, and related items. Noroviruses were detected and genotyped using the real time reverse transcription polymerase chain reaction detection kit (Bioperfectus Ltd., Taizhou, China) according to the manufacturer’s protocol. Statistical analyses were performed using SPSS software (version 19.0, IBM, Chicago, IL, USA). Chi-squared tests were used to compare the norovirus detection rates from different sites, and the Kruskal-Wallis H-test was used to compare the median Ct values from different sites; P-values of <0.05 were considered to indicate statistical significance.
Environmental samples were collected in all norovirus outbreaks in schools and kindergartens, among which these 45 outbreaks had positive environmental samples. The median number of individuals affected per outbreak was 9 [interquartile range (IQR): 5–16]. The most common transmission mode was person-to-person (97.78%, 44/45), and food-borne transmission occurred in 1 outbreak. Only 1 outbreak was caused by genogroup I noroviruses, and the other 44 outbreaks were caused by genogroup Ⅱ noroviruses.
A total of 707 environmental samples were collected from the 44 norovirus outbreaks with person-to-person transmission. For these, the total norovirus detection rate was 17.54% (124/707), with a 22.41% (65/290) detection rate for samples from the residence of key patients and a 17.88% (59/330) detection rate for samples from the school buildings, norovirus was not detected in samples from the school canteens, a statistical difference was found between these detection rates (χ2=238.095, P<0.001) and the pair-to-pair comparison showed that there was no significant difference between the norovirus detection rates for samples from the school buildings and from the residence of key patients (χ2=1.984, P=0.159). In the residence of key patients, the 3 sites with the highest norovirus detection rates were housewares (31.25%), lavatory and flush buttons (30.00%), and desktops and floors (28.57%). In the school buildings, these sites were lavatory and flush buttons (26.79%), washing facilities (19.61%), and desktops and floors (19.57%) (Table 1). In the food-borne transmission outbreak, a total of 83 environmental samples were collected from the school canteen and staff dormitory. Only 1 sample was norovirus-positive (from the door handle of the kitchen staff dormitory; Ct value: 39.49), yielding a norovirus detection rate of 1.20%.
Sampling site Sampling number Positive number (%) Residence of key patients 290 65(22.41%) Housewares* 32 10(31.25%) Lavatory and flush buttons 60 18(30.00%) Desktops and floors 14 4(28.57%) Cleaning tools and drains† 42 9(21.43%) Kitchen utensils§ 41 8(19.51%) Faucet handles 39 7(17.95%) Door handles 47 8(17.02%) Water cups and tablewares 15 1(6.67%) School buildings 330 59(17.88%) Lavatory and flush buttons 56 15(26.79%) Washing facilities¶ 51 10(19.61%) Desktops and floors 46 9(19.57%) Handles and handrails 62 10(16.13%) Housewares 44 7(15.91%) Cleaning tools and drains 53 7(13.21%) Drinking water facilities** 18 1(5.56%) School canteens 87 0(0%) Dining car and dining environment 4 0(0%) Handles 13 0(0%) Lavatory 8 0(0%) Cleaning tools and drains 21 0(0%) Food processing tools†† 24 0(0%) Cleaning facilities 17 0(0%) Total 707 124(17.54%) * Housewares included toys, remote controls, towels, beds, chairs, washing machines, lamps, and other related items.
† Cleaning tools and drains included brooms, dustpans, mops, rags, sewers, and other related items.
§ Kitchen utensils included chopping boards, kitchen knives, washing bowls, and the refrigerator inner wall.
¶ Washing facilities included faucet handles, hand sanitizer buttons, wash basins, and other related items.
** Drinking water facilities in school buildings included water dispensers, hot buckets, and other related items.
†† Food processing tools included kitchen knives, chopping boards, cooking spoons, rolling pins, operating tables, and other related items.Table 1. Norovirus detection rates at different environmental sites in schools and kindergartens in Beijing, October–December 2020.
Ct values were obtained for 102 norovirus positive samples. Regarding samples from the residence of key patients, the lowest Ct value (19.59) was found in a door handle sample. Of the median Ct values in 8 sites, the lowest one was door handles (32.09, IQR: 30.78–36.03), and there was no statistical difference among the median of these Ct values (χ2=7.698, P=0.360) (Figure 1). Regarding samples from school buildings, the lowest Ct value (18.65) was found in a stair handrail sample. Of the median Ct values in 7 sites, the lowest one was lavatory and flush buttons (34.18, IQR: 33.02–37.07), and there was no statistical difference among the median of these Ct values (χ2=1.503, P=0.959) (Figure 2).
 Figure 1.
Ct values of norovirus at different environmental sites in the residence of key patients in Beijing, October–December 2020.
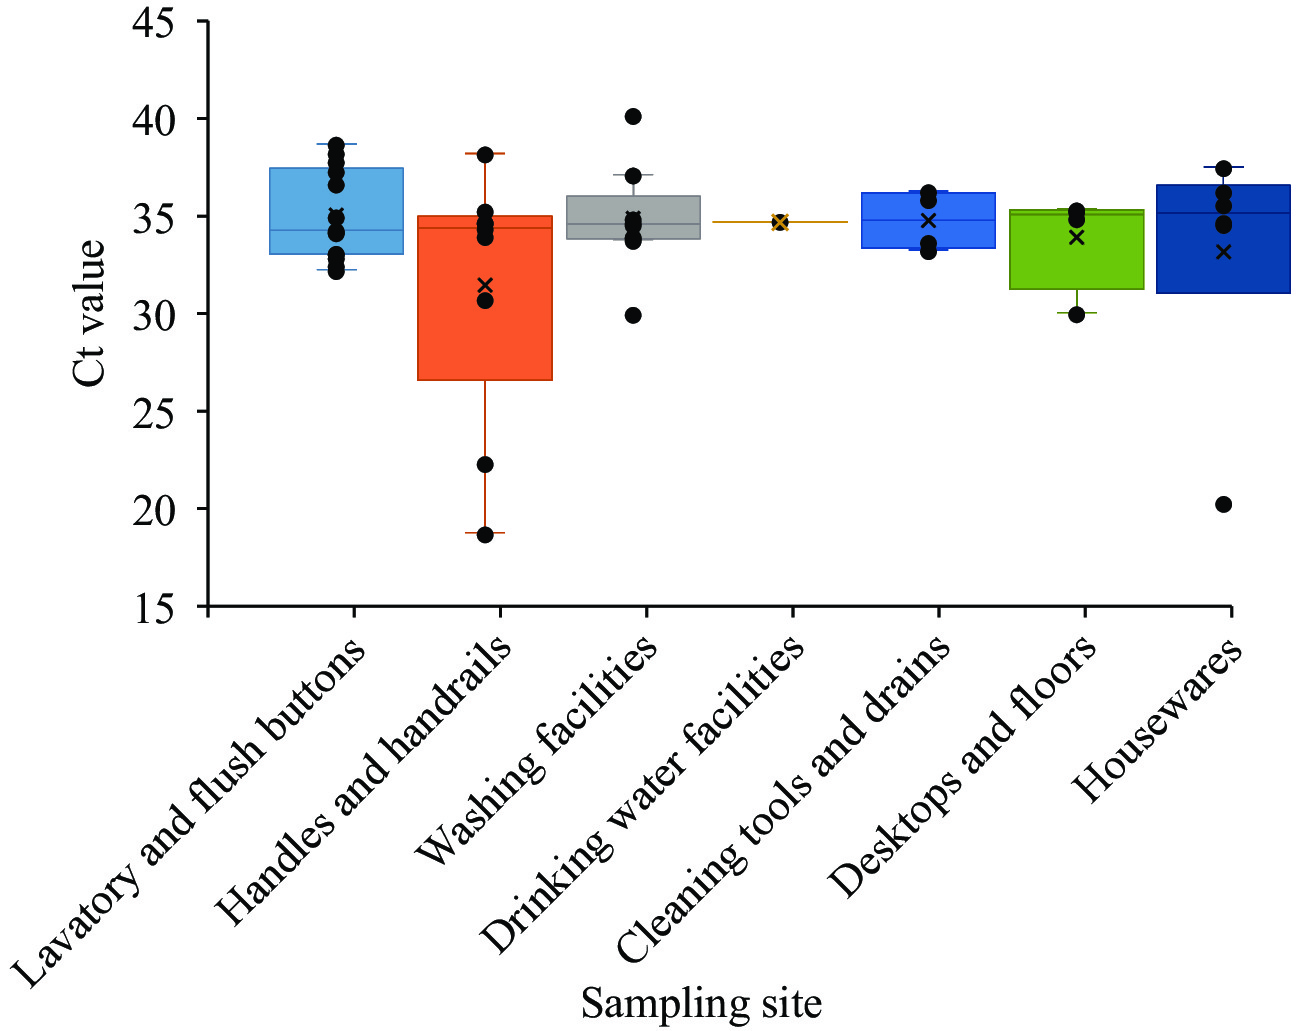 Figure 2.
Ct values of norovirus at different environmental sites in school buildings in Beijing, October–December 2020.
HTML
-
Our results showed that a high-level of environmental contamination occurred during norovirus outbreaks in schools and kindergartens in Beijing from October to December 2020. The highest norovirus detection rate was found from the housewares in the residence of key patients, and the highest norovirus detection rate was found from the lavatory and surrounding environments in the school buildings. The sample from door handle and stair handrail had the lowest Ct values in the residence of key patients and the school buildings, respectively.
Compared with environmental contamination of the school canteens, the locations that residence of key patients and the school buildings were more severe. The findings were similar to reports from norovirus outbreaks in houseboats in Arizona described by Jones et al. (7). This might be explained by the cleaning procedures of kitchen staff, helping to reduce environmental contamination in school canteens.
In the residence of key patients, the highest norovirus detection rate was found from housewares, and the second highest detection rate was found from lavatory and flush buttons. This may indicate that, in the residence of key patients, people do not pay as much attention to hand hygiene as they do outside, and their hands often touch the surfaces of objects increasing the range of contamination, at the same time the cleaning and disinfection of housewares surfaces are often ignored. Therefore, it is important not only to disinfect the lavatory and surrounding environments, but also to clean and disinfect housewares surfaces at home. When disinfecting different objects (such as textiles, hard surfaces, and toilets), different methods are suggested and chlorine disinfectants are priority when applicable. In school buildings, the highest norovirus positive detection rate was found from the lavatory and surrounding environments (e.g., flush button, sink faucet, and hand sanitizer button), which was consistent with the norovirus contamination results from two norovirus outbreaks in kindergartens in Jingmen City of Hubei Province (4). Norovirus is usually excreted in feces during norovirus outbreaks, which may lead to contamination of the lavatory environment in school and kindergarten.
The Ct value can reflect the severity of contamination, with lower Ct values representing higher viral loads and correspondingly more serious levels of environmental contamination. Among the samples collected from the residence of key patients and school buildings, those from door handles and stair handrails had the lowest Ct value, suggesting that both may be an important contributor to norovirus transmission. This finding was consistent with the results of Rico et al. (8), who evaluated the environmental contamination in norovirus outbreaks in the Barcelona region between January 2017 and March 2019, in which they found that norovirues were most frequently detected on toilet handles and handrail bars. Therefore, locations where the hands often touch, such as door handles and stair handrails should be disinfected regularly during norovirus outbreaks.
This study was subject to some limitations. First, some factors could affect detection rates and Ct values such as the level of virus shedding of the patients, the contact frequencies by the patients of the sites where the environmental samples were collected, and the sample collection process that could not include all contaminated sites. Second, some PCR inhibitors existed in the environments, which could have affected the test results. Third, Ct values of some positive sites were not reported, so there may be some bias. Further research, such as conducting gene sequencing of the noroviruses in environmental samples, estimating the duration of contamination, and evaluating the disinfection effect, is needed.
This article provided evidence describing the locations and environmental sites that were most likely to be contaminated by the virus during norovirus outbreaks. These results could instruct professionals and the public to sample and disinfect the environment properly, and it is helpful to formulate a sampling, cleaning and disinfection workflow for the disposal of norovirus outbreak.
Acknowledgments: District-level CDCs of Beijing Municipality.
| Citation: |

|