

 Download:


-
The future trend of a population is an outcome of the interactive dynamics between its existing age structure and its future trends in fertility, mortality, and migration. An abundance of scientific evidence shows that population growth in a country is connected to socioeconomic growth, environmental protection, health promotion, quality of life, and social stability. Understanding the growth dynamics and future trends of populations around the world is crucial to achieving the 2030 Agenda for Sustainable Development Goals (SDGs) and other long-term development goals. This article reviews the main features of recent and future trends in population growth for the world, major regions, and selected countries. We mainly rely on the estimates and projections of the 2019 Revision of the World Population Prospects (WPP 2019) produced by the United Nations Population Division (1) to focus on 201 countries and areas with 90,000 inhabitants or more in mid-2020.
HTML
-
The world’s population continues to grow, reaching 7.8 billion by mid-2020, rising from 7 billion in 2010, 6 billion in 1998, and 5 billion in 1986. The average annual growth rate was around 1.1% in 2015–2020, which steadily decreased after it peaked at 2.3% in the late 1960s. Among 201 countries and areas, 73 countries had a smaller growth rate in 2010–2020 compared with the previous decade; and out of these 73 countries, more than 60 are developing countries. The slowing pace of the population growth is closely related to declines in fertility. Globally, the total fertility rate was 2.4 births per woman of reproductive age in 2020, decreasing from 2.7 in 2000, 3.7 in 1980, and 5.0 in 1950. In high-income and upper-middle-income countries, the total fertility rate has been below replacement level (2.1 births per woman) for a few decades, which is the level required to ensure the replacement of generations in low-mortality countries. In a few of these countries, total fertility rates have even fallen to extremely low levels, 1.5 births per woman, and even below 1.5 in some countries, for the past several decades.
There is a myriad of reasons for the slowing pace of population growth that can be attributed to declining fertility in the context of a demographic transition mainly caused by modernization. In the process of modernization, improved food security, nutrition, and public health, advances in medical technology and socioeconomic development, coupled with improved safe and effective family planning methods and services have largely improved child survival, which has enabled couples to have a desired number of children without having too many births. Improved education, enhanced women’s empowerment, increased financial security in old age, and personal aspirations for more opportunities regarding self-career development and a better life have all reshaped young couples’ views and behaviors about postponements of marriage and childbearing, and the numbers and timing of childbirths (2-3). All of these forces have led to reductions in fertility, and eventually triggered a demographic transition. By 2020, all countries and areas either have completed their demographic transition or are in the middle of the transition.
However, even if fertility levels declined rapidly, the world population would likely continue to grow because of the momentum of population growth — a force that drives future population growth resulting from the existing age structure. Globally, more than two-thirds of the projected increase of 1.9 billion in population from 2020 to 2050 could be attributable to population momentum. In other words, population momentum is projected to produce 1.3 billion more people between 2020 and 2050, or 17% of the total in 2020. The contributions of above-replacement level fertility and declining mortality to the projected increase in 2020–2050 are 317 million (16% of the total increase) and 295 million (15%), respectively. The increases attributable to above-replacement level fertility and mortality are roughly equal to 4% each of the total in 2020.
Although the growing trend in the world population is expected to continue throughout this century at a slowing pace, there is uncertainty about future trends, and the uncertainty gets wider with time. For example, the world population is projected to reach 9.7 billion by 2050 and 10.9 billion by 2100, but their 95% projection intervals could be between 9.4 and 10.1 billion for 2050 and between 9.4 and 12.7 billion for 2100 (Figure 1).
 Figure 1.
Growth of the world population, 1950–2100.
Note: The solid blue line is an estimate, whereas the dotted blue line is a projection under the medium variant and the shadow is the 95% projection intervals. Source: Drawn from the World Population Prospects 2019 (1). -
There are substantial variations in the future trends of populations across regions and countries. Overall, most countries and areas in the world are projected to continue growing in 2020–2050. However, in the second half of the century, more than half of the countries and areas are projected to witness a decline. Among eight SDG regions, sub-Saharan Africa is expected to account for most of the increase in the world’s population throughout the century, and its global share of the population is projected to increase steadily. By contrast, the global shares of the population by other SDG regions are projected to decrease over time. Globally, there are 54 countries which have an annual growth rate twice as fast as the world average rate in 2020–2050, and 41 of these countries, or slightly more than three-fourths, are located in sub-Saharan Africa. Indeed, more than a half of the global additional 2.0 billion people projected increase between 2020 and 2050 are from countries in sub-Saharan Africa (regardless of scenarios), and such a proportion is projected to be about 90% in 2050–2100. Overall, about 23–38 million more people annually from sub-Saharan countries are projected to be added to the world’s total population. As a result, the current total population of sub-Saharan African countries, which was 1.1 billion in 2020 (or similar to the Europe and Northern America combined), is projected to climb to 3.8 billion by 2100 with a 95% projection interval between 3.0 and 4.8 billion. By contrast, the total population of Europe and Northern America combined will maintain its current level by 2100 (Figure 2).
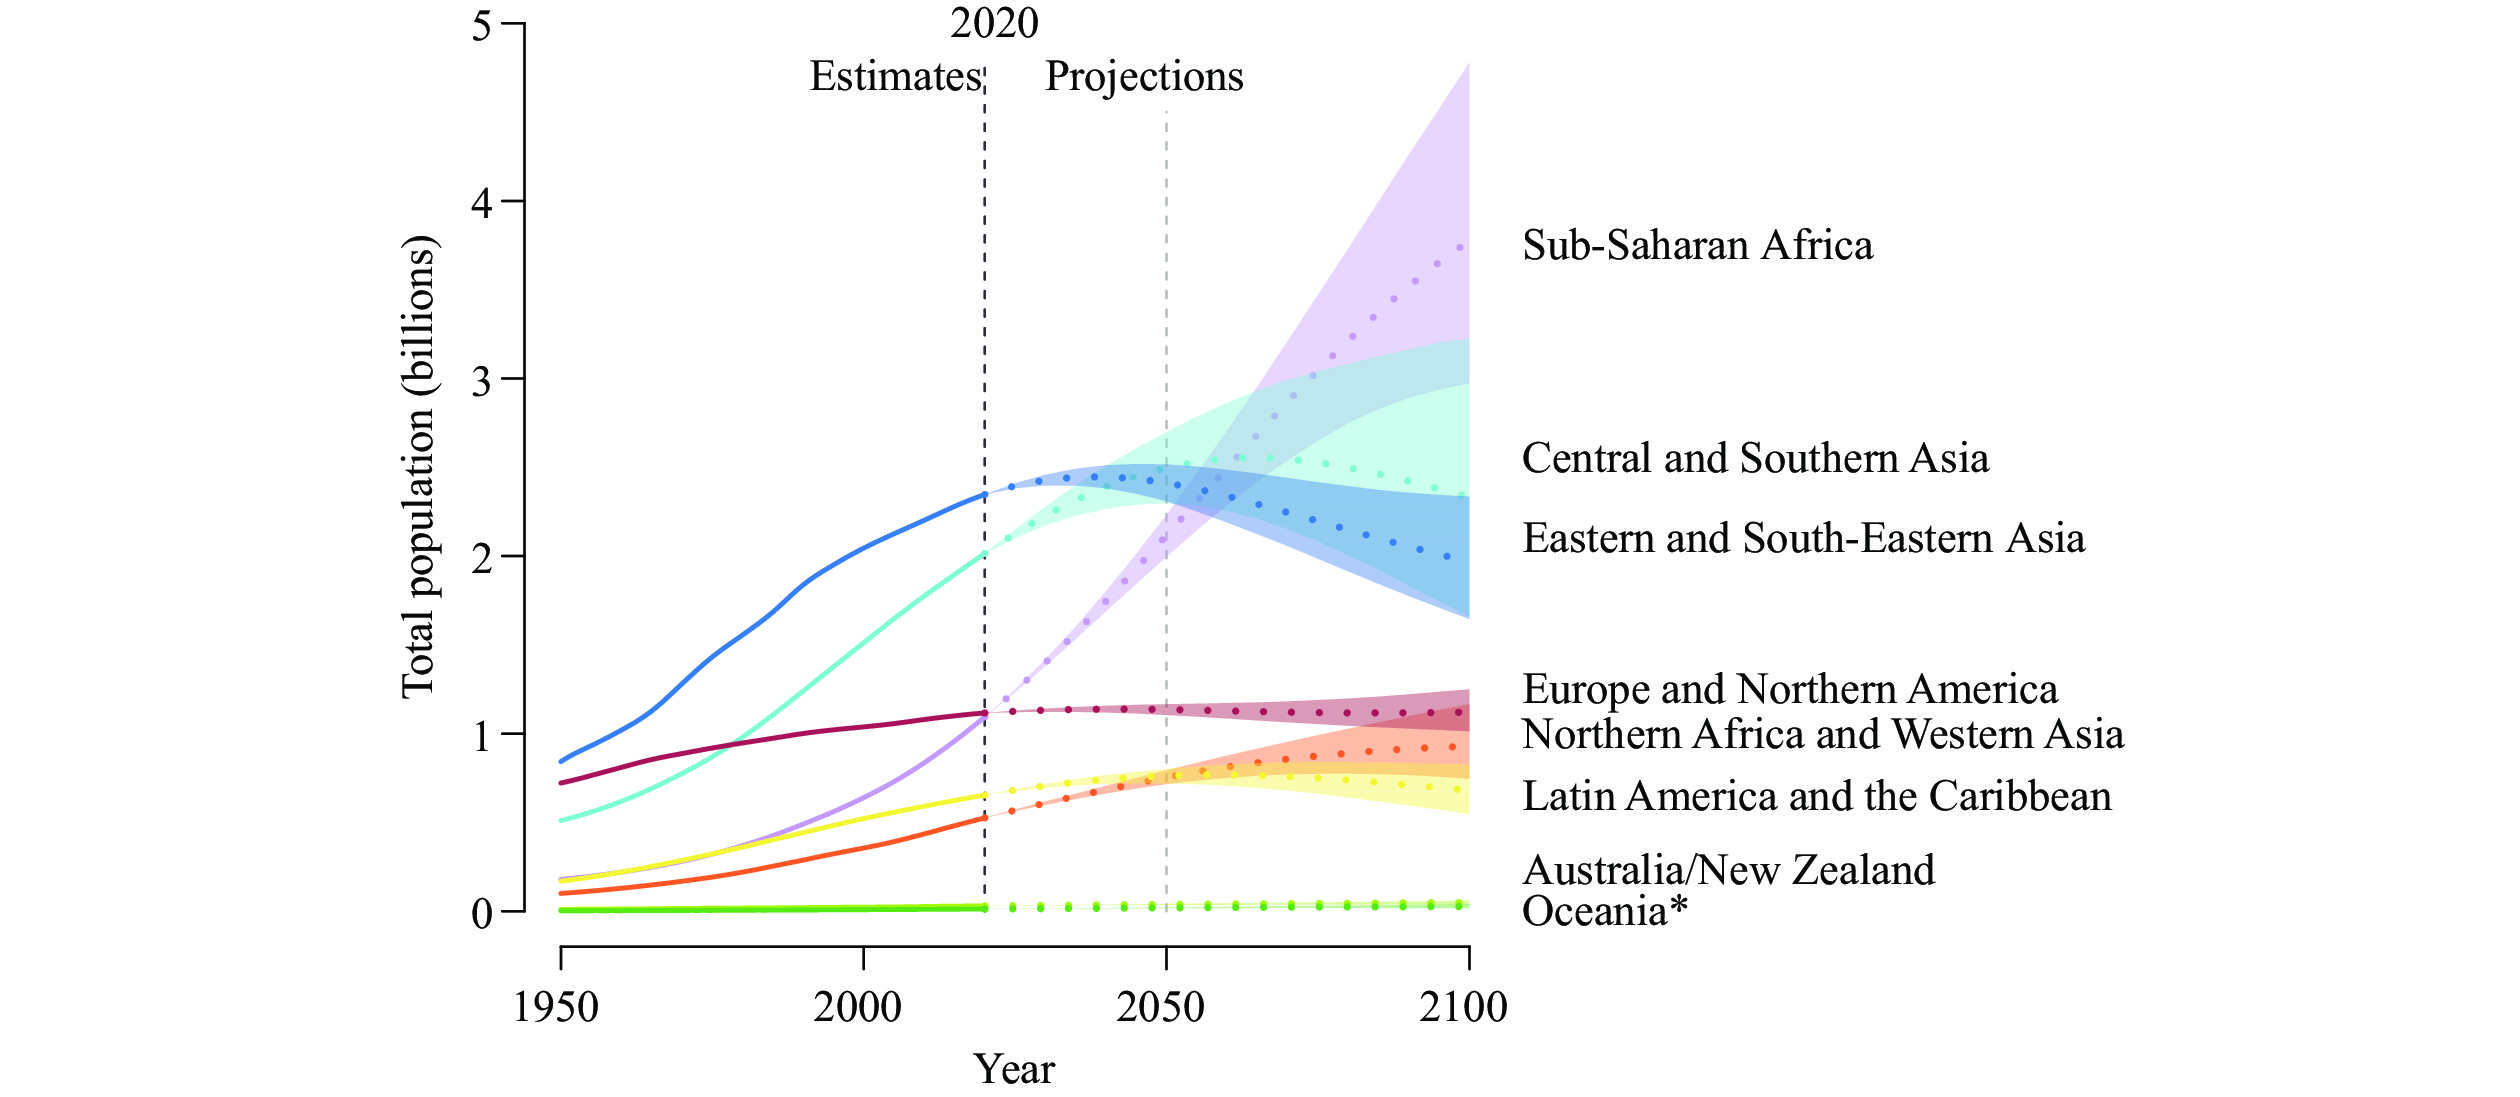 Figure 2.
Population growth by Sustainable Development Goals region, 1950–2100.
*: excluding Australia and New Zealand. Note: The solid color lines are estimates, whereas the dotted color lines are projections under the medium variant and the color shadows are the 95% projection intervals. Source: Drawn from the World Population Prospects 2019 (1).Although a fast-growing population in some developing countries provides a large young population base, which could be a favorable factor for economic growth when this young population enters the labor force, these countries are facing challenges associated with a large young population, such as low access to education among children (especially among girls), relatively high levels of infant, child, and maternal mortality, and relatively high unmet needs in family planning services. High fertility has also caused young couples to have unwanted pregnancies and births that otherwise could relieve them of childbearing and childrearing obligations for other opportunities of human development (2).
Another major feature of the world’s future population growth is that the majority of the projected increase in the world’s total population is attributed to a very few populous (or fast growing) countries. For example, under the medium variant of WPP 2019, nine countries (India, United States, Indonesia, Pakistan, Nigeria, Ethiopia, Egypt, Democratic Republic of the Congo, and the United Republic of Tanzania) are projected to account for more than half of the increase in global population between 2020 and 2050. Except for the United States, all are developing countries and are low-income or low-middle-income countries. Low education among children, high fertility levels, high maternal mortality, and high unmet needs in family planning services in many of these countries are major obstacles for achieving SDGs (4).
In contrast to most countries where populations are projected to increase in 2020–2050, populations in some countries are projected to decline. There were 18 countries and areas, mostly in Europe, that had a negative population growth rate in the last 3 decades (1990–2020), and the number of countries and areas with a negative growth rate is projected to reach 46 in the next 3 decades (2020–2050), including several Asian countries. Almost all countries in Latin American and the Caribbean are projected to continue to grow in 2020–2050, but many of them are projected to be on a declining track in 2050–2100.
China, the most populated country in the contemporary world, had a total population of 1.43 billion in 2020 and was a major contributor to the world’s population growth over the past several decades. Under the medium variant of WPP 2019 (Figure 3), China is projected to have some loss in its total population, with 1.40 billion by 2050, after peaking at 1.46 billion around 2030. Japan has seen the largest losses in population size since the beginning of this century; however, China is projected to eclipse this and will become the largest country with a decreasing population (of 30 million by 2050). By 2100, China is projected to have a loss of more than a quarter of its current size. For India, the world’s second most populous country in the contemporary world, it is projected to continue to grow and will overtake China as the largest population in 2025–2030, reaching 1.64 billion by 2050. However, India is projected to witness population decline after reaching its peak around 1.65 billion in 2055–2060 due to falling fertility. By 2100, India is projected to reach 1.45 billion and to have the second largest loss in population in 2050–2100 after China, followed by Brazil and Bangladesh, ranking the third and fourth largest losses in population, respectively.
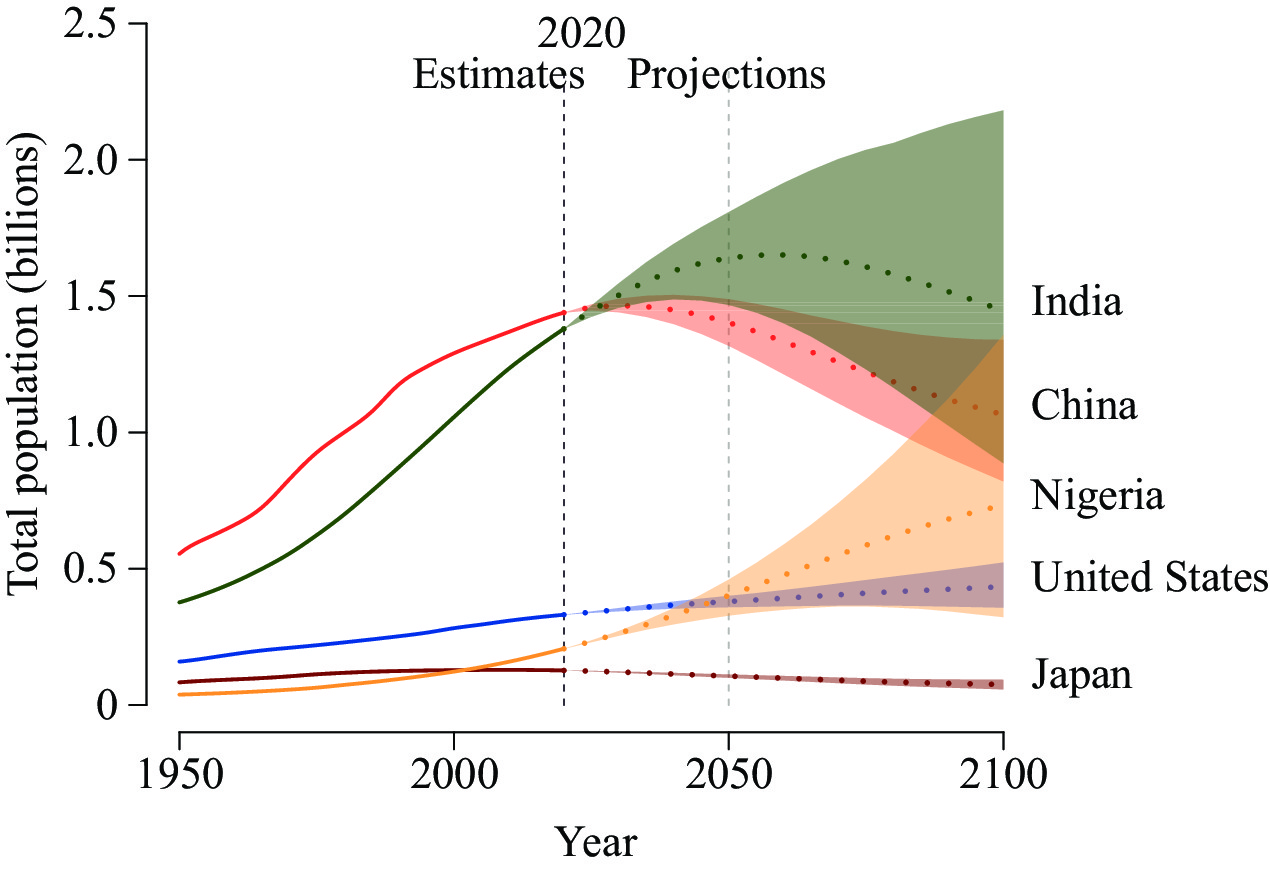 Figure 3.
Population growth for selected populous countries, 1950–2100.
Note: The solid color lines are estimates, whereas the dotted color lines are projections under the medium variant and color shadows are the 95% projection intervals. Source: Drawn from the World Population Prospects 2019 (1).Nevertheless, it is worth noting that there is uncertainty in the future growth of populations and the uncertainty gets wider in the more distant future. For example, the 95% projected low and high bounds for China could be 1.32 to 1.50 billion by 2050, and 0.82 to 1.33 billion by 2100, respectively. The corresponding figures for India are 1.47 to 1.81 billion by 2050, and 8.87 to 2.18 billion by 2100 (Figure 3).
-
Future population growth depends on population momentum, future fertility, mortality, and migration trends. The population momentum refers to an inherent driving force for population growth resulted from the existing age structure. A young age structure leads to increases in population even if fertility is kept constantly at replacement level, whereas an older age structure could lead slower growth or even decreases in population (5).
There is a large variation in the contribution of these components to future population growth for individual countries and regions. For example, in sub-Saharan Africa, relative to the total population in 2020, the total increase in population due to population momentum between 2020 and 2050 is projected to be equal to 40% of the 2020 total; the increase in population due to higher fertility (above replacement level) is projected to be equal to 53% of the 2020 total. The contributions by mortality and migration are very small. In Europe, both low fertility and population momentum are projected to cause population losses between 2020 and 2050. Although improvements in mortality and increasing migration are projected to offset some of the population losses in this period, the overall trend in population size is projected to decline. In Northern America, the population is expected to continue to grow in 2020–2050 largely fueled by declines in mortality and positive net migration, and, to a lesser extent, by positive population momentum. This growth is expected to be partially dampened by the negative contribution of low fertility.
In Eastern and South-Eastern Asia, the increases in population between 2020 and 2050 due to population momentum and improved mortality are projected to be equal to 5% and 3% of its current total, respectively; whereas low fertility in the regions is projected to bring negative population growth by 5% of its current total. The contribution of migration is negligible. Trends in China are similar to this regional pattern, although the actual levels are somewhat different. In Japan, however, the overall pattern is close to that of Europe rather than that of their geographical region.
In Central and Southern Asia, while fertility is projected to bring zero growth to the future population, population momentum is projected to add one-quarter of its population to the current total. The contributions of mortality and migration in this region are negligible. In Latin America and the Caribbean, the increases in population are driven mostly by population momentum, with an additional (although small) contribution of improved mortality. Fertility is projected to contribute significantly to population decline, about 5% of the current population size.
-
With progress along the demographic transition, coupled with other societal developments, most countries have experienced declining fertility and improved mortality, marked by the elimination/reduction of many fatal infectious diseases that have prolonged life expectancy. Global life expectancy at birth has reached 73 years in 2020, 7 years more than that in 2000, and nearly 30 years more than that in 1950. It has been documented that life expectancy at birth for the best performing countries in history have witnessed an increase of 2.0–2.5 years per decade over the last few centuries (4). It is now projected that global life expectancy at birth will reach 77 years by 2050 and 82 years by 2100. Life expectancy at birth could even be over 95 years by 2100 in Japan, Republic of Korea, Singapore, and Spain, although it is projected to remain below 80 years in some African countries.
Paralleling the unprecedented rise in life expectancy is the unprecedented growth of population aging (6). A population is typically considered an aging population if the proportion of its adults aged 65 or older (or old-age proportion) is over 7%. Likewise, it is called an aged, a super-aged, and an ultra-aged population if the old-age proportion is over 14%, 21%, and 28%, respectively (7). Globally, the proportion of people aged 65 or older reached 9.3% in 2020, rising from 6.9% in 2000, and 5.1% in 1950 (Table 1). The global old-age proportion is projected to reach 15.9% in 2050 and 22.4% in 2100.
Percent of the old-age population 1950 2000 2020 2050 2100 Levels <7 76.6 66.2 49.7 22.9 0.0 7–14 23.4 22.4 21.4 19.4 13.4 14–21 0.0 11.4 23.9 20.4 15.9 21–28 0.0 0.0 4.5 22.4 19.5 ≥28 0.0 0.0 0.5 14.9 51.2 Total 100.0 100.0 100.0 100.0 100.0 The world 5.1 6.9 9.3 15.9 22.4 Note: The distributions are calculated among 201 countries and areas. The old-age percentages refer to the proportion shared by the population aged 65 or older out of the total population. Table 1. Distribution of countries by the percent of the population aged 65 or older for selected years.
In some developed countries (or countries with rapid fertility declines), the proportion of older people is much higher. For example, the old-age proportion in Japan, the most aged population in the contemporary world, was 28.4% in 2020, rising from 17.0% in 2000, and 4.9% in 1950. Table 1 shows that by 2050, nearly 58% of the 201 countries are projected to be in an aged society, and nearly 15% of these countries are projected to be in an ultra-aged society; in comparison to the less than 30% of countries in an aged society in 2020 and only one country in an ultra-aged society (Japan). By 2100, nearly 90% of these countries are projected to be an aged society, and more than half are project to be an ultra-aged society.
Population aging has had a profound impact on old-age care, pension and social security systems, housing, savings, labor supplies, social services, and in many other sectors (6). These challenges are more pressing for developing countries because they are facing these challenges within a much shorter time frame, and long before they become economically well off, to prepare for such rapid population aging (“aging before rich”). With few exceptions (e.g., Japan), most developed countries took 40 to 120 years to transform from an aging population (7%) to an aged population (14%) and took (or will take) 20 to 50 years to transform from an aged society (14%) to a super-aged society (21%). In contrast, most developing countries will take 15–35 years to transform from an aging population to an aged population and 10–30 years to transform from an aged population to a super-aged population. Based on some empirical evidence, and potential trajectories of mortality and fertility, it is projected that the number of years to transform from a super-aged population into an ultra-aged population will be shorter than the number of years transforming from an aged society to a super-aged society for both developed and developing countries. Such an unprecedented growth of older populations in the world has required reforms in pension systems and statutory retirement ages in many countries, especially in more developed countries in order to maintain fiscal sustainability of existing public pension systems (8).
However, rapid population aging can also open additional windows of opportunity for economic growth — such as a “second economic dividend” when low fertility and prolonged longevity stimulate human capital investments (9). This is especially the case when population aging is accompanied by better health (i.e., “compression of morbidity”) that has been observed in many older populations (10). Better health and prolonged longevity could allow labor force participation among older adults to offset downward pressures on economic growth (6). Research has shown that the benefits of a second dividend are estimated to be larger and more lasting than the first dividend (9), leaving policymakers an opportunity to optimize transitory economic growth from the first dividend into a sustained one.
-
It is estimated that the number of persons who live outside of their countries of birth reached 281 million in 2020 globally, an increase from 108 million over the amount in 2000 (11). Although international migration does not have a direct impact on the world’s population growth, and its impact on population growth is usually negligible in most countries compared to other demographic components, it has contributed significantly to the growth of populations in some countries. For example, in the past few decades, international labor migration inflows in several Gulf States have contributed to rapid population growth in these countries. It was estimated that labor immigrants accounted for more than three-fourths of the working-age population in Bahrain, United Arab Emirates, and Qatar in the last couple of decades.
Globally, about two-thirds of international migrants are concentrated in just 20 countries — with the United States as the largest destination country, followed by Germany, Saudi Arabia, the Russian Federation, and the United Kingdom, which all have over 10 million immigrants. On the other hand, about one-third of all global migrants originated in only 10 countries — with India as the largest out-migration country, followed by Mexico, China, and the Russian Federation, which have over 10 million emigrants. Overall, high-income countries host nearly two-thirds of all international migrants, and Europe continues to host the largest number of migrants in the world, followed by Northern America. The number of male international migrants is slightly higher than that of female migrants. Most international migration is for labor or family reasons. However, the number of forcibly displaced migrants due to humanitarian crises in many parts of the world grew rapidly, reaching 34 million in 2020, an increase from 17 million compared with 2000 (11).
Migration can contribute to sustainable development in both origin and destination countries, which has been widely acknowledged in the 2030 Agenda for Sustainable Development and the Global Compact for Safe, Orderly, and Regular Migration (11). As most migrants are working-age adults, positive net migration can also offset a shortage of labor supply and population decline, as well as slow down population aging in destination countries. For countries and areas of origin, as migrants are mostly healthy, highly educated, and skilled young adults, a large scale of out-migration may cause possible brain drains and accelerate population aging. However, migrants’ remittances to countries and areas of origin could improve the livelihood and education of population left behind, boost socioeconomic development, and reduce mortality. All these promote sustainable development in origin countries and areas (11). Nevertheless, as migrants often face many disadvantages — including language barriers, low social integration and isolation, and a low likelihood of being eligible for pensions, healthcare, and/or education compared with those who are native born — how to better protect their rights and remove obstacles that prevent them from discrimination is a key goal for achieving SDGs and leaving no one behind.
-
Urbanization, usually measured by the percentage urban (i.e., urban population as a percentage of the total population), is the spatial re-distribution of the population of a country or an area, mainly resulting from internal or domestic migration. Given the close relationships among urbanization, socioeconomic development, and the environment, it is crucial to understand the long-term trends in urbanization in addition to the trends in population size and composition. Just like international migration will not change the world’s population, internal or domestic migration within a country will not change the population of that country. However, internal migration, especially rural-to-urban migration can have a huge impact on the total population in both the origin and destination cities of a given country, which is normally a major driving force for rapid urbanization, such as in the case of China (12).
The world’s population is urbanizing rapidly. The percentage urban was 56% in 2020, rising from 50% in 2007, 43% in 1990, and less than 30% in 1950 (Table 2). It is projected to reach more than 68% in 2050 (13). There are large variations in urbanization levels and growth rates across regions and countries, with the percentage urban more than 80% in Northern America and, Latin America and the Caribbean, 75% in Europe, and around 40% in sub-Saharan Africa in 2020. From 2000 to 2020, with the exception of a very few countries, all other countries witnessed an increase in urbanization — with nearly 40 countries having an annual growth rate greater at 1.5%; and all countries are projected to continue to urbanize from 2020 to 2050, albeit with different annual growth rates ranging from 0.01% to over 2.0%. Most developing countries are projected to have a much faster growth rate than developed countries. China has been the biggest contributor to global urbanization from 2000 to 2020, thanks to its massive scale of rural-to-urban migration. From 2020 to 2050, China is projected to continue to play a major role in global urbanization, although India will overtake China as the largest contributor. Nigeria is projected to be the third largest contributor to the world’s urbanization growth in the next three decades (13).
Percentage urban 1950 2000 2020 2050 Levels <20 38.3 7.5 4.0 0.0 20–30 18.9 12.4 9.0 3.5 30–50 22.4 23.4 19.9 12.9 50–70 13.9 27.4 28.9 24.9 ≥70 6.5 29.4 38.3 58.7 Total 100.0 100.0 100.0 100.0 By selected regions World 29.6 46.7 56.2 68.4 More developed regions 54.8 74.2 79.1 86.6 Less developed regions 17.7 40.1 51.7 65.6 Europe 51.7 71.1 74.9 83.7 Northern America 63.9 79.1 82.6 89.0 Australia/New Zealand 76.2 84.5 86.3 91.0 Latin American and the Caribbean 41.3 75.5 81.2 87.8 South-Eastern Asia 15.6 37.9 50.0 66.0 Sub-Saharan Africa 11.1 31.4 41.4 58.1 Note: The distributions are calculated among 201 countries and areas. The percentage urban refers to the proportion shared by the urban population out of the total population.
Source: United Nations (2018) (11).Table 2. Distribution of countries by percentage urban for selected years.
-
All human beings are connected to others by blood or marriage, and generally live together in families or households. Dynamic changes in household size and composition over time are indeed another form of population growth. Households are often a more relevant unit for analyzing energy-related consumption, human impacts on the environment, and likewise sustainable development because energy-related commodities such as water, food, vehicles, housing, and social services are often purchased and consumed by households, rather than by individuals (14-15). There is ample empirical evidence showing that the average size of households has declined steadily over the past several decades for most countries in the world (16). For example, in Brazil, the average household size declined from 5.1 persons per household in 1960 to 3.3 persons per household in 2010. The corresponding figures were 3.8 and 3.2 for the United Kingdom, and 3.5 and 2.6 for the United States. The average household size for India also declined from 5.8 persons per household in 1980 to around 4.5 persons per household in 2010. China’s household size decreased from 4.7 in 1981 to 3.2 in 2010, and further down to 2.62 in 2020 (17).
Such decreases in household size have led to faster growth in the number of households as compared to the growth of the population (18). The faster growth of households will likely persist in the foreseeable future. Globally, the average household size for all countries was around 4 persons per household in 2010, ranging from 2.1 in Finland and Germany to 8 persons per household in Afghanistan (16). It was estimated that if the average household size had been 2.5 people globally in 2010, the number of households in the world would be 2.7 billion, 0.8 billion more (or a 41% increase) than the current total of 1.9 billion (14). In addition to declining fertility, higher divorce rates, more internal and international migration, and the diminishing norms of co-residence have all contributed to the growth of smaller household sizes (16).
The living arrangements of older adults is an important component of household composition, which have been receiving increasing attention. The living arrangements of older adults are the result of a nexus of personal preferences, needs, available resources, and culture. Coresidence with adult children and/or grandchildren is very common in many countries and areas in Asia, Africa, and Latin America and the Caribbean, where coresidence is usually over 40% (and even reaches over 80% in some countries). In contrast, coresidence is relatively low among older adults in Europe and Northern America, where the most common living arrangement of older adults is living with a spouse only or living alone (19). With the progress of modernization and advances in socioeconomic development, the number of older adults in many developing countries preferring to live with their spouses only and/or live alone is growing in most countries. In China, for instance, the percentage of those living with only a spouse or alone witnessed a steady increase over the last several decades, from 25% in 1982 to 35% in 2010 (20-21). Research has shown that the living arrangement of older adults is linked to various health outcomes and the use of (in)formal services; which implies that the fast growing trend in the numbers of households coupled with its reducing size could have important implications for the planning of long-term care, housing, and social services in the context of rapid population aging.
Overall, the trends in household size and composition and older adult living arrangements are important for sustainable development, especially when such trends are connected with energy-related consumption and old-age care.
Continuing Gowth of the World Population at a Slowing Pace
Large Variations in Growth Patterns Across Regions and Countries
Contributions of Population Momentum, Fertility, and Mortality to Population Growth
Unprecedented Challenges of Population Aging in Many Countries
Growing Role of International Migration
An Urbanizing World
Fast Growing Numbers of Households with Decreasing Size
-
The world’s population is projected to continue to grow at a slowing pace during this century. Such a trend of decelerating growth is mainly due to fertility declines in a growing number of countries. However, many sub-Saharan African countries are projected to have much faster growth than countries in other regions of the world — because many sub-Saharan African countries still have high fertility rates and reductions in fertility have been stalling in recent years. In these countries, more effort is needed to prioritize the enhancement and empowerment of women, improve the availability of safe and effective methods of contraception, promote compulsory education among children, and reduce poverty.
Rapid and sustained declines in fertility could result in a large labor force relative to the number of children and older people in some period(s), creating a window of opportunity for socioeconomic growth, commonly known as the “first demographic dividend (population bonus)” (9). With progress along the demographic transition in a country, the young bulk of the labor force enters the late stages of the labor force. This leads to higher per capita consumption due to this population’s greater resources, and eventually creating another window of opportunity for economic growth in that country, or the “second demographic dividend” (9). Most developing countries are (or will be) in their first window of opportunity, and many developed countries are (or will be) in their second window of opportunity.
However, it should be emphasized that the demographic dividends are opportunities for economic growth and should not be taken for granted. The duration of each window of opportunity is limited and does not last forever. Instead, the realization of demographic dividends depends on appropriate policies adopted in other related sectors and the country’s ability to implement these policies (22). Research has shown that female labor force participation, educational attainment of the labor force, the potentiality of the old-age population entering the workforce, people's health and wellbeing, urbanization, investments (especially foreign direct invests), high technology, and international trades are all important factors determining the outcomes of demographic dividends (22). It is thus important for different countries to formulate socioeconomic policy packages that are consistent with their own population trends and characteristics to reap the maximum benefits of the demographic dividends. For countries in the first (window) stage, promoting quality education, enhancing women’s empowerment, creating more jobs, and attracting more foreign direct investments may be a priority. For aging countries, especially aged and super-aged countries, postponing the retirement age, developing a sound long-term care system, promoting home- and community-based social services, and creating social environments without ageism are effective solutions to ensure that all adults achieve healthy aging and age in the right place. However, it is also worth noting that with prolonged life expectancy and improvements in the health of all people, the threshold of old age will likely increase, which means the size, the length, and the timing of these (window) periods could be prolonged.
Nevertheless, there are uncertainties in future population growth, not only because there are uncertainties in the future trends for the three demographic components (fertility, mortality, and migration), but also because many other factors can affect a population’s future trajectories. For example, the ongoing coronavirus disease 2019 (COVID-19) pandemic has impacted almost every nation and profoundly affected every member of a society. By mid-2021, the pandemic has caused more than 3.8 million deaths worldwide — with older people being the hardest hit. The excess deaths across countries range from 5 deaths per million population to more than 1,000 deaths per million population in the past 1.5 years. The lockdown policies implemented in most countries have greatly reduced both internal and international migration; and it may take years to reach pre-COVID-19 pandemic levels. For the pandemic’s impact on fertility, it is too early to draw any reliable conclusions at this point. Some evidence suggests that there is an increase in child marriages and adolescent fertility, yet evidence in some countries shows a decrease in fertility in 2020, the first year of the pandemic. Based on historical evidence, we would expect a relatively high level of fertility in the post-disaster or post-pandemic period (23). The future trends in population growth of a country are also affected by the birth policies of a country. China recently relaxed its birth policies to allow couples to have up to three children (24). Given its large share of the world’s population, such a relaxation in its birth policy will not only influence China’s own population growth in the future, but also influence the trajectory of the world’s population.
In analyzing future population growth, it is crucial to consider the trends in the size and composition of households. With trends toward smaller households in the near future, how to transform our consumption behaviors to ensure a responsible and sustainable consumption pattern towards achieving SDG should be a priority (16). Furthermore, given the global trends in urbanization, policies to manage urban growth are needed to ensure equal access to housing, education, healthcare, decent jobs, and friendly living and working environments — with a focus on the needs of the urban poor and other vulnerable groups — so that the benefits of urbanization can be shared by all.
Climate change and environmental degradation are major global concerns in the contemporary world. There is a consensus that population growth, urbanization, unsustainable consumption patterns are important drivers of emissions that have been a cause of the worsening climate and ecosystem (25). Rapid population growth is one of the key drivers of growing emissions and one of the determinants of vulnerability to its impact (2). Consequently, slowing population growth could be key to lessen climate risks facing human beings by reducing global emissions in the long-term and by freeing up resources for adaptation (2).
In summary, the world’s population is projected to grow throughout the century, albeit at a decreasing rate. Given large variations in population trends across countries, different countries should develop sound policies specific to their own situation to scientifically address the unique challenges related to population growth for achieving SDGs and other long-term socioeconomic development goals.
Disclaimer: The views expressed in this article are solely those of the authors and do not reflect those of the United Nations or Duke University.
Conflicts of interest: No conflicts of interest.
| Citation: |

|