-
China experienced significant changes in the age structure of the population, declining fertility rates, and accelerating population aging (1) and has made considerable strides in raising its life expectancy. However, the double burden of population aging and an increasing chronic disease burden has led to the continuous growth of the disability burden in China (2). An increasing pace of aging and fluctuated population trends in China poses serious challenges for population health, which makes predicting future trends increasingly important. By using the Sample Census in 2015 and secondhand data in China, this study used the Population-Development-Environment (PDE) model and used the Sullivan method to present the future trends of scale, structure of population, life expectancy, disability, and disability-free life expectancy. This study presented predictions of five important indicators of population trends from 2015–2050 in China, which showed China experiencing major demographic and health changes. Elderly population health promotion and disability prevention measures should be implemented to eliminate adverse health effects influenced by population aging.
This study used data from the 2015 Sample Census and previous publications (3-4) to predict future population trends. The 2015 Sample Census was conducted by the National Bureau of Statistics, which provided detailed data on the population scale and structure of China, covering 31 provincial-level administrative divisions (PLADs) in China. Disability-related data was mainly calculated based on the First and Second National Sample Surveys on Disability, which were nationally representative population-based surveys conducted in 1987 and 2006, respectively, according to the World Health Organization (WHO) International Classification of Functioning, Disability, and Health. The PDE model, epidemiological calculations, and Sullivan method were used to predict population trends and healthy life expectancy from 2015–2050, respectively. The mathematical expressions for PDE were as follows:
$$ {\rm{}}{{\rm{P}}_{{\rm{(t + 1,n + 1)}}}}{\rm{ = }}{{\rm{P}}_{{\rm{(t,n)}}}}{\rm{ \times }}\left( {{\rm{1 - }}{{\rm{D}}_{{\rm{(t + 1,n + 1)}}}}} \right){\rm{ + }}{{\rm{N}}_{{\rm{(t + 1,n + 1)}}}}{\rm{}} $$ (1) $$ {{\rm{P}}_{{\rm{(0,n + 1)}}}} = \sum\limits_{l = 15}^{49} {\left[ {{\rm{ }}{{\rm{F}}_{{\rm{(t,n + 1)}}}}{\rm{ \times F}}{{\rm{R}}_{{\rm{(t,n + 1)}}}}} \right]{\rm{ \times }}\left( {{\rm{1 - }}{{\rm{D}}_{{\rm{(0,n + 1)}}}}} \right)} $$ (2) $$ {{\rm{F}}_{{\rm{(0,n + 1)}}}}{\rm{ = }}{{\rm{P}}_{{\rm{(0,n + 1)}}}} \times {\rm{f}}{{\rm{r}}_{{\rm{n + 1}}}} $$ (3) $$ {\rm{P}}{{\rm{T}}_{{\rm{n + 1}}}}{\rm{ = }}\sum\limits_{l = 1}^m {{{\rm{P}}_{{\rm{(t,n)}}}}{\rm{ + }}{{\rm{P}}_{{\rm{(0,n + 1)}}}}} $$ (4) Where t, n, P, PT, D, and N represent the age, year, population, total population, mortality rate, and net migration flow, respectively. F, FR, and fr represent the number of women, the fertility rate for specific age groups, and the total proportion of women with newborns, respectively. PT and m represent the total population and the highest age of the population, respectively. The principles underlying the PDE model can be found in Supplementary Figure S1.
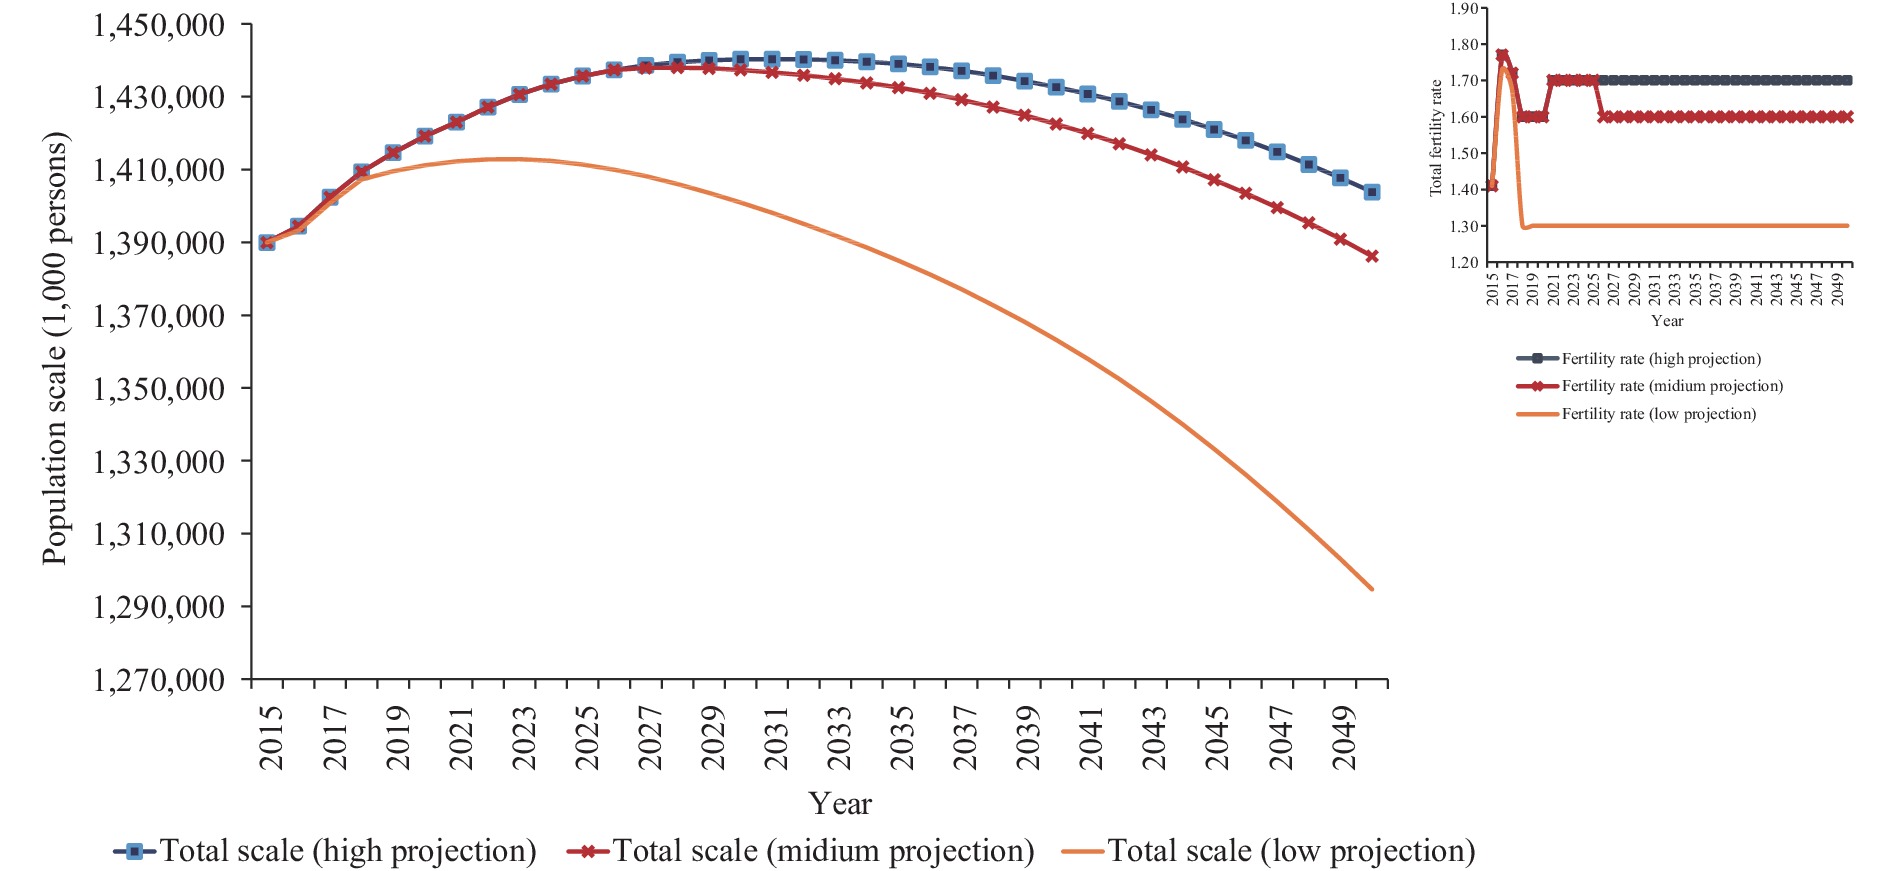
Based on the assumptions of three scenarios, the predictive parameters of the PDE model include total fertility rate (TFR) and mortality rate (MR). The TFR parameters from 2015–2017 of Scenarios 1 and 2 were set according to the survey findings from National Fertility Intention Survey. Scenario 1 assumes that TFR declines from 2017 and reaches 1.60 in 2018–2020 and will increase to 1.70 from 2021–2050 due to the Three-Child Policy based on expert’s judgement. Scenario 2 assumes that TFR will decline to 1.60 from 2026–2050 with the fading effects of the three-child policy. Scenario 3 assumed that birth patterns across the mainland of China were similar to those in Taiwan, China in 2000, because the TFR of the mainland of China in 2015 was similar to that of Taiwan, China in 2000. More details can be found in Supplementary Table S1. Mortality rate was calculated according to assumptions from a previous study (5). According to the Outline of Healthy China 2030 Plan, life expectancy in 2020 was assumed to be 77 years and 80 years in 2030. By 2050, life expectancy was projected to reach 85 years according to China’s General Program for Sustainable Development. Furthermore, we assumed that the prevalence of disability to be increasing at the same rate as from 1987–2006. The scale of disability was calculated according to the prediction of population scale and the assumption of disability prevalence. Disability-free life expectancy was calculated through the Sullivan method.
Findings from the PDE model showed that the total population would reach 1.40–1.44 billion by 2030 and 1.29–1.40 billion by 2050 (Figure 1). Our findings indicated that in 2030, about 70% of the total population would live in cities, and this percentage would reach over 81% in 2050.
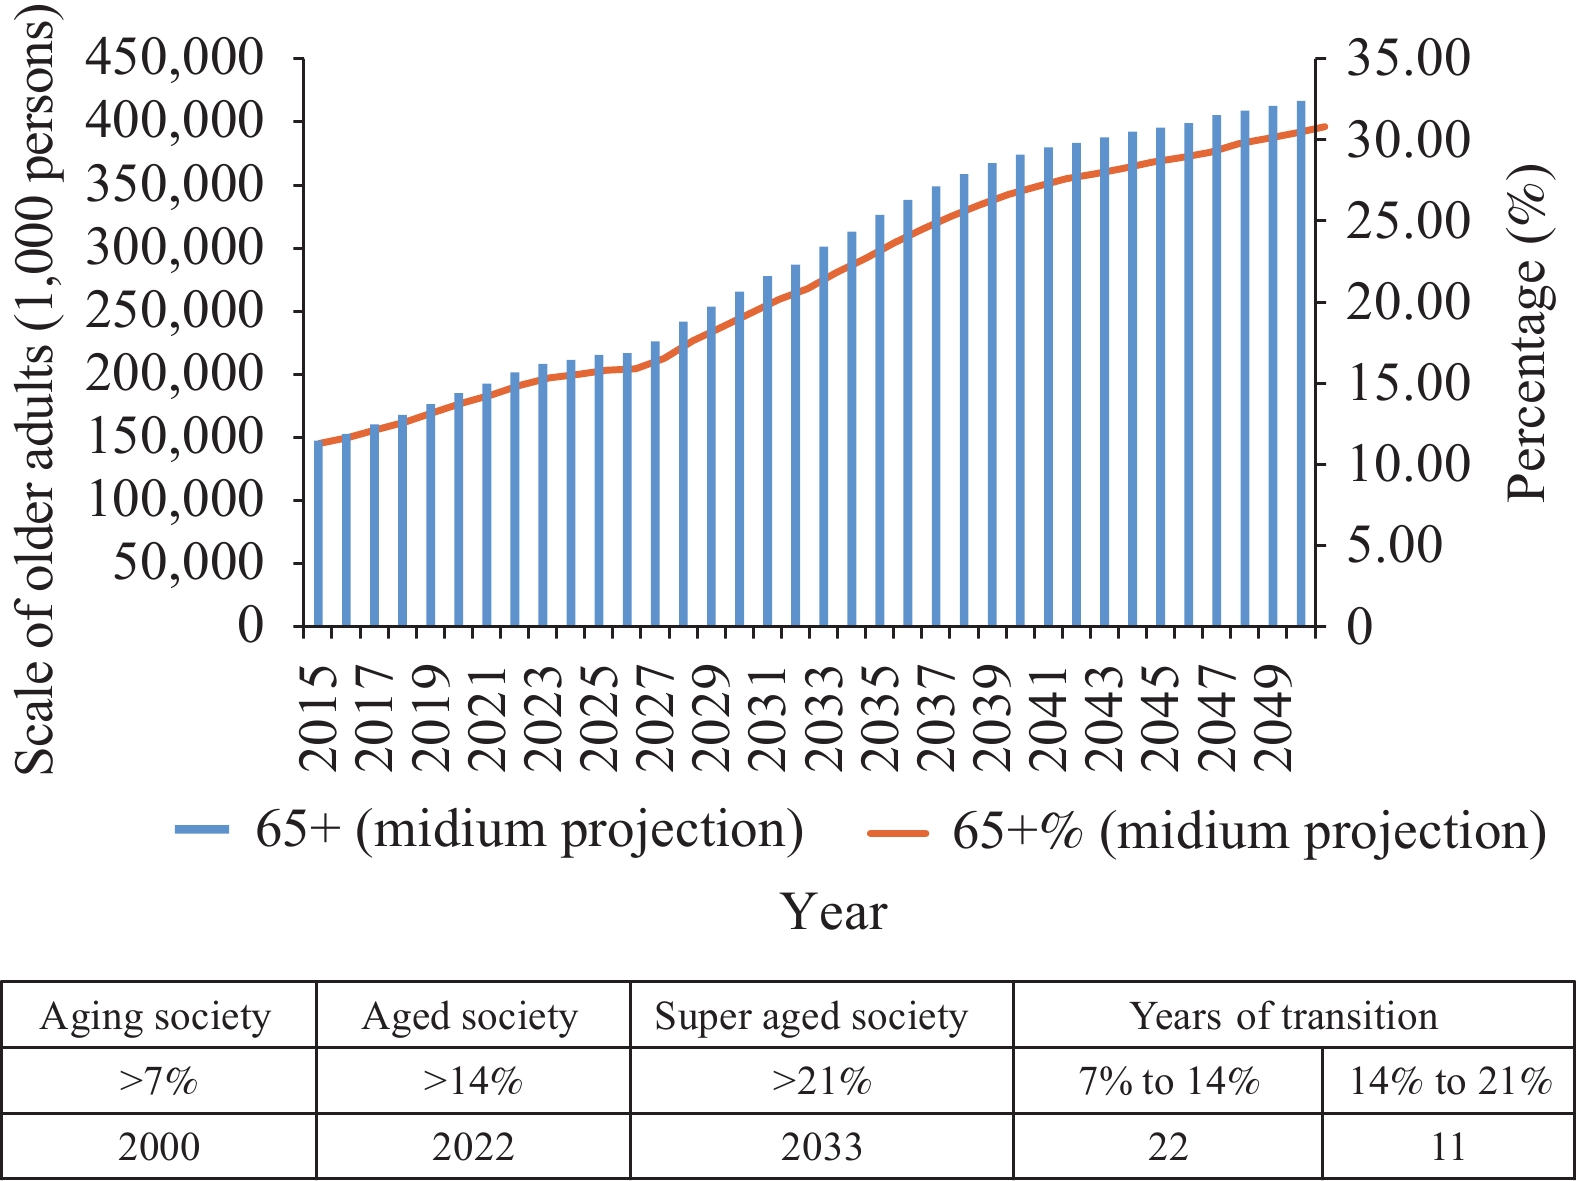
In the future, China is expected to face rapid population aging even after considering the effects of two-child and three-child policies on population. According to the moderate prediction, China was projected to become an aged society by 2022 and a super-aged society by 2033. This 11 year transformation sees the population aged 65 years or older (henceforth referred to as the elderly) comprise 14% of the total population to 20% by 2033 (Figure 2). From the Fifth Population Census to the Seventh Population Census, the proportion of elderly was continuously increasing from 6.96% in 2000 to 8.87% in 2010, and 13.50% in 2020. Overall, 30 of 31 provincial-level administrative divisions (PLADs) in the mainland of China in 2020 entered the “aging society phase” with the proportion of elderly making up over 7% of the population, and 12 PLADs entering the “aged society phase” with the proportion of elderly over 14%. Only Tibet Autonomous Region did not enter the “aging society” phase, which may be due to its low life expectancy (Table 1, Figure 3).
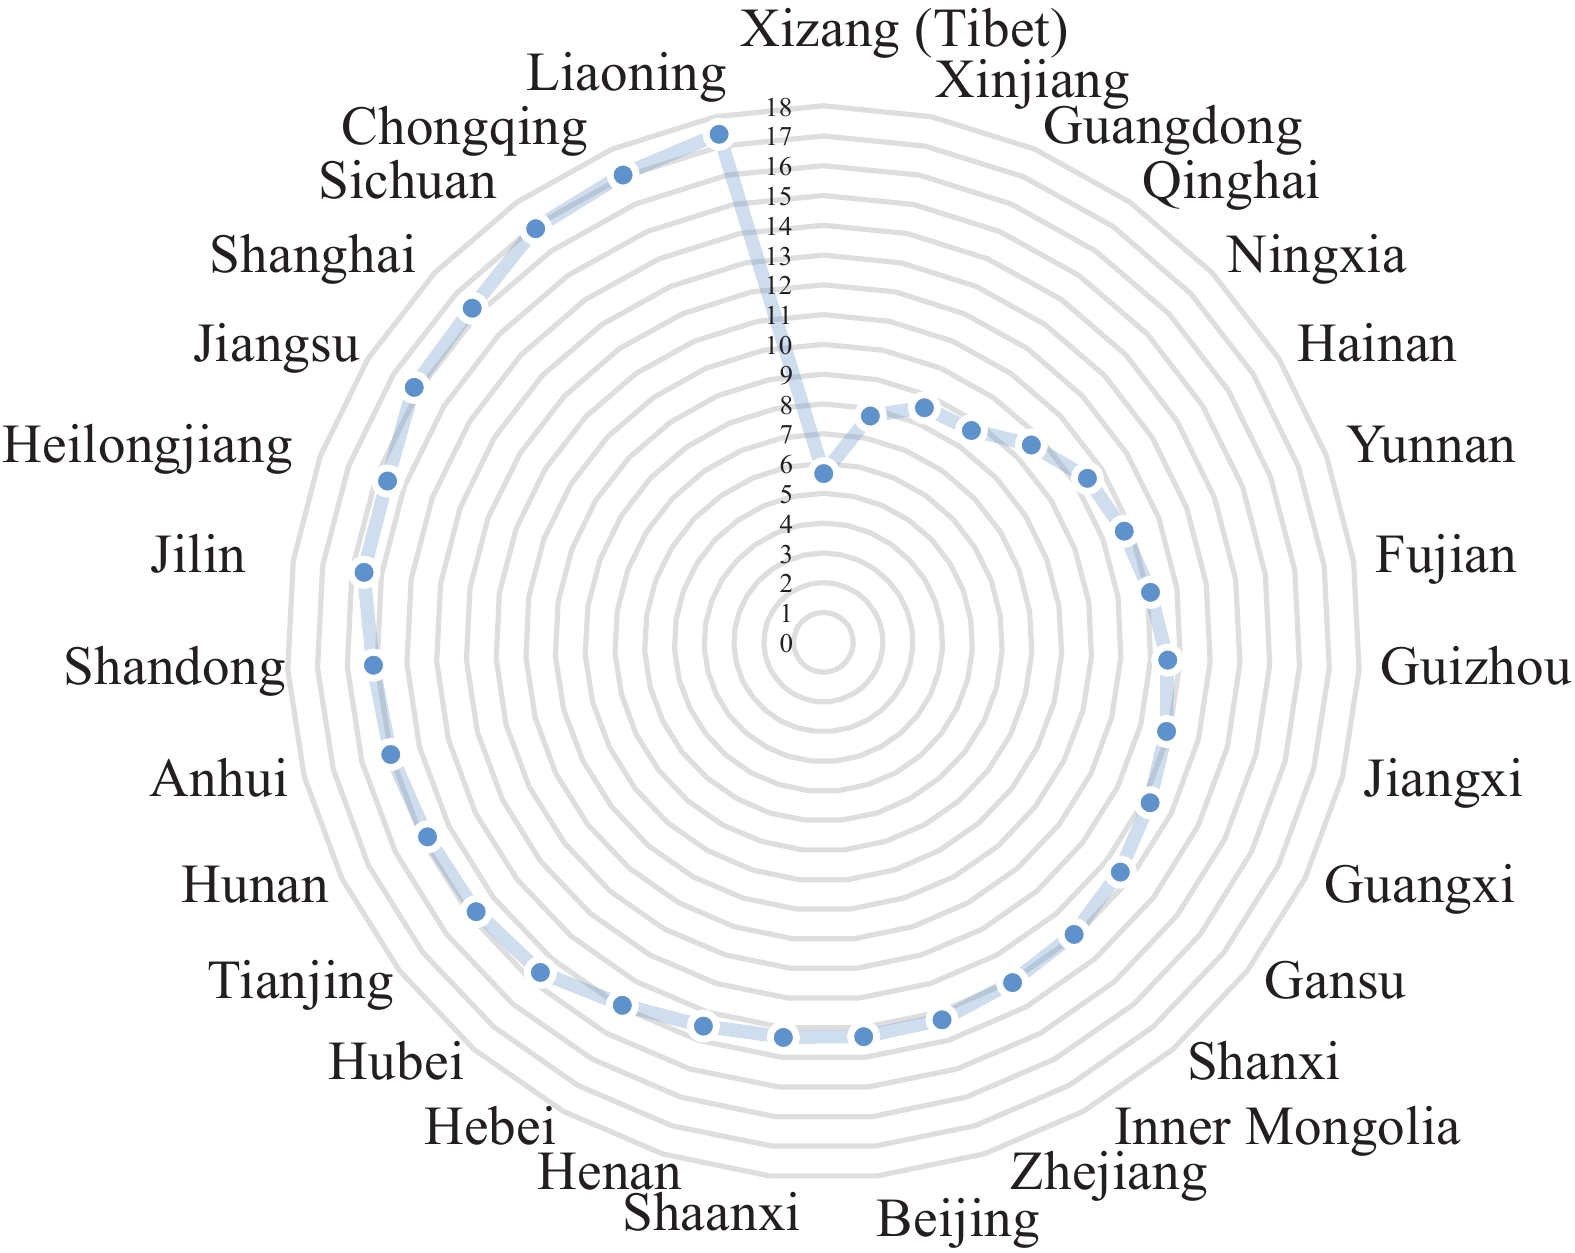 Figure 3.
Scale of older adults (65+ years) by PLAD, Seventh Census, 2020.
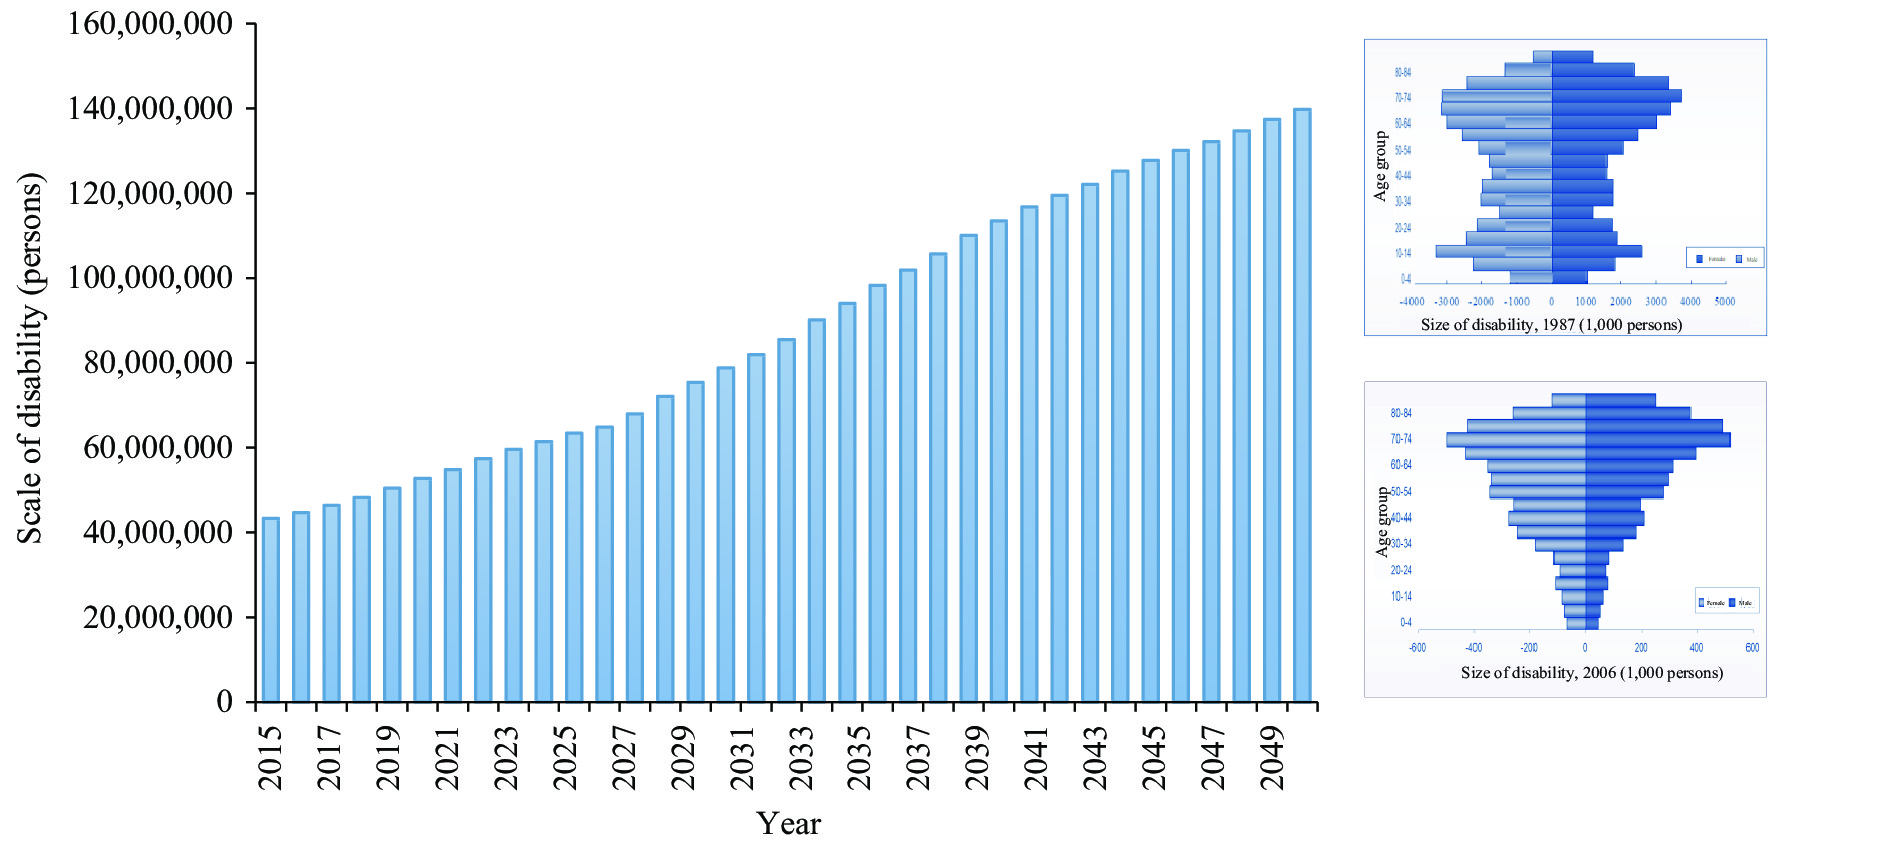
Note: Aging society, 65+ years%=7%–14%; aged society, 65+ years%=14%–20%; super aged society=65+ years %>20%.Abbreviation: PLAD=provincial-level administrative division. The study prediction showed that, currently, 108.67–108.79 million persons with disability were estimated in China in 2020. By 2030, this number was projected to increase to 136.24–136.74 million (Figure 4). Along with population aging, the challenge of disabled population aging has become an increasingly prominent issue in China. In 1987, disability in China had a balanced distribution of age, but this shifted towards people of older ages in 2006. The number of elderly people with disability reached 52.71 million in 2020, and the proportion of disabled elderly was projected to account for over 57% of total disabled persons by 2030 and would further increase to over 70% by 2050 if no prevention and control measures are implemented.
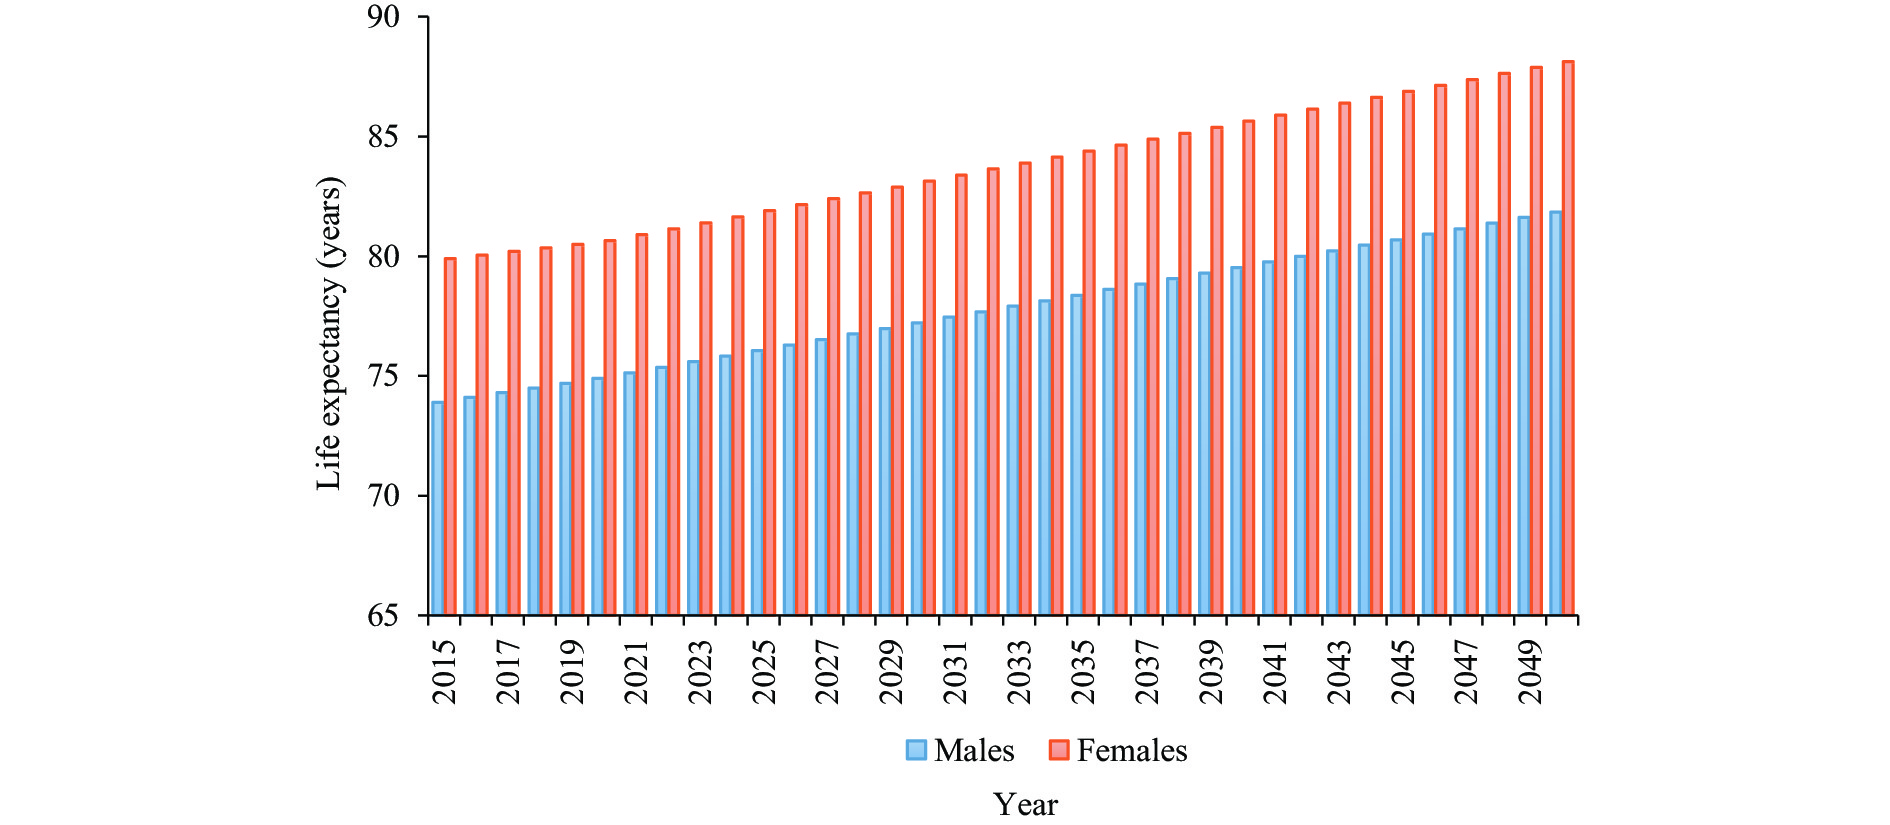
According to our prediction, life expectancy of males and females is expected to continue increasing. For males, life expectancy increased from 73.9 years in 2015 to 74.9 years in 2020, to 77.2 years in 2030 and 81.85 years in 2050. For females, life expectancy was projected to increase from 79.9 years in 2015 to 80.65 years in 2020, to 83.14 years in 2030 and 88.13 years in 2050 (Figure 5).
Figure 6 showed that disability-free life expectancy at birth (both sexes combined) was forecasted to increase from 69.53 years in 2015 to 72.87 years in 2030 and over 78.26 in 2050. However, the percentage of life expectancy with disability will keep growing: from 9.60% in 2015 to 11.22% in 2030 and 14.54% in 2050. Older adults were estimated to experience 5.78 years lived with disability in 2015, and this number is expected to increase to 7.44 years in 2030 and to 11.45 in 2050.
HTML
-
This study estimated future trends of 5 important population indicators from 2015–2050 in China. Since the 21st century, China experienced significant demographic changes — increases in life expectancy and declines in fertility rate — that have led to population aging. Along with population aging, the age structure of the population living with disability shifted towards people of older ages living with disability, and the life expectancy with disability also continuously increased.
Although the general trend of fertility rate was projected to decline, China still has a large population. As the most populous nation in the world, China also has the largest older population. With the fading of the effects of the two-child policy and the influence of coronavirus disease 2019 (COVID-19), China entered a phase with the lowest low-fertility rates in history according to the results of the Seventh Census. The two-child policy had delayed the arrival of an aging society brought forth by the one-child policy, but its effect are slowing down. The sheer size of the elderly population and rapidity of aging drives the implementation of the policy of actively dealing with the challenge of aging. Providing support policies for women of childbearing age to achieve their fertility goals and postponing the retirement age may have immediate effects on population aging. Moreover, regional differences were found in the progress of population aging. Furthermore, unbalanced socioeconomic and technological developments may one of the important contributions to this difference (6-7). Due to the uncertainties of future trends in population structural changes, dynamic evaluation, timely adjustment, and innovations in population health strategy design and management should be strengthened to ensure the quality of life for the population in the future.
The results showed that the life expectancy of the Chinese people would continuously increase, but life expectancy with disability would also keep increasing. Older adults with disabilities are among the most severely affected, as their age coupled with disabilities would impede their full and equal participation in all aspects of life. Therefore, understanding trends and estimations in the prevalence of disabilities is key to assessing the implications of aging for population health (8). The findings from the disability forecast were important scientific and political references to healthy life expectancy improvement and disease burden declining, healthy aging, and active aging.
This study was subject to some limitations. Because of restrictions associated with the Seventh Census and other demographic materials, the findings should be interpreted with caution. Although three hypothetical scenarios were set up, an inevitable bias between the predicted results and the real results existed. For example, fertility policy may change in the future, and the TFR might be not in the range of our assumptions. More studies should be taken to fix these issues in the future.
In conclusion, this study predicts population trends and associated health indicators influenced by population aging in China. The uncertainties in population structure and health will lead to challenges in political strategies and management of population. Future health action plans should consider the uncertainties of multiple scenarios in the future and promptly adjust health strategies to reflect innovations and real health impacts caused by aging and disability.
Acknowledgements: All the colleagues from local institutions in the data collection.
Conflicts of interest: No competing interests declared.
PLAD 0–14 years (%) 15–59 years (%) 60+ years (%) Beijing 11.84 68.53 19.63 Tianjin 13.47 64.87 21.66 Hebei 20.22 59.92 19.85 Shanxi 16.35 64.72 18.92 Inner Mongolia 14.04 66.17 19.78 Liaoning 11.12 63.16 25.72 Jilin 11.71 65.23 23.06 Heilongjiang 10.32 66.46 23.22 Shanghai 9.80 66.82 23.38 Jiangsu 15.21 62.95 21.84 Zhejiang 13.45 67.86 18.70 Anhui 19.24 61.96 18.79 Fujian 19.32 64.70 15.98 Jiangxi 21.96 61.17 16.87 Shandong 18.78 60.32 20.90 Henan 23.14 58.79 18.08 Hubei 16.31 63.26 20.42 Hunan 19.52 60.60 19.88 Guangdong 18.85 68.80 12.35 Guangxi 23.63 59.69 16.69 Hainan 19.97 65.38 14.65 Chongqing 15.91 62.22 21.87 Sichuan 16.10 62.19 21.71 Guizhou 23.97 60.65 15.38 Yunnan 19.57 65.52 14.91 Xizang (Tibet) 24.53 66.95 8.52 Shaanxi 17.33 63.46 19.20 Gansu 19.40 63.57 17.03 Qinghai 20.81 67.04 12.14 Ningxia 20.38 66.09 13.52 Xinjiang 22.46 66.26 11.28 Abbreviation: PLAD=provincial-level administrative division. Table 1. Age structure of population in China by PLAD, Seventh Census, 2020.
| Citation: |


 Download:
