

 Download:


-
World Health Organization (WHO) has identified osteoarthritis (OA) as the fastest growing major public health problem and the second leading cause of disability globally. OA is a disease that affects entire joints, leaving no tissues unaffected. The complete pathway that leads to destruction of joints is unknown (1). According to the Department of Bone and Joint Epidemiology of Peking University People’s Hospital, the number of disability-adjusted life years lost in China per 100,000 caused by OA increased from 92.5 in 1990 to 98.8 in 2017 (2). The overall prevalence of OA among people over the age of 65 in China was 8.1% (3). OA causes huge economic burdens on patients, families, and society; it most commonly affects the hands, hips, knees, and spine, with knee joint involvement being the most common (4). For many years the seriousness of OA has been emphasized, but there are few large-sample-size epidemiological OA cohorts established in our country, as OA epidemiology is still in its infancy. Despite many investigations and studies having been repeated in a variety of areas, resulting data have not been well recognized internationally due to inconsistencies in testing methods and diagnostic standards (5). This study is based on the Big Data Information Platform of Health in Yichang City, which includes diagnostic and treatment information from OA-related visits by 817,700 permanent residents, over a 6-month period, in 5 administrative regions, 10 tertiary hospitals, and 26 community health service centers. The study could provide a basic description of Yichang’s OA situation and help form the basis for public health risk assessments and policymaking.
Yichang Big Data Platform on Health serves 817,700 permanent residents and the outpatient records, inpatient records, prescription drug data, and physical examination records are all included. An one-person-one-card system is used to accurately track urban residents.
The research conducted a retrospective analysis of deidentified healthcare data from the Big Data platform. The study passed ethical review; unique identification codes were recoded. Patients diagnosed with OA who had records in the Big Data platform from January 1, 2017 to December 31, 2018 were selected. Patients with ICD codes M15-M19 who met imaging OA diagnostic criteria were included in the analytic data set. The OA cases in this analysis were redefined as at least one OA out-patient or in-patient visit, and those with multiple visits were classified as one OA patient and the earliest visit time was retained. SAS software package (version 9.4, 100 SAS Campus Drive Cary, NC 27513, USA) was used for descriptive analyses by age, gender, and joint.
There were 16,745 patients who met inclusion criteria during the study period with a total of 23,460 visits, with an average of 1.40 visits. The mean age and standard deviation were 58.69±15.18 years; there were more females than males (Figure 1). The largest proportions of patients were among 60–69 years old, followed 50–59 years old and 70–79 years old (Figure 2). Outpatient and inpatient treatment rates were highest in the spring (Figure 3).
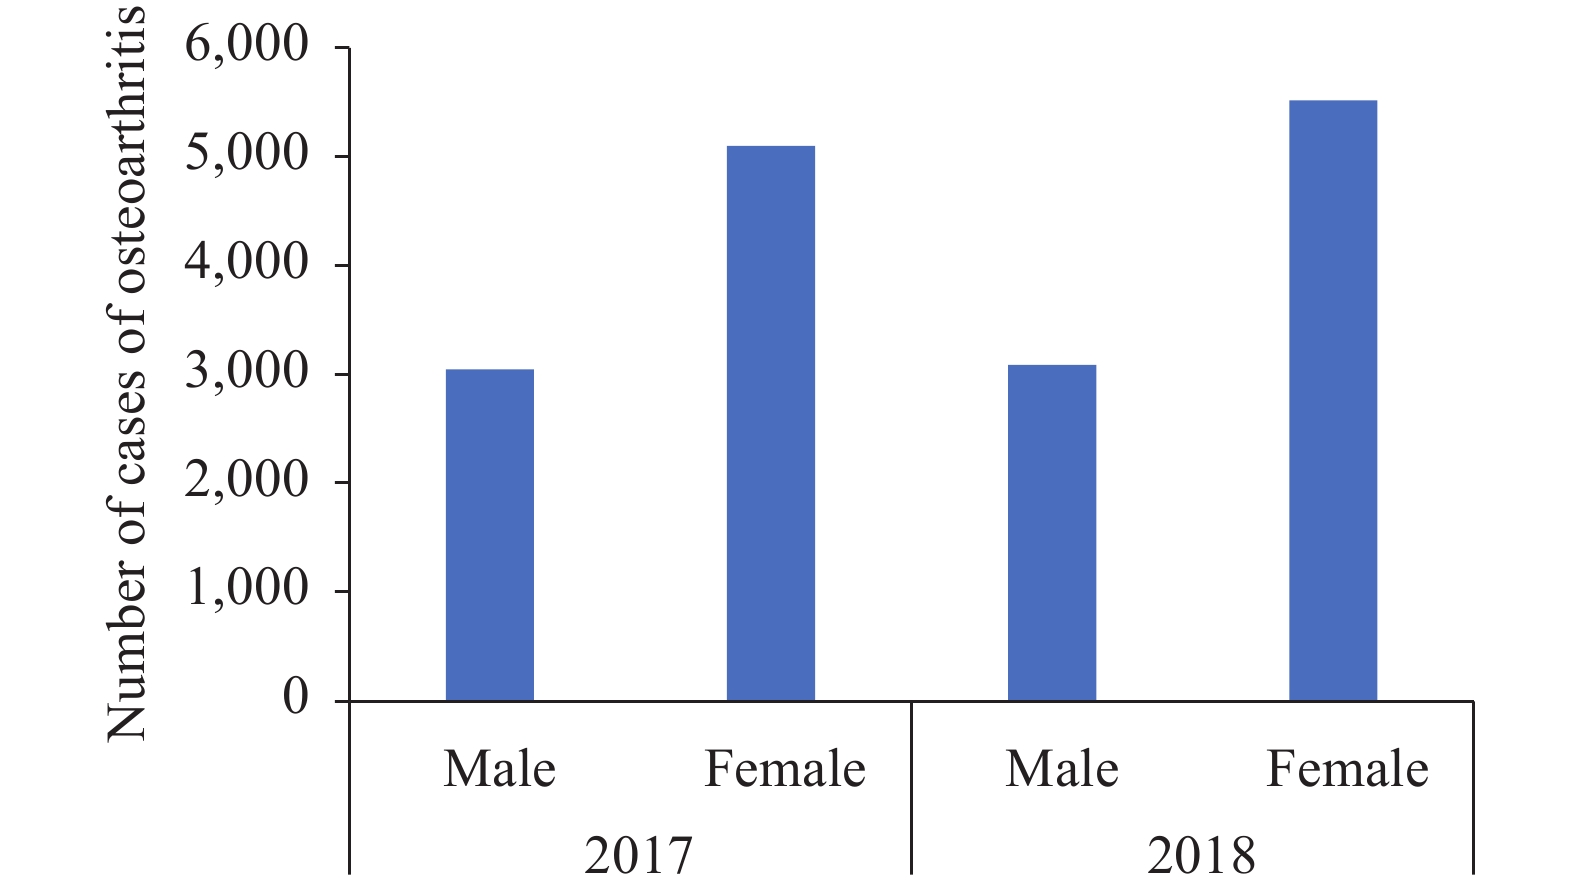 Figure 1.
Distribution of osteoarthritis (OA) by gender and year from 2017 to 2018, Yichang City, Hubei province, China.
 Figure 2.
Distribution osteoarthritis (OA) in different age groups by study year from 2017 to 2018, Yichang City, Hubei Province, China.
 Figure 3.
Outpatient and hospitalized attendance of osteoarthritis (OA) patients by month from 2017 to 2018, Yichang City, Hubei Province, China.
ICD-10 codes M15–M19 were polyarthropathy (M15), coxarthropathy (M16), knee OA (M17), arthrosis of first carpometacarpal joint (M18), and other joint diseases (M19) (Table 1). Knee OA was the most common diagnosis, with women more affected than men. Among 50–59 years old, M16, M18, and M19 were the most prevalent diagnostic codes. In 2017, the highest number of M15 OA patients were 50–59 years old; while in 2018, the highest number of M15 OA patients were 60–69 years old. In both 2017 and 2018, M17 OA patients, aged 60 to 69 years, represented the highest number of cases.
Feature 2017 2018 All Male Female All Male Female All N N (%) N (%) N (%) N (%) N (%) N (%) Polyarthropathy (M15) 0–29 12 2.38 19 3.76 31 6.14 8 0.89 8 0.89 16 1.78 47 30–39 8 1.58 16 3.17 24 4.75 12 1.33 26 2.89 38 4.22 62 40–49 21 4.16 39 7.72 60 11.88 31 3.44 72 7.99 103 11.43 163 50–59 48 9.50 82 16.24 130 25.74 64 7.10 184 20.42 248 27.52 378 60–69 48 9.50 71 14.06 119 23.56 77 8.55 178 19.76 255 28.30 374 Over 70 52 10.30 89 17.62 141 27.92 115 12.76 126 13.98 241 26.75 382 All 189 37.43 316 62.57 505 100.00 307 34.07 594 65.93 901 100.00 1,406 Coxarthropathy (M16) 0–29 5 2.23 7 3.13 12 5.36 15 4.59 10 3.06 25 7.65 37 30–39 4 1.79 3 1.34 7 3.13 11 3.36 13 3.98 24 7.34 31 40–49 18 8.04 20 8.93 38 16.96 27 8.26 23 7.03 50 15.29 88 50–59 21 9.38 42 18.75 63 28.13 31 9.48 40 12.23 71 21.71 134 60–69 20 8.93 42 18.75 62 27.68 30 9.17 43 13.15 73 22.32 135 Over 70 19 8.48 23 10.27 42 18.75 32 9.79 52 15.90 84 25.69 126 All 87 38.84 137 61.16 224 100.00 146 44.65 181 55.35 327 100.00 551 Gonarthrosis (M17) 0–29 72 1.81 81 2.04 153 3.85 66 1.16 63 1.11 129 2.27 282 30–39 88 2.21 109 2.74 197 4.95 111 1.95 115 2.02 226 3.98 423 40–49 204 5.13 284 7.14 488 12.27 238 4.19 376 6.62 614 10.81 1,102 50–59 282 7.09 627 15.77 909 22.86 423 7.45 865 15.23 1,288 22.68 2,197 60–69 363 9.13 869 21.85 1,232 30.98 518 9.12 1,322 23.27 1,840 32.39 3,072 Over 70 335 8.42 663 16.67 998 25.09 535 9.42 1,048 18.45 1,583 27.87 2,581 All 1,344 33.79 2,633 66.21 3,977 100.00 1,891 33.29 3,789 66.71 5,680 100.00 9,657 Arthrosis of first carpometacarpal joint (M18) 0–29 1 5.56 0 0.00 1 5.56 1 4.00 0 0.00 1 4.00 2 30–39 1 5.56 4 22.22 5 27.78 3 12.00 5 20.00 8 32.00 13 40–49 3 16.67 0 0.00 3 16.67 1 4.00 1 4.00 2 8.00 5 50~59 1 5.56 4 22.22 5 27.78 3 12.00 5 20.00 8 32.00 13 60–69 1 5.56 1 5.56 2 11.11 2 8.00 5 20.00 7 28.00 9 Over 70 2 11.11 0 0.00 2 11.11 3 12.00 3 12.00 6 24.00 8 All 9 50.00 9 50.00 18 100.00 11 44.00 14 56.00 25 100.00 43 Other arthrosis (M19) 0–29 127 3.71 185 5.41 312 9.12 29 1.74 27 1.62 56 3.36 368 30–39 172 5.03 192 5.61 364 10.64 61 3.66 46 2.76 107 6.42 471 40–49 235 6.87 383 11.19 618 18.06 97 5.82 134 8.04 231 13.87 849 50–59 266 7.77 534 15.60 800 23.38 187 11.22 256 15.37 443 26.59 1,243 60–69 268 7.83 395 11.54 663 19.37 176 10.56 243 14.59 419 25.15 1,082 Over 70 351 10.26 314 9.18 665 19.43 180 10.80 230 13.81 410 24.61 1,075 All 1,419 41.47 2,003 58.53 3,422 100.00 730 43.82 936 56.18 1,666 100.00 5,088 Table 1. Characteristics of different types of osteoarthritis in 2017–2018, Yichang City, Hubei Province, China.
HTML
-
OA is a clinically common chronic degenerative disease and is the leading cause of impaired mobility and dysfunction in middle-aged and elderly people (6). Yichang is located in the southwest of Hubei Province. By 2020, the city had jurisdiction over 5 municipal districts, 3 county-level cities, 3 counties, and 2 autonomous counties, with a total area of 21,000 square kilometers, a permanent population of 4.1 million, and a registered population of 3.9 million. Its Big Data Platform for Health Management covers all 13 counties and urban districts of the city, as well as the 4.1 million permanent residents; it collects more than 1.8 million pieces of data every day, and stores more than 4 billion pieces of data. Interconnection maturity has reached Grade 4 A. Since its inception in 2014, data quality has been confirmed by published studies(7). Using the big data of Yichang, we analyzed the epidemiological characteristics of osteoarthritis by gender, age, and disease type to provide a foundation for overall management and clinical treatment of OA.
In 2017, China had 61.2 million OA patients, with an age-standardized prevalence of 3.1% (2). Based on number of the permanent residents in the Yichang urban area (817,700), we estimate that there are about 25,349 OA patients in the city in 2017. Among OA patients, 32.14% went to see a doctor, which reflects the low rate of doctor visits among patients with OA. This may be due to the fact that many patients are not fully aware of OA and consider it a normal phenomenon of aging and are ignored (8). As the population ages, so will the disease burden of OA. The proportion of OA patients in the study population was the highest between the ages of 60 and 69, with women higher than men, which is consistent with most epidemiological studies. The average age of onset for OA is around 20 years, and the majority of cases are asymptomatic. As people get older, the incidence rises; OA becomes most common after middle age (9), affecting women more than men (10). Although the effect of estrogen on OA has been extensively studied, its mechanism of action remains unknown (11).
The spring season has the highest number of OA hospitalizations. It is not clear if this is due to changing weather. People suffering from OA often believe that changes in the weather exacerbate pain (12). More research is needed to understand the relation between OA and climate change, if any. In our study, the proportion of patients with knee OA aged 60–69 years was higher in women than men from 2017 to 2018, followed by other joint diseases (M19), polyarthropathy (M15), coxarthropathy (M16), and arthrosis of first carpometacarpal joint (M18). According to Sun X et al., the prevalence of knee OA in middle-aged and elderly people in China was 21.51%; women are more likely to develop knee OA than men (13).
This study was subject to some limitations. First, we only analyzed OA patients who went to outpatient clinics or were hospitalized for diagnosis and treatment. The number of patients with OA was slightly underestimated due to exclusion of patients who did not seek medical attention. Second, because our study only covers the urban population of Yichang City, this exploratory research may have underestimated the number of OA patients. Data on the incidence and prevalence of OA in rural areas were not included. The incidence and prevalence of OA should be able to be analyzed in greater detail as the Big Data on Health Platform matures.
In China, the prevalence of OA among middle-age and elderly people was high. With increases in the size of the elderly population, the burden of disease caused by OA may increase. It is necessary to strengthen publicity to improve people's awareness of self-health care of bone and joint; advocate early detection, early diagnosis, and early treatment; and increase the rate of diagnosis of OA to reduce the burden of disease brought by OA. Interventions and preventive strategies targeting high-risk groups are urgently needed in order to improve healthy bones and healthy life quality among middle-age and elderly people.
Acknowledgements: Yong Xu, Pei Zhang, Chengzhong Xu, and Fangfang Lu from Yichang Center for Disease Control and Prevention, Hubei Province; Feng Tan, Shicheng Yu, Dapeng Yin, Lance Rodewald, and Peter Hao from Chinese Center for Disease Control and Prevention.
Conflicts of interest: The authors who have taken part in this study declared that they did not have any other potential conflicts of interest.
Funding: National Science and Technology Major Project of China (2012CB955500, 2012CB955504), National Key R&D Program of China (2018YFC1315305).
| Citation: |

|