
 Download:


-
With rapid socioeconomic development, the nutritional status of the Chinese population has been greatly improved, but overweight and obesity are becoming more and more concerning. In addition, underweight malnutrition in the elderly population is largely ignored and even considered as a normal phenomenon of aging (1). Underweight malnutrition can increase the risk of anemia, nutrition-deficient neuropathy, and infection and can cause several other diseases in older people (2), which can ultimately result in a substantial socioeconomic burden (3-4). A study in the Netherlands in 2011 reported that the extra cost of managing diseases related to underweight malnutrition was about $1.9 billion, accounting for 2.1% of the Dutch national health expenditure (5). To analyze this problem in China, data of four national representative surveys was analyzed to evaluate trends of underweight malnutrition during these decades, and the results from this study helped provide a scientific basis for further formulation of accurate prevention and intervention strategies of underweight malnutrition in the elderly population.
Data was extracted from four nationally representative surveys, which were the National Nutrition Survey in 1992 (NNS 1992) (6), the China National Nutrition and Health Survey in 2002 (CNNHS 2002) (7), the China Nutrition and Health Surveillance in 2010–2013 (CNHS 2010–2013) (8), and the China Adult Chronic Disease and Nutrition Surveillance 2015 (CACDNS 2015) (9). Each of these surveys were stratified multistage cluster random sampling in nationwide. Of the four surveys, in person interviews using uniform questionnaires were conducted at a local site for respondents to collect demographic and socioeconomic information such as age, gender, and other characteristics by trained staff. Anthropological measurement of height and weight were measured using uniform measurement instruments with strict quality control by trained staff at local community health service centers. Weight of participants wearing no shoes and light clothing was measured to the nearest 0.1 kg and height was determined to the nearest 0.1 cm with no shoes. Body mass index (BMI) was calculated by the formula of weight in kilograms divided by height squared in meters. BMI lower than 18.5 kg/m2 was diagnosed to be underweight malnutrition according to the criteria of adult weight determination (10). These four surveys were all organized by National Institute for Nutrition and Health of China CDC and were approved by the Ethics Committee of China CDC (Former Chinese Academy of Preventive Medicine). All respondents signed informed consent forms and those aged 60 and above in the four surveys were included in this study.
SAS software (version 9.4, SAS Institute Inc., Cary, NC, USA) was applied for statistical analysis and Student’s t-tests, ANOVA, and chi-squared tests were used to compare differences between participants among subgroups. As the age and gender distribution of the surveyed population was different between these four surveys, we calculated standard values using PROC SURVEYFREQ procedures in SAS for prevalence of underweight malnutrition based on the 2010 national census data (11). Bilateral P<0.05 was considered as statistically significant.
The general characteristics of participants in the 4 surveys were shown in Table 1. There were 6,714 (2,687 in urban areas and 4,027 in rural) elderly participants in 1992 survey, and those aged 75 years and above accounted for 13.7% of this population in urban areas and 13.5% in rural areas. Female accounted for 49.1% in the urban areas and 48.6% in the rural areas. As for education level, most participants only had primary school education or lower, 17.6% of the participants had junior middle school and above in urban areas and 2.2% in rural areas. Most of participants had a significant other accounting for 79.6% in urban areas and 72.2% in rural areas. In the 2002 survey and surveillance in 2010–2012 and 2015, the number of participants increased to 26,566 (54.4% in rural areas), 36,388 (45.8% in rural), and 58,750 (57.9% in rural). The proportion in these 3 datasets of elderly residents aged 75 years and above was 14.2%, 18.1%, and 15.5% in urban areas, respectively, and 12.5%, 15.6%, and 14.6% in rural areas, respectively. The percentage of illiteracy decreased while the percentage of at least primary school education and junior middle school education increased from 1992 to 2015. The percentage of urban participants with an education level of primary school or above was higher than that of rural participants (P<0.001). As for income, the proportion of low-income levels of participants had decreased to 6.0% in urban areas and 15.7% in rural areas in 2015. Among the group aged 60–74 years, the average BMI in 1992 was 24.1 kg/m2 in urban areas and 21.1 kg/m2 in rural areas and then increased in the survey in 2015 to 24.9 kg/m2 in urban areas and 23.7 kg/m2 in rural areas. Similarly, the BMI level among the group aged 75 years and above also increased from 22.3 kg/m2 to 24.1 kg/m2 in urban areas and from 20.3 kg/m2 to 22.5 kg/m2 in rural areas during the survey intervals. There were statistically significant differences in the age group, education level, income, marital status, and BMI level when compared among these surveys (P<0.001).
Variables 1992* 2002 2010–2012 2015 P value ¶ Urban
(n=2,687)Rural
(n=4,027)Urban
(n=12,099)Rural
(n=14,467)Urban
(n=19,731)Rural
(n=16,657)Urban
(n=24,727)Rural
(n=34,023)Age groups (n, %) <0.001 60–74 years 2,319 (86.3) 3,484 (86.5) 10,384 (85.8) 12,658 (87.5)§ 16,150 (81.9) 14,062 (84.4)§ 20,888 (84.5) 29,041 (85.4)§ 75– years 368 (13.7) 543 (13.5) 1,715 (14.2) 1,809 (12.5) 3,581 (18.1) 2,595 (15.6) 3,839 (15.5) 4,982 (14.6) Sex (n, %) 0.062 Male 1,367 (50.9) 2,069 (51.4) 5,913 (48.9) 7,557 (52.2)§ 9,144 (46.3) 8,271 (49.7)§ 11,922 (48.2) 17,628 (51.8)§ Female 1,320 (49.1) 1,958 (48.6) 6,186 (51.1) 6,910 (47.8) 10,587 (53.7) 8,386 (50.3) 12,805 (51.8) 16,395 (48.2) Education level (n, %) <0.001 Unknown 792 (30.2) 2,691 (68.4) 20 (0.2) 43 (0.3)§ 1 (0.0) – – – Illiteracy 624 (23.8) 703 (17.9) 2,585 (21.4) 6,290 (43.5) 3,110 (15.8) 5,479 (32.9)§ 4,399 (17.8) 11,442 (33.6)§ Primary school 744 (28.4) 457 (11.6) 3,862 (31.9) 5,792 (40.0) 6,564 (33.3) 7,703 (46.2) 8,745 (35.4) 16,494 (48.5) Junior high school 259 (9.9) 60 (1.5) 2,646 (21.9) 1,625 (11.2) 5,444 (27.6) 2,820 (16.9) 6,707 (27.1) 4,690 (13.8) Senior high school 72 (2.7) 11 (0.3) 1,753 (14.5) 610 (4.2) 3,012 (15.3) 582 (3.5) 3,224 (13.0) 1,231 (3.6) College and above 130 (5.0) 14 (0.4) 1,233 (10.2) 107 (0.7) 1,600 (8.1) 73 (0.4) 1,652 (6.7) 166 (0.5) Income† (n, %) <0.001 Low 864 (32.2) 1,431 (35.5) 5,078 (42.0) 12,920 (89.3)§ 3,347 (17.0) 7,806 (46.9)§ 1,491 (6.0) 5,353 (15.7)§ Middle 936 (34.8) 1,313 (32.6) 3,893 (32.2) 1,018 (7.0) 3,335 (16.9) 4,281 (25.7) 1,717 (6.9) 4,007 (11.8) High 887 (33.0) 1,283 (31.9) 2,792 (23.1) 309 (2.1) 11,592 (58.8) 3,854 (23.1) 8,262 (33.4) 5,669 (16.7) No response – – 336 (2.8) 220 (1.5) 1457 (7.4) 716 (4.3) 13,257 (53.6) 18,994 (55.8) Marital status (n, %) <0.001 Single 13 (0.5) 55 (1.4) 81 (0.7) 142 (1.0)§ 102 (0.5) 142 (0.9) 109 (0.4) 308 (0.9) Have a partner 2,097 (79.6) 2,849 (72.2) 9,677 (80.0) 10,982 (75.9) 16,277 (82.5) 13,584 (81.6) 2,1941 (88.7) 29,993 (88.2) Divorced 17 (0.6) 15 (0.4) 109 (0.9) 109 (0.8) 198 (1.0) 121 (0.7) 127 (0.5) 86 (0.3) Widowed 506 (19.2) 1,028 (26.0) 2,232 (18.4) 3,234 (22.4) 3,154 (16.0) 2,810 (16.9) 2,550 (10.3) 3,636 (10.7) BMI [kg/m2, mean (SD)] <0.001 60–74 years 24.1 (4.1) 21.1 (3.2) 24.8 (3.7) 22.2 (3.6)§ 24.6 (3.4) 23.3 (3.6)§ 24.9 (3.5) 23.7 (3.5)§ 75– years 22.3 (3.8) 20.3 (3.2) 23.6 (3.8) 21.3 (3.3) 23.9 (3.6) 22.2 (3.5) 24.1 (3.5) 22.5 (3.4) Note: − means data are unavailable;
Abbreviation: BMI=body mass index;
* Because original data was inaccessible, the results were extracted from the published book of “The dietary and nutritional status of Chinese population — elderly (1992 National Nutrition Survey)”;
† The value of income was published as continuous data in the survey conducted in 1992, but income was categorical data in other surveys. Therefore, low income was defined as household income lower than 5,000 CNY per capita annually; middle income was defined as 5,000–9,999 CNY per capita annually; and high level was defined as 10,000 CNY and above per capita annually in the other three surveys;
§ Difference between urban areas and rural areas in independent survey, P<0.01;
¶ Comparison of general characteristics among the three surveys.Table 1. General characteristics of participants aged 60 years and above in China, 1992–2015.
Table 2 showed the distribution of prevalence of underweight malnutrition among older participants in the four surveys. Although the underweight prevalence decreased in both urban and rural areas, it was significantly higher in older respondents of rural areas than that in urban areas in subgroups of age, gender, and education level from 1992 to 2015 (P<0.05). Underweight malnutrition was much higher in the group aged 75 years and above in rural areas than that in other age groups, which was still 10.9% in the surveillance in 2015. As for older female participants in rural areas, the prevalence of underweight malnutrition decreased from 21.5% in 1992 to 5.8% in 2015 with a proportion decrease of 73.0%. In addition, underweight malnutrition proportion in individuals with unknown education levels and illiteracy subgroups in rural areas was 6.7% in 2015, which was still higher than that in other education subgroups. Meanwhile, it was interesting that undernutrition among the elderly in single, divorced and widowed status of marital was much higher than that in having partners, which was 7.1%, 9.3%, and 8.3% respectively in 2015.
Variables 1992* 2002 2010–2012 2015 P value ¶ Urban Rural Urban Rural Urban Rural Urban Rural Total 227 (8.6) 799 (20.3) 573 (4.5) 2,028 (15.4) 698 (3.8) 1,380 (9.1) 706 (2.8) 689 (6.6) <0.001 Age groups 60–74 years 168 (7.4) 642 (18.8) 426 (4.1) 1,659 (13.1)§ 492 (3.0) 1,014 (7.2)§ 508 (2.4) 1,445 (5.0)§ <0.001 75– years 59 (16.5) 157 (30.0) 147 (8.6) 369 (20.4)§ 206 (5.8) 366 (14.1)§ 198 (5.2) 545 (10.9)§ <0.001 Gender Male 109 (8.2) 385 (19.1) 305 (5.2) 1,047 (13.9)§ 338 (3.7) 717 (8.7)§ 350 (2.9) 1,045 (5.9)§ <0.001 Female 118 (9.1) 414 (21.5) 268 (4.3) 981 (14.2)§ 360 (3.4) 663 (7.9)§ 356 (2.8) 945 (5.8)§ <0.001 Education level Unknown/Illiteracy – – 189 (7.3) 959 (15.1)§ 195 (6.3) 506 (9.2)§ 189 (4.3) 765 (6.7)§ <0.001 Primary school – – 186 (4.8) 827 (14.3)§ 244 (3.7) 641 (8.3)§ 291 (3.3) 953 (5.8)§ <0.001 Junior high school – – 95 (3.6) 166 (10.2)§ 154 (2.8) 197 (7.0)§ 130 (1.9) 206 (4.4)§ <0.001 Senior high school – – 63 (3.6) 69 (11.3)§ 66 (2.2) 33 (5.7)§ 64 (2.0) 56 (4.5)§ <0.001 College and above – – 40 (3.2) 7 (6.5) 39 (2.4) 3 (4.1) 32 (1.9) 10 (6.0)§ 0.037 Income Low – – 317 (6.2) 1,885 (14.6)§ 189 (5.6) 737 (9.4)§ 63 (4.2) 316 (5.9)† <0.001 Middle – – 149 (3.8) 101 (9.9)§ 134 (4.0) 317 (7.4)§ 74 (4.3) 227 (5.7)† 0.325 High – – 84 (3.0) 26 (8.4)§ 332 (2.9) 254 (6.6)§ 185 (2.2) 343 (6.1)§ 0.535 No response – – 23 (6.8) 16 (7.3) 43 (3.0) 72 (10.1)§ 384 (2.9) 1,104 (5.8)§ 0.003 Marital status Single – – 7 (8.6) 19 (13.4) 8 (7.8) 17 (12.0) 7 (6.4) 22 (7.1) 0.063 Have a partner – – 408 (4.2) 1,437 (13.1)§ 544 (3.3) 1,084 (8.0)§ 598 (2.7) 1,659 (5.5)§ <0.001 Divorced – – 11 (10.1) 17 (15.6) 7 (3.5) 7 (5.8) 5 (3.9) 8 (9.3) <0.001 Widowed – – 147 (6.6) 555 (17.2)§ 139 (4.4) 272 (9.7)§ 96 (3.8) 301 (8.3)§ <0.001 Note: − means data are unavailable;
* Because original data was inaccessible, the results was from the published book of “The dietary and nutritional status of Chinese population — elderly (1992 National Nutrition Survey)”;
† Chi-squared test between urban areas and rural, P<0.05;
§ Chi-squared test between urban areas and rural, P<0.01;
¶ Chi-squared test among three surveys.Table 2. Underweight malnutrition proportion among participants aged 60 years and above in China, 1992–2015 (n, %).
Figure 1 showed the trends of underweight malnutrition prevalence among the participants. From 1992 to 2015, there was 80.5% decrease of underweight malnutrition among the elderly population. The underweight malnutrition prevalence decreased from 17.4% in 1992 to 9.4% in 2002 and then to 4.8% in 2010–2012 and then to 3.4% in 2015. Underweight malnutrition decreased from 20.3% in 1992 to 6.6%, a 67.5% reduction, in rural areas and from 8.6% to 2.8% in urban areas, a reduction of 67.4%. The reduction of underweight malnutrition prevalence in rural areas was significantly larger than that in urban areas. The prevalence of underweight malnutrition in males and females also decreased. In females, the prevalence of underweight malnutrition decreased dramatically from 16.5% in 1992 to 3.4% in 2015, a 79.4% reduction, and in males, the rate declined from 14.7% in 1992 to 3.5% in 2015, an average reduction of 76.2%. In each of four surveys, the prevalence of underweight malnutrition increased with age. Although there appeared a trend of decline from 1992 to 2015 for every age group, the prevalence of underweight malnutrition in the 75 years age group was the highest in each survey and was still 7.6% in 2015.
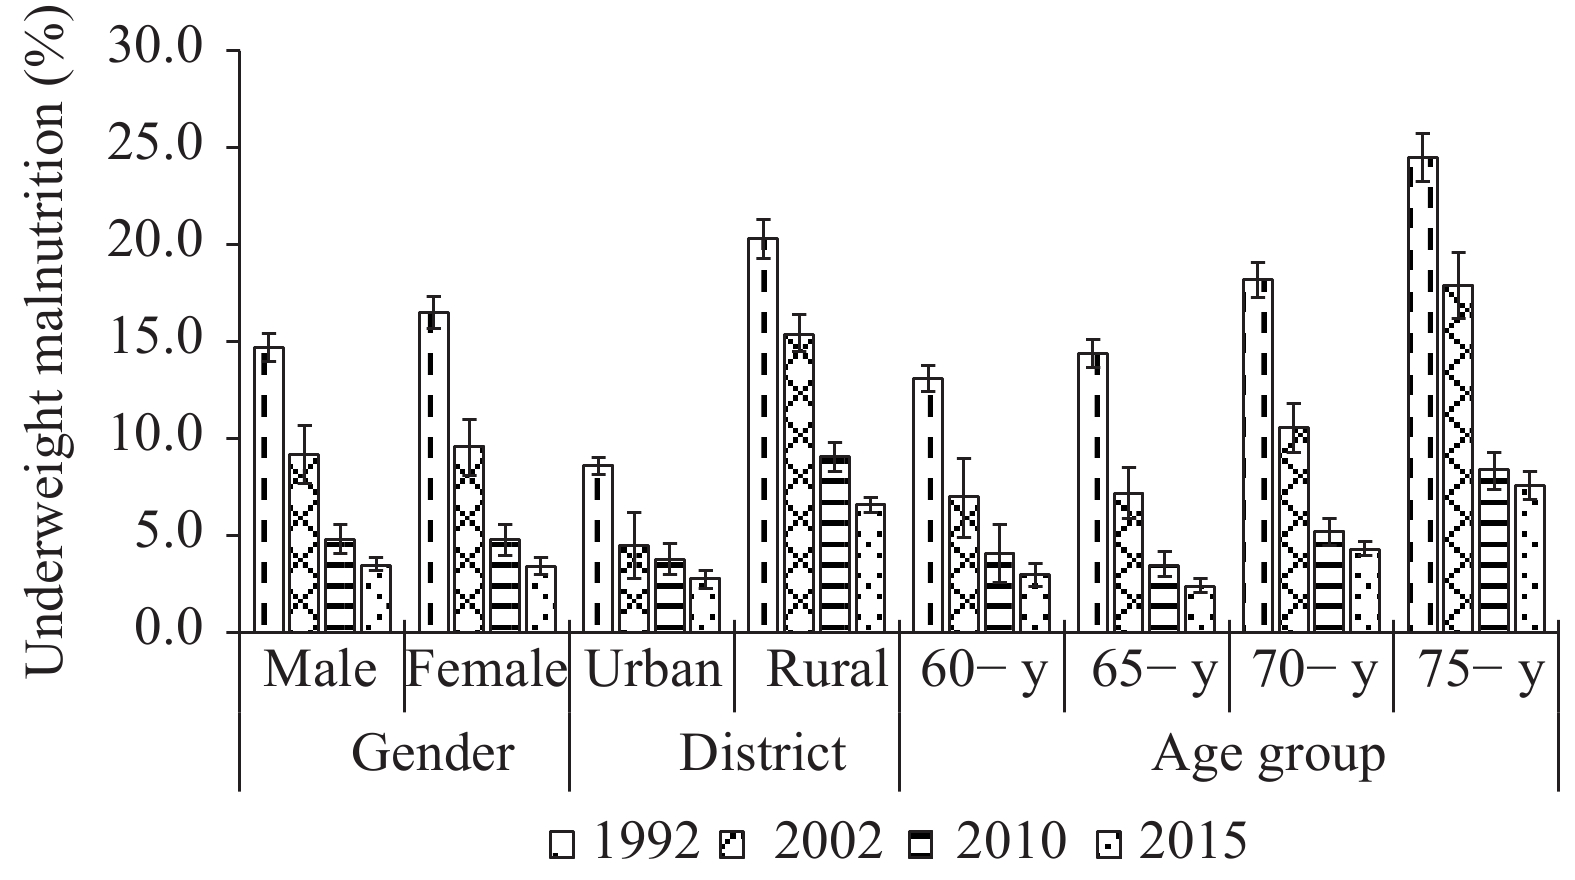 Figure 1.
Trends of underweight malnutrition among older adults aged 60 years and above in China, 1992–2015.
HTML
-
This study demonstrated that the prevalence of underweight malnutrition in the elderly population declined remarkably from 1992 to 2015. On one hand, the results showed that the nutritional status of older people had been greatly improved with socioeconomic development. On the other hand, we still need to pay attention to the elderly populations in rural areas who are still at high risk of underweight malnutrition.
Underweight malnutrition is associated with anemia, infection, and some NCDs that may lead to deterioration of health status and increasing risk of dependency and disability, which brings heavy social and family burdens (1,12). One study reported that early identification and treatment of underweight malnutrition could improve the outcomes and quality of life in the elderly (2). In the elderly population, underweight malnutrition increased with age because of digestive dysfunction and loss of appetite, which always influence the nutritional absorption and utilization. However, underweight malnutrition was not only being neglected by family members and doctors, but also ignored by the elderly themselves especially in rural areas. In our study, 7.6% of individuals 75 years old and above experienced underweight malnutrition in the 2015 surveillance. Many elderly people in rural areas continued to work for a living but additionally had to care for their grandchildren left behind by parents working away from home. Due to less developed economic conditions, lack of medical resources, lower levels of education, living alone, poor nutritional knowledge, and low dietary quality, many older people have serious nutritional and health problems and their nutritional status was not improved in rural areas (13). Therefore, precise nutrition improvement action plans and health management of underweight malnutrition should be carried out for these elderly people, especially as China experiences population aging. It is necessary to carry out malnutrition screening and nutritional status assessment in the community combined with basic public health services. For high-risk groups and patients of underweight malnutrition, we need to make treatment and management as early as possible. Meanwhile, education on healthy diet and balanced nutrition and nutrition interventions and treatment among the elderly need to strengthen further.
This study was subject to some limitations. First, this study used secondary analysis of published data of the 1992 survey, which might not be as applicable when compared to the underweight malnutrition distribution among the 4 surveys. Second, data in this study were collected by qualified staff, but some anthropometric measurement biases may occur that influence the results. Third, although we analyzed standardized values based on the same national census data for variations in age, gender, and districts, the results were subjected to some level of bias or mistakes, especially for the difficulty to avoid the variation of BMI caused by the difference of sample size in these surveys.
Nevertheless, the study showed the nutritional status of the elderly during the past 23 years and provides valuable information on health maintenance and promotion for older people in China.
| Citation: |

|