
 Download:


-
Dengue fever (DF) has increased sharply worldwide, with cases increasing from 0.5 million in 2000 to 5.2 million in 2019 (1–2). In 2024, the number of reported cases surged to 14.4 million, with 11,000 deaths worldwide. Southeast Asia and the Western Pacific region bear the highest burden of severe cases and fatality rates, respectively, imposing a substantial public health burden (2–4).
Southeast Asia remains the primary source of imported dengue fever cases into China, and imported cases have repeatedly triggered large local outbreaks (5–6). The geographical scope of local transmission has expanded northward, affecting 28 provincial-level administrative divisions, 217 cities, and 895 counties by 2024, highlighting a growing public health challenge (5–6). However, comparative analyses of the epidemiological characteristics of imported and indigenous dengue fever cases nationwide are relatively scarce, particularly lacking the latest data following the coronavirus disease 2019 (COVID-19) pandemic (5–10). There is a notable lack of quantitative analyses assessing the importation-transmission risk across provinces and phases, as well as the origin counties of imported cases (5–11).
Therefore, based on the latest national surveillance data spanning 21 years (2005–2025), this study systematically analyzes differences between imported and indigenous cases in terms of seasonality, geographical distribution, and population distribution. It further quantifies the import-transmission risk ratios and their dynamic changes across different provinces and compares the dynamic differences of origin countries at the national and subnational levels, aiming to identify high-risk provinces and populations. These findings will provide evidence for the formulation of targeted region-specific prevention and control strategies in China.
HTML
-
Dengue fever case data were obtained from the National Notifiable Disease Reporting System (NNDRS), including cases reported by 31 provincial-level administrative divisions (PLADs) and the Xinjiang Production and Construction Corp (XPCC). The case data included demographic, clinical, and temporal variables. This study primarily conducted a comparative analysis of imported and local cases in Chinese PLADs.
-
Dengue fever cases were defined according to the Diagnostic Criteria for Dengue Fever (WS 216-2018) (12). Both clinically diagnosed and laboratory-confirmed cases reported in China between January 1, 2005, and December 31, 2025, were included. Imported dengue fever cases (13) were defined as cases in individuals with a history of travel to dengue-endemic countries or regions within 14 days before symptom onset, for which local infections were excluded through epidemiological investigation. Indigenous dengue fever cases (13) were defined as those occurring in individuals who had resided in China during the 14 days prior to symptom onset and had no history of international travel. Indigenous cases included both intra- and inter-provincial transmission.
-
The temporal, spatial, and population distributions of imported and indigenous dengue fever cases, as well as the source countries of imported cases in China and in the two high-burden PLADs of Guangdong and Yunnan from 2005 to 2025, were analyzed. The normality of continuous variables was assessed prior to analysis. Normally distributed data are presented as the mean ± standard deviation, while non-normally distributed data are summarized as median and interquartile range (IQR). Inter-group comparisons were conducted using appropriate non-parametric tests. Categorical data were computed as frequency (percentage) and compared using the chi-square test, with the significance level set at α=0.05. The transmission risk ratio of indigenous to imported cases was calculated for the 10 PLADs with the highest number of imported cases. A higher ratio indicates a greater number of indigenous cases relative to the given number of imported infections, corresponding to an elevated relative risk of local transmission. Microsoft Excel 2019 was used for data management and visualization. SPSS (version 27.0.1, IBM Corp, Armonk, New York, United States) was used to perform inter-group comparisons. R (version 4.3.3, Vienna University of Economics and Business, Vienna, Austria) was used to illustrate changes in the proportions of infection sources.
Data Sources
Case Definitions
Statistical Analysis
-
The number of dengue cases reported annually in China fluctuated significantly over the 21-year period, characterized by two distinct high-incidence cycles. Following a low-incidence phase (2005–2012, mostly <600 cases annually), the first major epidemic occurred in 2014, with a peak of 46,864 cases (Figure 1A). After a period of moderate fluctuations, a second epidemic cycle began in 2019 (22,188 cases), culminating in a second historical peak of 24,278 cases by 2024. The incidence dropped sharply in 2020–2021 (778 and 41 cases, respectively) owing to the COVID-19 pandemic before rebounding significantly from 2022 onward.
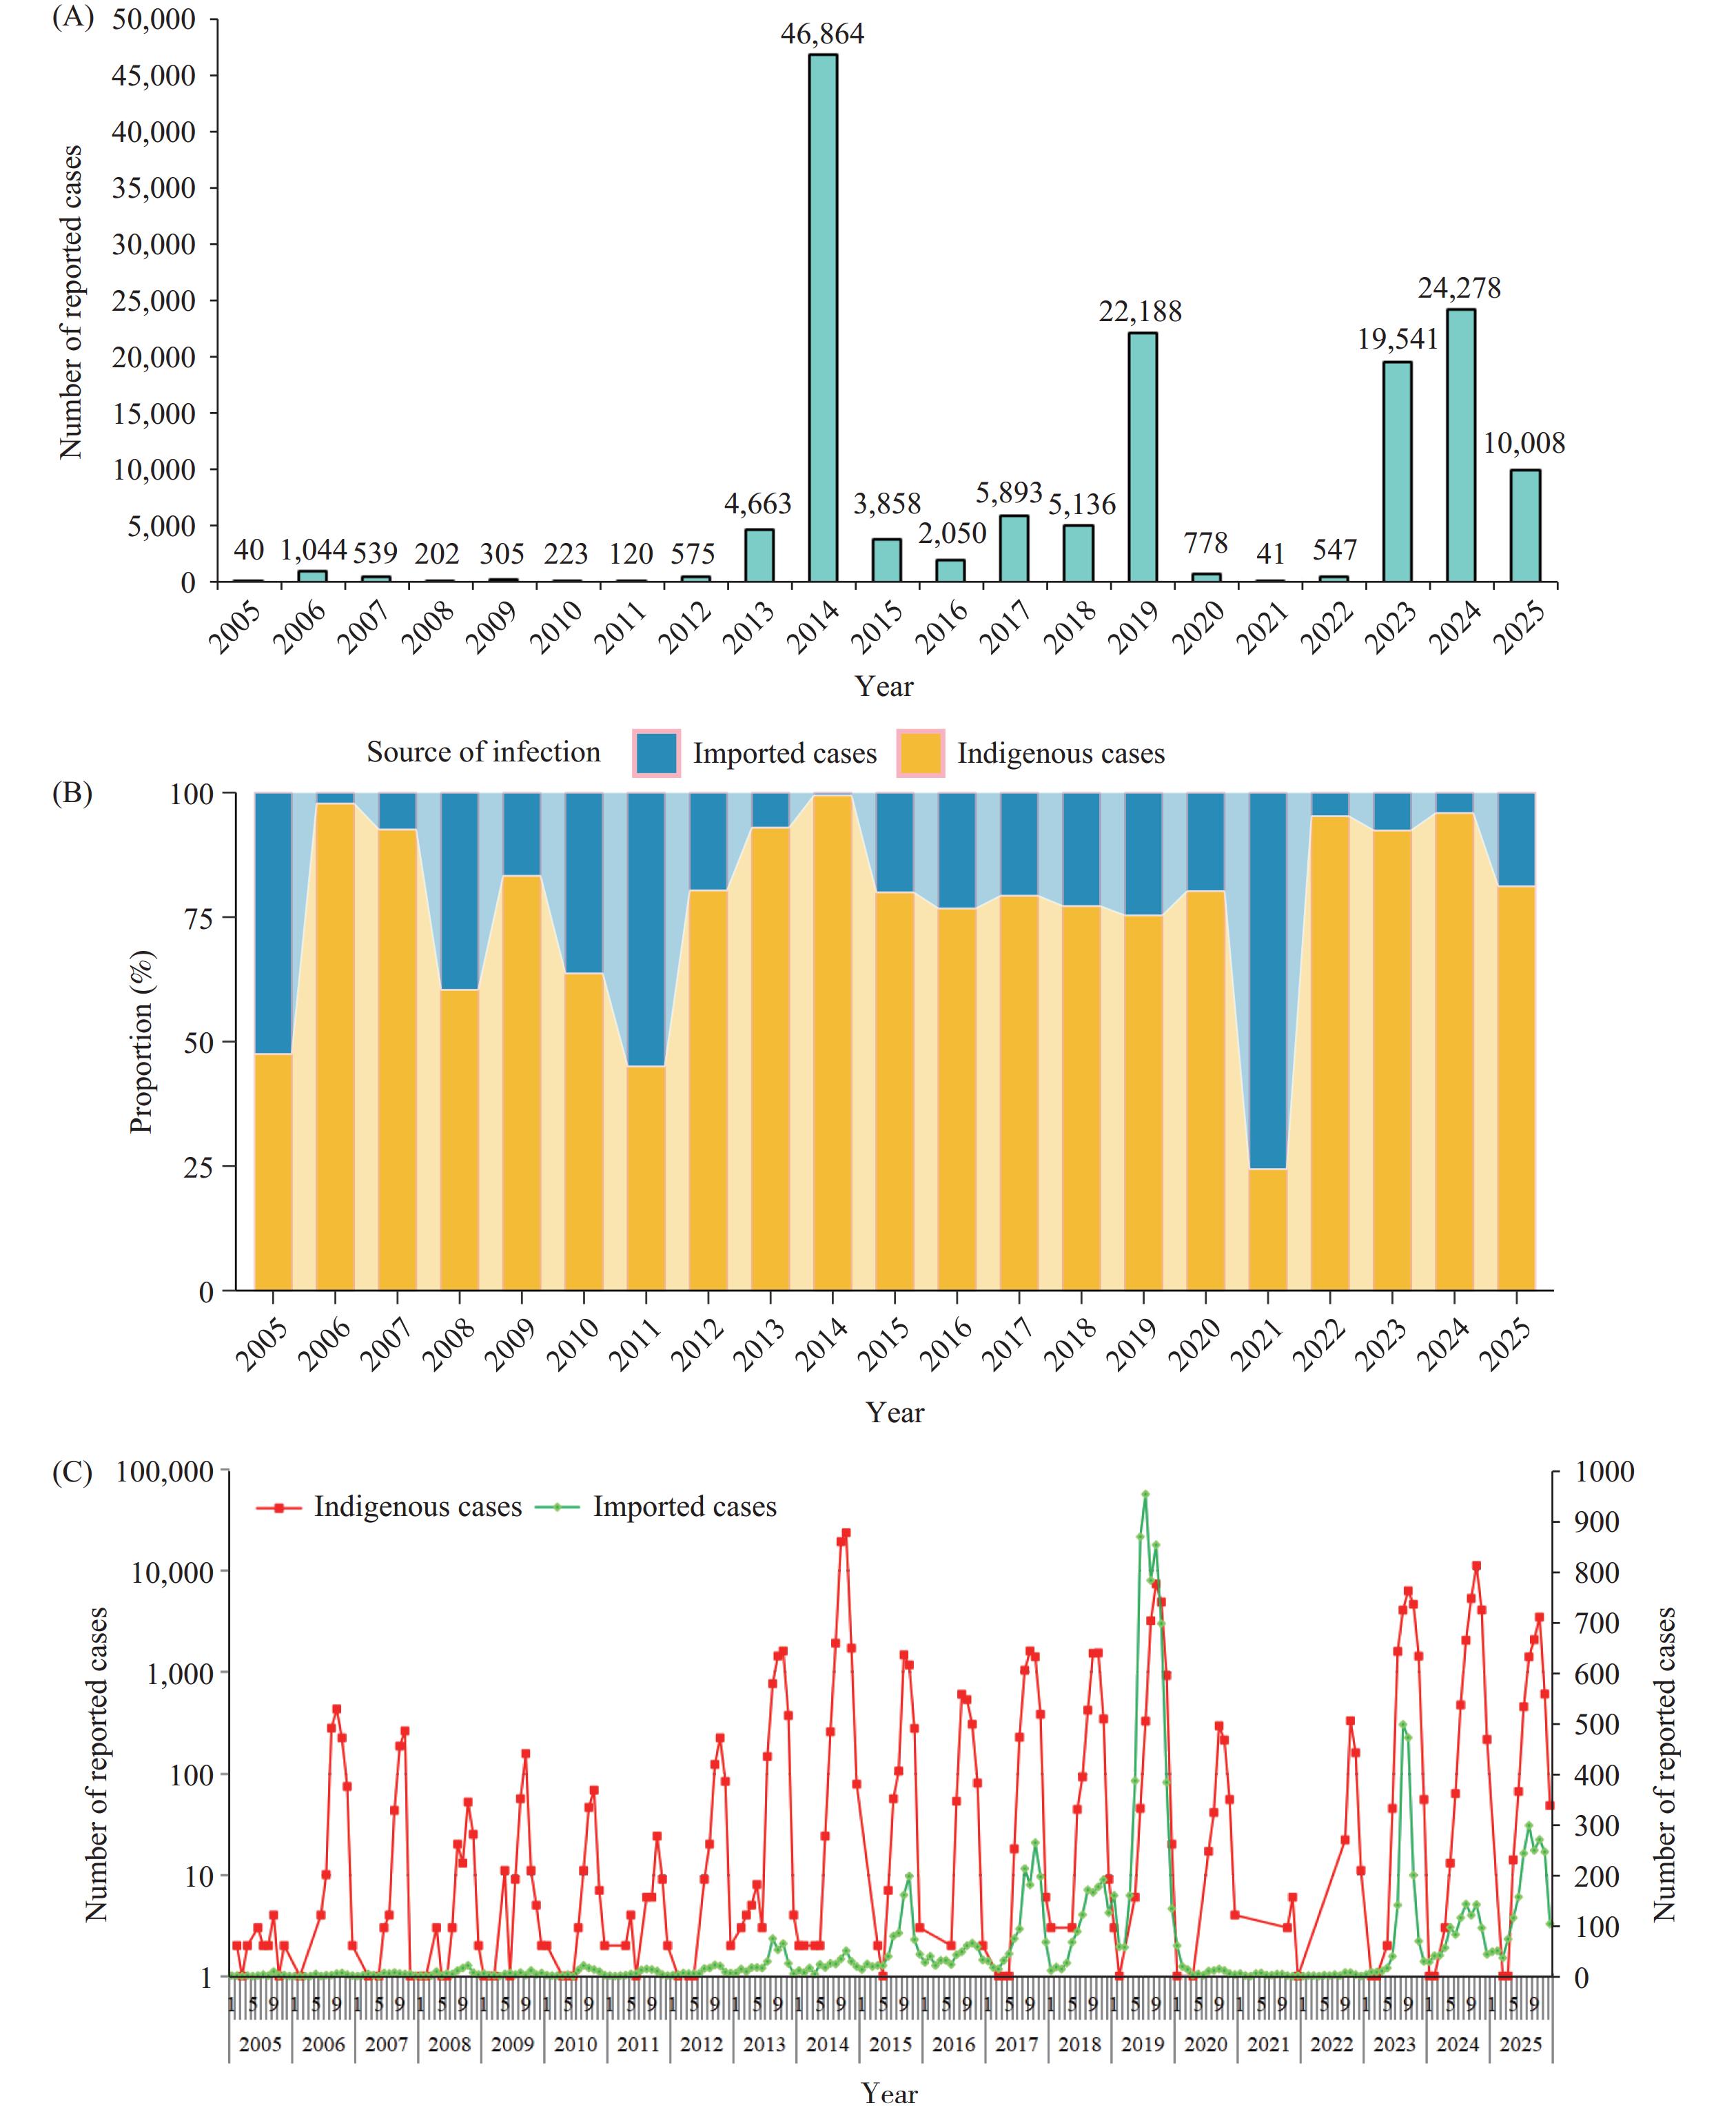 Figure 1.
Temporal trends of reported dengue fever cases in China. (A) Number of reported cases; (B) Percentage of infection sources; (C) Monthly distribution of reported cases.
-
Between 2005 and 2025, a total of 148,893 dengue fever cases were reported in China. Of these, 134,129 (90.1%) cases were indigenous, whereas 14,764 (9.9%) were imported (Figure 1A,
Supplementary Table S1 ). The epidemic was predominantly driven by indigenous transmission, with the annual reported numbers ranging from 10 to 46,605 during this long period (Figure 1B). In contrast, imported cases served as the initial trigger and maintained baseline presence (Figure 1A–1C,Supplementary Table S1 ). -
Indigenous cases peaked sharply in late summer and autumn. August, September, and October accounted for 118,885 cases (Supplementary Table S1). October accounted for 54,966 cases (41.0%), transmission was minimal from December to June (only 0.7% of the total indigenous cases).
Month Total, n (%) Imported cases (%) Indigenous cases (%) January 428 (100.0) 414 (96.7) 14 (3.3) February 320 (100.0) 306 (95.6) 14 (4.4) March 274 (100.0) 264 (96.4) 10 (3.6) April 479 (100.0) 455 (95.0) 24 (5.0) May 917 (100.0) 848 (92.5) 69 (7.5) June 1,764 (100.0) 1,433 (81.2) 331 (18.8) July 5,630 (100.0) 1,907 (33.9) 3,723 (66.1) August 18,416 (100.0) 2,423 (13.2) 15,993 (86.8) September 50,378 (100.0) 2,452 (4.9) 47,926 (95.1) October 57,191 (100.0) 2,225 (3.9) 54,966 (96.1) November 11,999 (100.0) 1,409 (11.7) 10,590 (88.3) December 1,097 (100.0) 628 (57.2) 469 (42.8) Total 148,893 (100.0) 14,764 (9.9) 134,129 (90.1) Table S1. Cumulative monthly distribution of imported and indigenous cases, 2005–2025.
-
Imported cases occurred throughout the year but showed distinct peaks. The number of imported cases began to increase in May (848) and June (1,433), before the local epidemic surge (
Supplementary Table S1 ). The highest numbers were recorded in August (2,423) and September (2,452). This pattern suggests that imported cases, which increase ahead of the local transmission season, are key drivers seeding local outbreaks. -
The monthly composition ratios of case types demonstrated a clear seasonal cycle. Imported cases were predominant from December to June, constituting over 95% of cases from January to April. A pivotal shift occurred in July, when indigenous cases outnumbered imported cases (
Supplementary Table S1 ). Indigenous cases dominated the peak period from August to October, comprising 86.8%, 95.1%, and 96.1% of cases, respectively. By December, the pattern had reverted, with imported cases exceeding indigenous cases (Figure 1C,Supplementary Table S1 ). -
The number of PLADs reporting indigenous cases increased from 8 in 2005 to 27 in 2023. From 2005 to 2025, Guangdong accounted for the highest number of indigenous cases (86,566), followed by Yunnan (28,771), Guangxi (4,179), Chongqing (3,402), Fujian (2,683), and Zhejiang (2,402) (
Supplementary Table S2 ). However, from 2019 to 2023, Yunnan reported significantly more indigenous cases than other PLADs, ranking first. From 2005 to 2018, Chongqing reported no more than 10 indigenous cases annually, but this number surged sharply to 1,269 in 2019 and 1,973 in 2025.In 2005, China reported imported dengue cases in 8 PLADs; by 2019, this had increased to 29 PLADs. By 2025, all 31 PLADs in China reported imported dengue cases, ranging from 1 to 4,173. The highest number of imported cases was recorded in Yunnan at 4,173 (28.3%) (
Supplementary Table S2 ). -
In 2005, imported cases originated from nine different countries or regions and had expanded to 52 countries by 2025. The majority of imported cases (87.1%) were from Southeast Asian countries, with Cambodia (29.1%), Myanmar (24.3%), and Thailand (8.0%) being the predominant source countries (Table 1). The composition shifted over time: the proportion from Southeast Asia was 79.1% during 2005–2009, decreased slightly to 76.2% in 2010–2014, peaked at 89.0% in 2015–2019 (driven by a surge from Cambodia, 41.1%), and reached 85.8% in 2020–2024, with Myanmar, Laos, and Cambodia becoming the leading sources (Table 1).
Source country Total, n (%) 2005–2009, n (%) 2010–2014, n (%) 2015–2019, n (%) 2020–2025, n (%) Southeast Asian countries 12,863 (87.1) 170 (79.1) 645 (76.2) 8,111 (89.0) 3,937 (85.8) Cambodia 4,294 (29.1) 18 (8.4) 21 (2.5) 3,744 (41.1) 511 (11.1) Myanmar 3,582 (24.3) 37 (17.2) 156 (18.4) 2,033 (22.3) 1,356 (29.6) Thailand 1,187 (8.0) 17 (7.9) 127 (15.0) 697 (7.6) 346 (7.5) Indonesia 917 (6.2) 25 (11.6) 71 (8.4) 214 (2.3) 607 (13.2) Laos 828 (5.6) 8 (3.7) 73 (8.6) 240 (2.6) 507 (11.1) Philippines 675 (4.6) 19 (8.8) 81 (9.6) 421 (4.6) 154 (3.4) Malaysia 672 (4.6) 8 (3.7) 80 (9.4) 378 (4.1) 206 (4.5) Vietnam 548 (3.7) 24 (11.2) 17 (2.0) 323 (3.5) 184 (4.0) Singapore 160 (1.1) 14 (6.5) 19 (2.2) 61 (0.7) 66 (1.4) Non-southeast Asian countries 1,901 (12.9) 45 (20.9) 202 (23.8) 1,005 (11.0) 649 (14.2) Maldives 313 (2.1) 1 (0.5) 11 (1.3) 124 (1.4) 177 (3.9) India 277 (1.9) 13 (6.0) 55 (6.5) 196 (2.2) 13 (0.3) Bangladesh 171 (1.2) 6 (2.8) 16 (1.9) 74 (0.8) 75 (1.6) Sri Lanka 171 (1.2) 1 (0.5) 6 (0.7) 124 (1.4) 40 (0.9) Angola 73 (0.5) 1 (0.5) 28 (3.3) 29 (0.3) 15 (0.3) Papua New Guinea 56 (0.4) 0 (0.0) 5 (0.6) 38 (0.4) 13 (0.3) Pakistan 42 (0.3) 0 (0.0) 0 (0.0) 24 (0.3) 18 (0.4) Tanzania 42 (0.3) 0 (0.0) 3 (0.4) 12 (0.1) 27 (0.6) Other countries 756 (5.1) 23 (10.7) 78 (9.2) 384 (4.2) 271 (5.9) Total 14,764 (100.0) 215 (100.0) 847 (100.0) 9,116 (100.0) 4,586 (100.0) Table 1. Distribution of countries of origin of imported dengue cases in China, 2005 to 2025.
-
Yunnan Province reported 4,173 imported cases, with an even higher concentration from Southeast Asia (3,979, 95.4%) (Table 2). Myanmar was the dominant source (72.4%), followed by Laos (10.3%) and Cambodia (6.9%). This concentration intensified over time: Myanmar’s contribution rose from 60.0% to 67.5% (2005–2019), before peaking at 80.9% in 2020–2025. Concurrently, the overall share of Southeast Asian sources increased from 86.0% to 99.0% in the most recent period (Table 2).
Source country Total, n (%) 2005–2009, n (%) 2010–2014, n (%) 2015–2019, n (%) 2020–2025, n (%) Southeast Asian countries 3,979 (95.4) 43 (86.0) 174 (88.8) 2,158 (93.5) 1,604 (99.0) Myanmar 3,020 (72.4) 30 (60.0) 123 (62.8) 1,557 (67.5) 1,310 (80.9) Laos 431 (10.3) 7 (14.0) 37 (18.9) 142 (6.2) 245 (15.1) Cambodia 286 (6.9) 1 (2.0) 0 (0.0) 272 (11.8) 13 (0.8) Thailand 113 (2.7) 0 (0.0) 13 (6.6) 78 (3.4) 22 (1.4) Vietnam 52 (1.2) 5 (10.0) 0 (0.0) 43 (1.9) 4 (0.2) Malaysia 36 (0.9) 0 (0.0) 1 (0.5) 35 (1.5) 0 (0.0) Philippines 26 (0.6) 0 (0.0) 0 (0.0) 25 (1.1) 1 (0.1) Indonesia 13 (0.3) 0 (0.0) 0 (0.0) 4 (0.2) 9 (0.6) Singapore 2 (0.0) 0 (0.0) 0 (0.0) 2 (0.1) 0 (0.0) Non-southeast Asian countries 194 (4.6) 7 (14.0) 22 (11.2) 149 (6.5) 16 (1.0) India 29 (0.7) 0 (0.0) 3 (1.5) 26 (1.1) 0 (0.0) Sri Lanka 21 (0.5) 0 (0.0) 0 (0.0) 20 (0.9) 1 (0.1) Bangladesh 12 (0.3) 0 (0.0) 0 (0.0) 9 (0.4) 3 (0.2) Maldives 10 (0.2) 0 (0.0) 0 (0.0) 8 (0.3) 2 (0.1) Other countries 122 (2.9) 7 (14.0) 19 (9.7) 86 (3.7) 10 (0.6) Total 4,173 (100.0) 50 (100.0) 196 (100.0) 2,307 (100.0) 1,620 (100.0) Table 2. Distribution of countries of origin of imported dengue cases in Yunnan Province, 2005 to 2025.
-
Guangdong Province documented 2,960 imported cases, of which 2,512 cases (84.9%) originated from Southeast Asia. Cambodia (37.4%), Thailand (13.3%), and Malaysia (8.9%) were the main sources (Table 3). The primary source countries varied significantly by period: Thailand and Indonesia led in 2005–2009; Thailand led in 2010–2014; Cambodia dominated in 2015–2019; while in 2020–2025, sources diversified, with Thailand and Indonesia becoming primary sources and Cambodia’s share falling (Table 3).
Source country Total, n (%) 2005–2009, n (%) 2010–2014, n (%) 2015–2019, n (%) 2020–2025, n (%) Southeast Asian countries 2,512 (84.9) 41 (75.9) 179 (81.7) 1,720 (88.4) 572 (77.1) Cambodia 1,107 (37.4) 4 (7.4) 9 (4.1) 974 (50.1) 120 (16.2) Thailand 395 (13.3) 12 (22.2) 59 (26.9) 215 (11.1) 109 (14.7) Malaysia 263 (8.9) 1 (1.9) 38 (17.4) 137 (7.0) 87 (11.7) Indonesia 197 (6.7) 11 (20.4) 21 (9.6) 63 (3.2) 102 (13.7) Vietnam 182 (6.1) 6 (11.1) 10 (4.6) 103 (5.3) 63 (8.5) Myanmar 142 (4.8) 1 (1.9) 11 (5.0) 113 (5.8) 17 (2.3) Philippines 128 (4.3) 3 (5.6) 15 (6.8) 84 (4.3) 26 (3.5) Laos 59 (2.0) 0 (0.0) 9 (4.1) 17 (0.9) 33 (4.4) Singapore 39 (1.3) 3 (5.6) 7 (3.2) 14 (0.7) 15 (2.0) Non-southeast Asian countries 448 (15.1) 13 (24.1) 40 (18.3) 225 (11.6) 170 (22.9) India 98 (3.3) 7 (13.0) 14 (6.4) 69 (3.5) 8 (1.1) Maldives 59 (2.0) 0 (0.0) 4 (1.8) 21 (1.1) 34 (4.6) Sri Lanka 58 (2.0) 0 (0.0) 4 (1.8) 36 (1.9) 18 (2.4) Bangladesh 52 (1.8) 3 (5.6) 8 (3.7) 16 (0.8) 25 (3.4) Pakistan 12 (0.4) 0 (0.0) 0 (0.0) 7 (0.4) 5 (0.7) Tanzania 12 (0.4) 0 (0.0) 0 (0.0) 3 (0.2) 9 (1.2) The United Arab Emirates 11 (0.4) 0 (0.0) 0 (0.0) 0 (0.0) 11 (1.5) Other countries 146 (4.9) 3 (5.6) 10 (4.6) 73 (3.8) 60 (8.1) Total 2,960 (100.0) 54 (100.0) 219 (100.0) 1,945 (100.0) 742 (100.0) Table 3. Distribution of countries of origin of imported dengue cases in Guangdong Province, 2005 to 2025.
-
The indigenous-to-imported risk ratio, defined as the number of indigenous cases per imported case, was analyzed for ten Chinese provinces from 2005 to 2025. This ratio reflects the relative risk of local outbreaks following importation. Over the 21-year study period, the risk ratios exhibited significant annual and periodic fluctuations. Extreme peaks indicate years of intense local transmission, such as Yunnan Province in 2022 (ratio: 86.3), Guangdong Province in 2024 (81.1), and Chongqing Municipality in 2025 (36.5) (Figure 2). In contrast, a risk ratio below 1.0, common across many PLADs and years, signified the predominance of imported cases with minimal local spread (Figure 2).
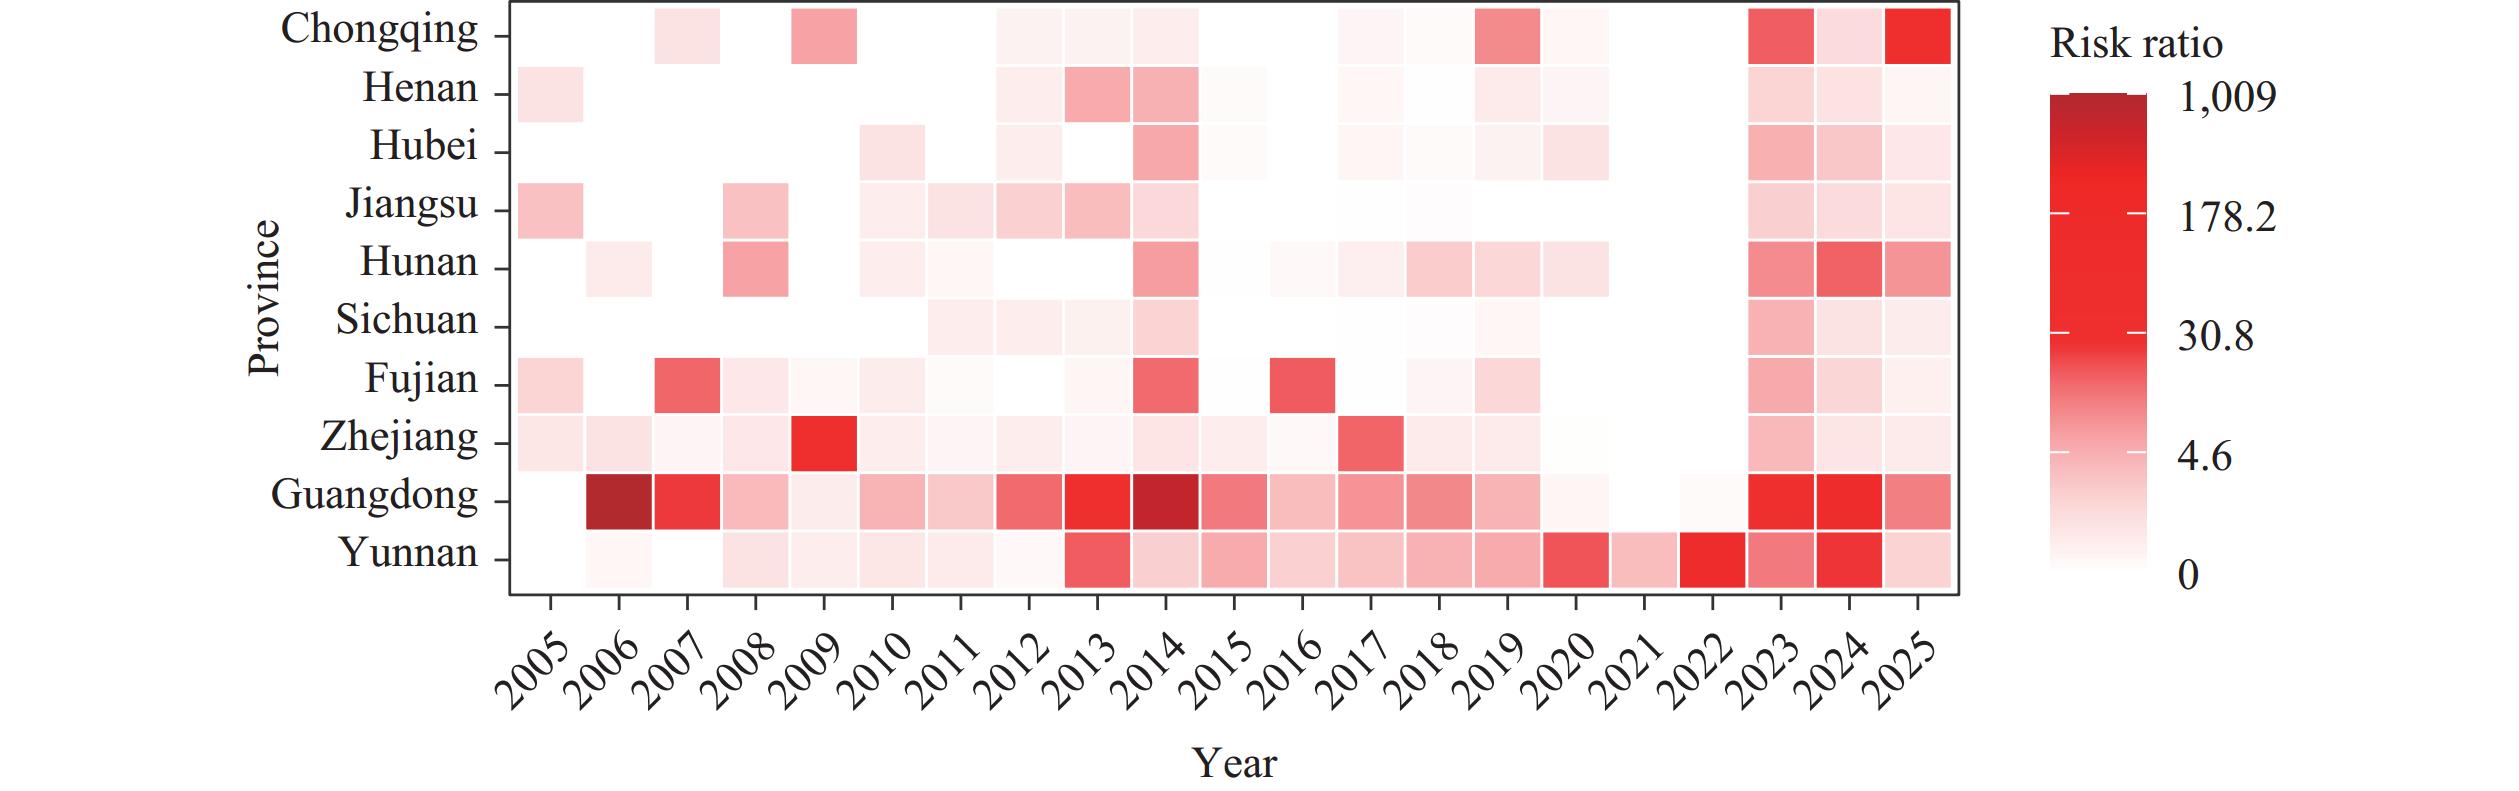 Figure 2.
Transmission risk associated with imported dengue fever cases in the top 10 PLADs of China.
Abbreviation: PLAD=provincial-level administrative division. -
Yunnan and Guangdong Provinces were identified as persistently high-risk areas. Yunnan maintained elevated risk ratios (2.0–5.0) from 2014 to 2019, with a peak of 86.3 in 2022. Guangdong exhibited a bimodal pattern, with a peak in 2015 (11.3) and a larger one in 2023 (37.9) and 2024 (81.1) (Figure 2). The sustained high ratios in these PLADs indicate a high potential for imported cases to trigger substantial local epidemics.
-
Several PLADs experienced intermittent high-risk outbreaks. Zhejiang Province exhibited notable peaks in 2009 (39.8) and 2017 (15.2). Fujian Province recorded peaks in 2007 (14.9), 2011 (11.0), and 2016 (16.8). Hunan and Chongqing showed a sharp increase in risk in recent years, with Hunan’s ratio rising to 15.5 in 2024 and 36.5 in 2025 (Figure 2). This pattern suggests sporadic, intense local transmission events following import.
-
Sichuan, Jiangsu, Hubei, and Henan provinces generally had low or very low risk ratios. In most years, ratios were at or near 0. Minor, sporadic increases occurred, such as in Hubei in 2014 (5.3) and 2023 (4.6) (Figure 2); however, these were limited in scale and duration. The epidemiology in these PLADs is characterized by imported cases with a low propensity to spark major local outbreaks.
-
From 2005 to 2025, males accounted for 53.7% of dengue fever cases in China. There was a significant gender disparity in the gender distribution between indigenous and imported cases (χ2=2000.51, P<0.01) (Table 4). In terms of age distribution, indigenous dengue fever cases were older [40 (27, 55) years] than imported cases [36 (28, 45) years] (z=27.783, P<0.01). The 25–49 age group constituted the majority of cases, with a higher proportion of imported cases than indigenous cases. Conversely, individuals aged 70 years and above were more prevalent among indigenous cases (Table 4). Among indigenous cases, the highest proportion were unemployed individuals and retirees, whereas the most common occupations among imported cases were farmers and workers.
Region Group Total, n (%) Indigenous cases, n (%) Imported cases, n (%) χ2 value P Nationwide Gender Male 80,029 (53.7) 69,521 (51.8) 10,508 (71.2) 2,000.51 <0.01 Female 68,864 (46.3) 64,608 (48.2) 4,256 (28.8) Age group
(years)0–9 5,744 (3.9) 5,530 (4.1) 214 (1.5) 3,478.55 <0.01 10–24 21,897 (14.7) 20,149 (15.0) 1,748 (11.8) 25–49 72,713 (48.8) 62,307 (46.5) 10,406 (70.5) 50–69 37,570 (25.2) 35,302 (26.3) 2,268 (15.4) 70+ 10,969 (7.4) 10,841 (8.1) 128 (0.9) Occupation Household/unemployed/
retired persons45,687 (30.7) 43,061 (32.1) 2,626 (17.8) 3,114.62 <0.01 Farmers and workers 38,218 (25.7) 32,527 (24.2) 5,693 (38.6) Commercial/service personnel 24,555 (16.5) 21,178 (15.8) 3,377 (22.9) Teachers and students 16,369 (11.0) 15,490 (11.5) 879 (6.0) Other occupations and unknown 14,285 (9.6) 13,310 (9.9) 975 (6.6) Staff members 6,114 (4.1) 5,172 (3.9) 942 (6.4) Individuals and freelancers 3,663 (2.5) 3,391 (2.5) 272 (1.8) Guangdong Gender Male 46,808 (52.3) 44,707 (51.6) 2,101 (71.0) 428.30 <0.01 Female 42,718 (47.7) 41,859 (48.4) 859 (29.0) Age group
(years)0–9 3,626 (4.1) 3,609 (4.2) 17 (0.6) 975.71 <0.01 10–24 13,893 (15.5) 13,537 (15.6) 356 (12.0) 25–49 42,836 (47.3) 40,192 (46.4) 2,194 (74.1) 50–69 22,214 (24.8) 21,841 (25.2) 373 (12.6) 70+ 7,407 (8.3) 7,387 (8.5) 20 (0.7) Occupation Household/unemployed/
retired persons31,992 (35.7) 31,284 (36.1) 708 (23.9) 887.50 <0.01 Farmers and workers 18,153 (20.3) 17,398 (20.1) 755 (25.5) Commercial/service personnel 14,027 (15.7) 13,134 (15.2) 893 (30.2) Other occupations and unknown 10,810 (12.1) 10,605 (12.3) 205 (6.9) Teachers and students 10,160 (11.3) 10,025 (11.6) 135 (4.6) Staff members 3,260 (3.6) 3,038 (3.5) 222 (7.5) Individuals and freelancers 1,124 (1.3) 1,082 (1.2) 42 (1.4) Yunnan Gender Male 18,026 (54.7) 15,327 (53.3) 2,699 (64.7) 191.33 <0.01 Female 14,918 (45.3) 13,444 (46.7) 1,474 (35.3) Age group
(years)0–9 1,438 (4.4) 1,297 (4.5) 141 (3.4) 449.01 <0.01 10–24 4,822 (14.6) 4,238 (14.7) 584 (14.0) 25–49 16,591 (50.4) 13,920 (48.4) 2,671 (64.0) 50–69 8,207 (24.9) 7,498 (26.1) 709 (17.0) 70+ 1,886 (5.7) 1818 (6.3) 68 (1.6) Occupation Farmers and workers 11,149 (33.8) 9,040 (31.4) 2,109 (50.5) 946.76 <0.01 Household/unemployed/
retired persons6,647 (20.2) 6,298 (21.9) 349 (8.4) Commercial/service personnel 6,518 (19.8) 5523 (19.2) 995 (23.8) Teachers and students 3,510 (10.7) 3,172 (11.0) 338 (8.1) Individuals and freelancers 2,073 (6.3) 1,972 (6.9) 101 (2.4) Other occupations and unknown 1,852 (5.6) 1,705 (5.9) 147 (3.5) Staff members 1,195 (3.6) 1,061 (3.7) 134 (3.2) Table 4. Population characteristics of imported and indigenous dengue cases.
The distribution of indigenous and imported cases among different genders, age groups, and occupational populations in Guangdong exhibited significant differences (Table 4). 71.6% of indigenous cases were distributed in the 25–69 age group, with the highest proportion (35.7%) being unemployed household workers and retirees. The imported cases were predominantly male (25–49 years), mainly commercial and public place service personnel (30.2%), farmers and workers (25.5%), and unemployed household workers and retirees (23.9%). The differences in indigenous and imported cases among genders, age groups, and occupations in Yunnan were also statistically significant (Table 4). Occupational distribution was primarily farmers and workers (33.8%), unemployed household workers and retirees (20.2%), and commercial and public place service personnel (19.8%). The proportion of farmers and workers in imported cases (50.5%) was higher than among indigenous cases (31.4%).
General Characteristics
Overall epidemic trend with major peaks.
Overall composition and dominance of indigenous transmission.
Seasonality Difference in Imported and Indigenous Cases
Pronounced seasonal epidemic peaks.
Role of imported cases in initiating outbreaks.
Monthly shift in case-type dominance.
Regional Distribution of Imported and Indigenous Cases
Dynamics of Source Countries at National and Subnational Levels
National-level composition and trends.
Yunnan Province: high concentration from Myanmar.
Guangdong Province: dynamic shifts in major sources.
Transmission Risk Ratio
Overall trends.
PLADs with persistent high risk.
PLADs with intermittent high-risk outbreaks.
PLADs with consistently low risk.
Population Characteristics
-
This study analyzed the epidemiological characteristics of imported and indigenous dengue fever cases and dynamic provincial transmission risks in China from 2005 to 2025. The key findings and innovations are discussed below:
First, a key innovation of this study is the dynamic stratification and pattern identification of local transmission risk across ten key PLADs using the risk ratio metric. The results not only reaffirm the status of Yunnan and Guangdong as persistently high-risk PLADs (8–9) but also identify PLADs with intermittent high-risk outbreaks and those with consistently low risk. This approach moves beyond previous studies that primarily described absolute case numbers or spatial distribution (10–11), offering a quantitative framework to assess the efficiency or vulnerability of different PLADs in converting imported cases into local epidemics. Notably, the sharp increase in risk ratios in PLADs such as Hunan and Chongqing during 2023–2025 signals that these areas are emerging as high-risk frontiers, with critical implications for early warning and resource allocation.
Second, our study delineates the strong association between the seasonality of local transmission and the importation of cases. We found that indigenous cases were overwhelmingly concentrated from August to October, while imported cases began to increase significantly before the local epidemic season (e.g., May and June), confirming that imported cases serve as a crucial trigger for local outbreaks. This aligns with previous research that identified international travel as the primary pathway for viral introduction (5–6). However, by moving beyond the focus on import risk and air travel models from Southeast Asia (5), our study quantitatively assessed the spatiotemporal heterogeneity in the relative risk of local outbreaks following importation across different PLADs using a 21-year risk ratio. This represents a significant advancement in the understanding of varying provincial vulnerabilities to seeded outbreaks (7).
Third, our study systematically characterizes dynamic shifts in primary source countries and reveals distinct provincial importation profiles. Nationally, the dominant source country shifted from Cambodia (2015–2019) to Myanmar (2020–2025), reflecting changing epidemic landscapes in neighboring countries and the situation of personnel exchanges with China. More importantly, we identified fundamental differences between Yunnan and Guangdong provinces. Imported cases in Yunnan were highly concentrated from Myanmar and predominantly involved “farmers and workers,” highlighting a cross-border pattern of labor migration. In contrast, Guangdong received imported cases from more diverse sources, with “commercial/service personnel” being the largest occupational group. These findings extend the observations by Yue et al. (2021) on source countries for these two provinces (2004–2018) and provide more recent evidence of the shift toward Myanmar. They also reveal stark contrasts in the occupational structure of imported cases, offering precise demographic insights for targeted border surveillance (8).
Compared with previous national studies, our analysis covers the entire period before, during, and after the COVID-19 pandemic (14). The sharp decline in indigenous cases in 2020–2021 due to non-pharmaceutical interventions (NPIs), followed by a rapid rebound of both imported and indigenous cases post-2022, reaching a historical sub-peak in 2024, corroborates the complex impact of NPIs on dengue transmission, as reviewed by Wu et al. (2022), and provides the latest empirical evidence from China (15).
This study has several limitations. First, under-reporting of surveillance data, particularly for mild and asymptomatic infections, is a possibility (16). In addition, disparities in monitoring capabilities across PLADs may have led to data bias. Second, the study primarily analyzed dengue fever-reported cases in Chinese mainland, excluding cases from Hong Kong Special Administrative Region (SAR), Macao SAR, and Taiwan, China; therefore, the analysis of importation risk may be incomplete. Moreover, this study did not control for confounding factors such as temperature, precipitation, and mosquito vector density when analyzing case counts. The hazard ratio was calculated from the reported case numbers, without accounting for potential confounding factors. Future research could integrate multisource data to build more refined risk-prediction models.
In summary, this study underscores the limitations of a “one-size-fits-all” control strategy. Future prevention and control efforts should transition toward precision strategies based on provincial risk profiles. These strategies include enhanced monitoring and health education for travelers from specific source countries (e.g., Myanmar) and occupational groups (e.g., laborers) in border PLADs such as Yunnan; strengthened screening of travelers from multiple endemic areas in commercial hubs such as Guangdong; and preemptive reinforcement of vector surveillance and response capacity in emerging high-risk PLADs such as Hunan and Chongqing. Continuous monitoring of dynamic changes in importation sources remains vital.
| Citation: |

|