
 Download:


-
Introduction: The subtype classification of human immunodeficiency virus type 1 (HIV-1) is vital for its prevention and control. Current methods often rely on time-consuming sequence alignments, whereas new alignment-free approaches typically focus on single genes. The prevalent HIV strains in China are mainly non-B subtypes. However, no subtype prediction model exists for local sequences. Therefore, we aimed to develop a fast and accurate method for building multigene models specifically tailored to predict HIV-1 subtypes on the basis of Chinese data.
Methods: Herein, we propose a novel sequence-feature extraction method, named Subsequence Correlation Coefficient Feature Vector (SCCFV), which captures the spatial distribution and correlations of nucleotides and converts DNA sequences into high-dimensional numerical features. It then combines these features with a regularized discriminant analysis (RDA) classifier to build a dedicated classification model.
Results: The proposed SCCFV-RDA model exhibited robust and generalizable capabilities, maintaining more than 99.85% accuracy across an international dataset covering 10 gene regions. It also achieved 99.7% classification accuracy on an independent test set of Chinese HIV-1 pol gene data, showing significantly higher recall for mainstream circulating recombinant form subtypes than that achieved by traditional tools.
Conclusion: We developed a classification tool for HIV-1 subtypes and built a specialized model for HIV-1 strains prevalent in China. The accuracy and efficiency of the tool surpassed those of existing traditional methods, providing reliable computational support for the precise molecular epidemiological surveillance of HIV in China. This method holds significant practical value for facilitating the formulation of targeted prevention and control strategies.
-
According to recent statistics, approximately 40.8 million people worldwide were living with the human immunodeficiency virus (HIV) in 2025 (1). Increasingly complex and diverse HIV subtypes have emerged from the large-scale and evolving pandemic (2), posing numerous prevention and treatment challenges. As China is one of the key HIV-affected countries, the classification of its indigenous viral subtypes warrants attention. Through surveillance efforts from 2004 to 2022, the Chinese Center for Disease Control and Prevention (CDC) has established one of the largest national molecular epidemiology databases for acquired immunodeficiency syndrome (AIDS), currently providing data from 57,902 HIV-infected individuals (3). Domestically prevalent non-B subtypes, such as CRF01_AE and CRF07_BC, exhibit significant genetic differences from the B subtype dominant in Europe and America (4). However, because the current mainstream classification tools are primarily trained on datasets dominated by European and American B subtypes and known circulating recombinant forms (CRFs), their performance in classifying the strains circulating in China may be limited, in particular for new CRFs that are not represented in their training data. Consequently, novel computational models that are specifically tailored to the genetic sequences prevalent in China and capable of efficiently processing large-scale data are urgently needed.
Machine learning and deep learning methods have been extensively applied to bioinformatics classification, demonstrating significant potential in this task (5). Existing models are predominantly trained on European and American B subtype data and typically target specific pol gene or full-genome regions, lacking a unified framework adaptable to diverse fragments. Herein, we propose a novel modular framework for HIV-1 subtype classification. Based on the Subsequence Correlation Coefficient Feature Vector (SCCFV) method, this framework establishes a model system adaptable to multiple gene fragments. To assess the applicability of the model beyond the pol gene region, we additionally collected 821 full-genome sequences from Chinese public databases for independent model validation. The model demonstrated outstanding performance in classifying complex CRFs in China, providing a unified and efficient solution for global HIV-1 genotyping and evolutionary surveillance based on arbitrary fragments.
-
The HIV-1 genome, which spans approximately 9,800 bp, comprises the highly conserved structural genes gag, pol, and env along with multiple regulatory and accessory genes. In this study, the sequence data for each gene segment were downloaded from the HIV Sequence Database, totaling 10 datasets. Categories with sample sizes exceeding 9 were selected to establish the models.
Of the 57,902 HIV pol gene sequences in the Chinese CDC AIDS database, 5% are labeled as “unique recombinant forms (URFs),” “Other,” and “Other CRFs.” Given their limited epidemiological significance, only sequences of the major HIV subtypes circulating in China were selected (
Supplementary Figure S1 ). -
To analyze the base position distribution of the nucleotides in DNA sequences, we used a feature mapping method to transform the sequences into vector representations within a multidimensional feature space. For a given HIV DNA sequence, $ \text{G=(}{g}_{\text{1}}\text{,}{\text{g}}_{\text{2}}\text{,…,}{g}_{\text{n}}\text{)} $, where each nucleotide variable is $ {g}_{i}=\{\mathrm{G},\mathrm{T},\mathrm{A},\mathrm{C}\} $ and the sequence length is n. For a specific base, where $ g\in \{\mathrm{A},~\mathrm{T},~\mathrm{C},~\mathrm{G}\} $, each base position is converted into a numerical feature:
$$ {v}_{g}\left(i\right)=\begin{cases} 1,{g}_{i}=g\\ 0,{g}_{i}\neq g\\ \end{cases} i=1{,}2,\ldots n. $$ (1) Digital representation of the sequences is achieved by constructing four base-specific time series: $ {V}_{g}=[{\text{V}}_{\text{g}}(1),{\text{V}}_{\text{g}}(2),...,{\text{V}}_{\text{g}}(n)] $. For example, the sequence “AGCTAAG” can be converted as follows:
$$ \begin{aligned} & {\text{V}}_{\text{A}}=[1,0,0,0,1,1,0] \\ & ({\mathrm{A\; appears\; in\; the\; 1st, \;5th, \;and\; 6th \;positions}}.) \end{aligned}$$ (2) VG, VC, and VT are similarly derived.
Two key statistical measures are calculated from the obtained numerical data: the average frequency and correlation coefficient. Let $ {N}_{g} $ denote the total count of nucleotide g in the sequence, where $ g\in \{\mathrm{A},\mathrm{T},\mathrm{C},\mathrm{G}\} $. The average frequency $ {f}_{g} $ represents the global proportion of base g, reflecting its compositional characteristics, and is defined as follows (Figure 1):
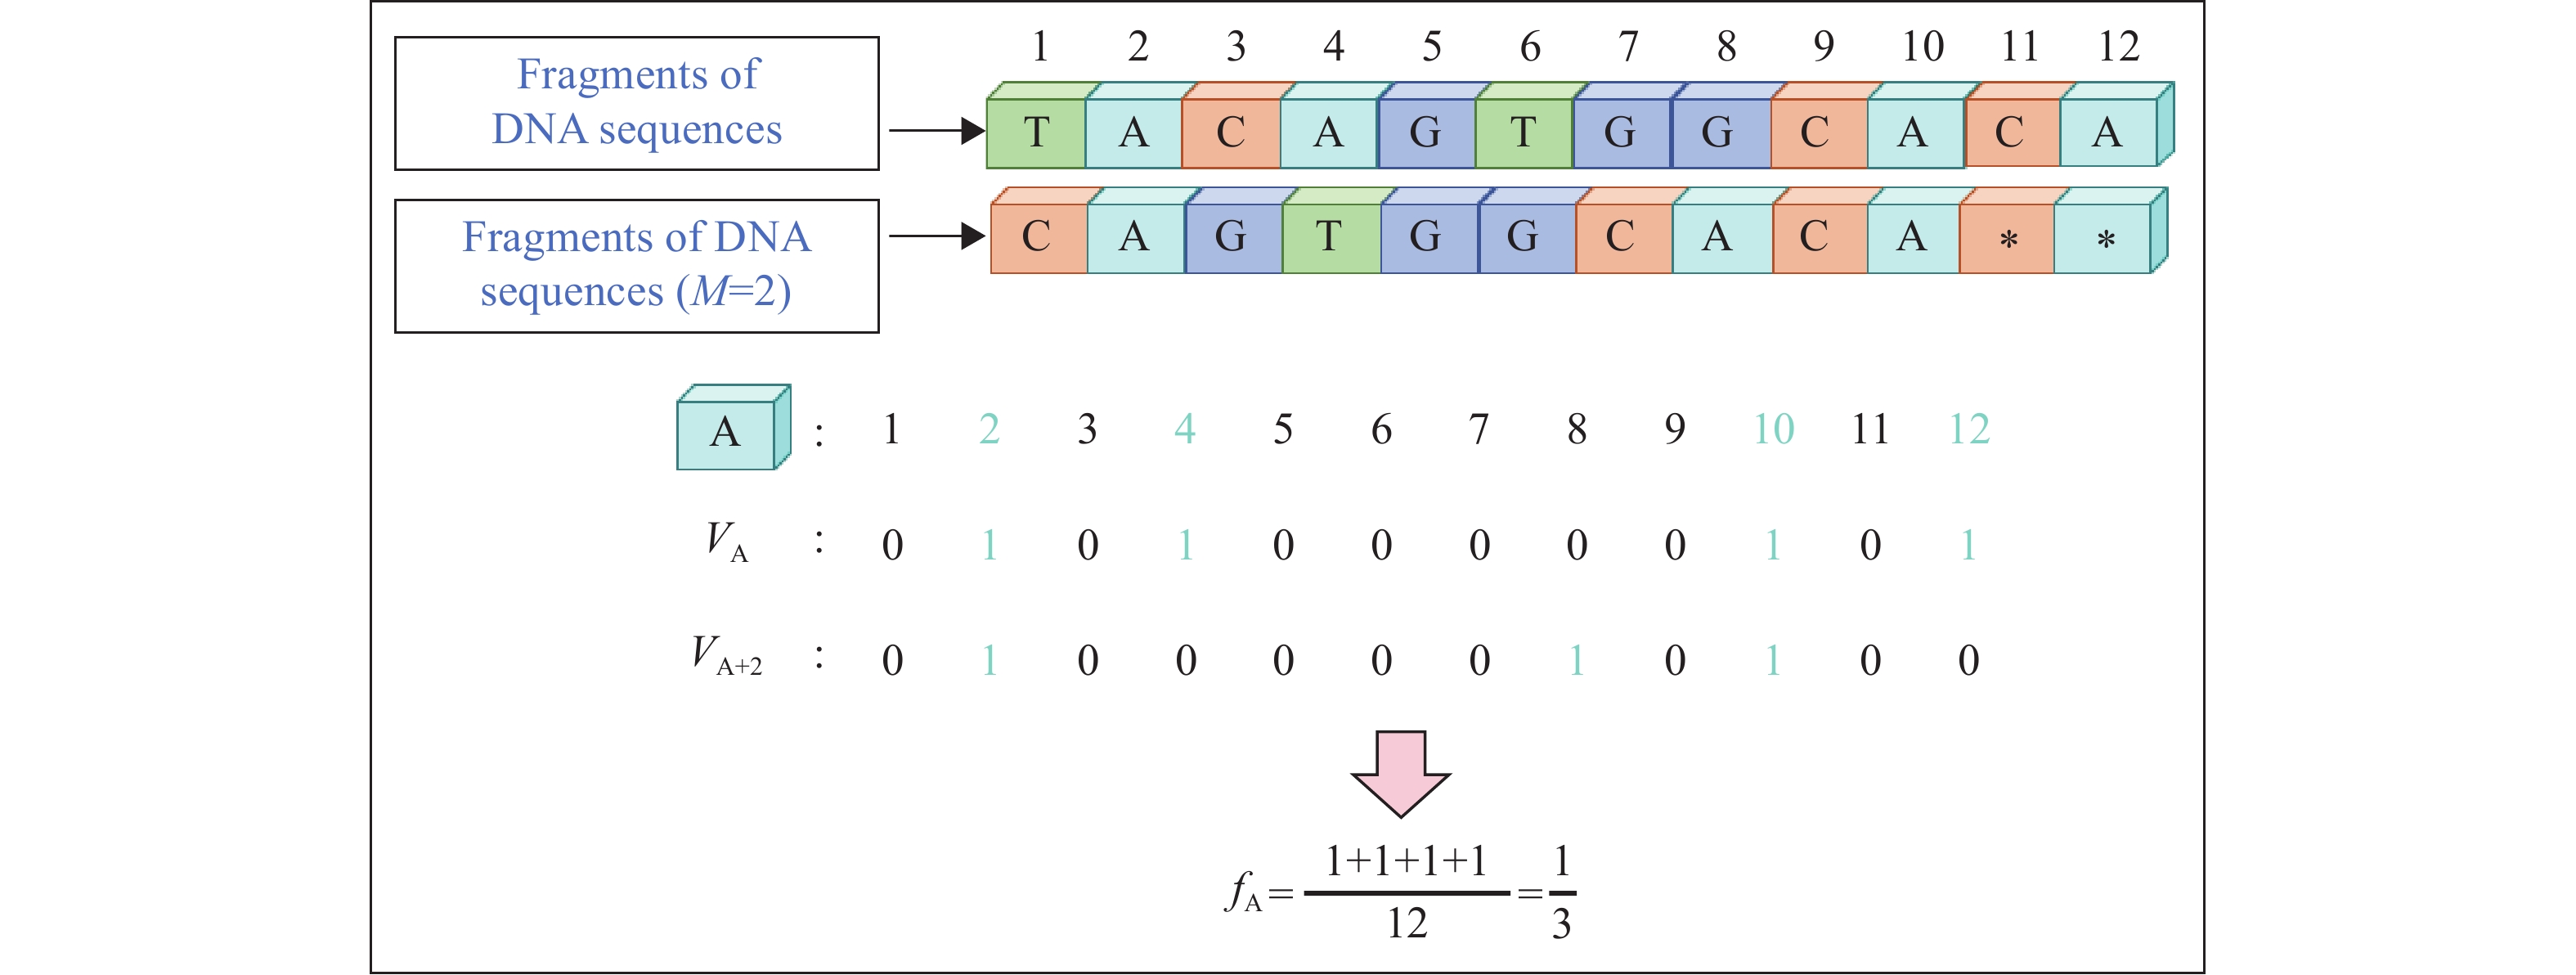 Figure 1.
Computational methodology for determining VA, VA+2, and fA.
Abbreviation: DNA=deoxyribonucleic acid.$$ {f}_{g}=\frac{{N}_{g}}{n} $$ (3) For a more in-depth analysis of the spatial distribution patterns of the bases, autocorrelation and cross-correlation functions were introduced. The autocorrelation function measures the strength of the association between the same bases after an interval of M positions:
$$ {\mathrm{\varnothing }}_{\text{AA}}\left(M\right)=\frac{1}{n}\sum \limits_{i=~1}^{n}({v}_{\mathrm{A}}\left(i\right)-{f}_{\mathrm{A}})({v}_{\mathrm{A}+M}\left(i\right)-{f}_{\mathrm{A}}) $$ (4) The autocorrelation coefficient $ {R}_{\text{AA}}\left(M\right) $ of base A is defined as follows:
$$ R_{\text{AA}}\left(\mathit{\mathit{\mathrm{\mathit{M}}}}\right)=\frac{\mathrm{\varnothing}_{\text{AA}}\left(M\right)}{\mathrm{\varnothing}_{\text{AA}}\left(0\right)} $$ (5) The M-step-delayed normalized cross-correlation coefficient between nucleotides A and T serves as a crucial metric for quantifying the strength of the correlation between two nucleotides at specific intervals within a sequence. The cross-correlation function is defined as follows:
$$ {\mathrm{\varnothing }}_{\text{AT}}\left(M\right)=\frac{1}{n}\sum \limits_{i=~1}^{n}({v}_{\mathrm{A}}\left(i\right)-{f}_{\mathrm{A}})({v}_{\mathrm{T}+M}\left(i\right)-{f}_{\mathrm{T}}) $$ (6) The correlation coefficient $ {R}_{\text{AT}}\left(M\right) $ is defined as follows:
$$ {R}_{\text{AT}}\left(M\right)=\frac{{\mathrm{\varnothing }}_{\text{AT}}(M)}{\sqrt{{{{\mathrm{\varnothing }}_{\text{AA}}}\left(0\right)\cdot \mathrm{\varnothing }}_{\text{TT}}\left(0\right)}} $$ (7) This coefficient reveals the periodicity of the base occurrence patterns; a high $ {R}_{\text{AA}}\left(M\right) $ value indicates a tendency for the A bases to repeat at every M position. Cross-correlation quantifies the spatial dependencies between different bases, with $ {R}_{\text{AT}}\left(M\right) $ reflecting the cooperative or antagonistic effects between A and T at M position intervals.
To comprehensively capture local feature variations across different regions of the DNA sequence, a segmented processing strategy is used. Specifically, each raw DNA sequence $ {G=(}{g}_{{1}}{,}\;{{g}}_{{2}}{,\; \cdots \;,}{g}_{{n}}{)} $ is first uniformly divided into J contiguous subsequences. The first r subsequences (Substr1, Substr2, · · ·, Substrr) each contains Y+1 nucleotides, whereas the remaining J-r subsequences (Substrr+1, Substrr+2, · · ·, SubstrJ) each contain Y nucleotides. The formula is as follows:
$$ Y=\left[\frac{n}{\text{J}}\right],r=n-J\times Y\left(0\le r\le J\right) $$ (8) The standardized cross-correlation coefficient R for all possible nucleotide combinations (AA, AC, AG, AT, ..., TT; 16 combinations in total) is independently calculated for each subsequent segment at different M delay steps, resulting in a 16 × M-dimensional vector (6). The resulting eigenvalues are concatenated in segment order to form a high-dimensional feature vector with a total dimension of J × 16 × M.
-
Four classifiers from machine learning methods (7) — Random Forest, XGBoost, Regularized Discriminant Analysis (RDA), and LightGBM — were selected for comparative analysis. To comprehensively validate the model performance, the following systematic evaluation framework was used:
$$ \mathrm{Accuracy}=\frac{\left| \text{TP}\right| +|\mathrm{TN}|}{\left| \text{TP}\right| +\left| \text{TN}\right| +\left| \text{FP}\right| +|\mathrm{FN}|} $$ (9) $$ \mathrm{Precision}=\frac{|\mathrm{TP}|}{\left| \text{TP}\right| +|\mathrm{FP}|} $$ (10) $$ \mathrm{Recall}=\frac{|\mathrm{TP}|}{\left| \text{TP}\right| +|\mathrm{FN}|} $$ (11) $$ \mathrm{F}1-\mathrm{score}=2\times \frac{\mathrm{Precision}\times \text{Recall}}{\mathrm{Precision}+\text{Recall}} $$ (12) As an example, we randomly divided 55,261 pol gene data points from the Chinese CDC database into 75% and 25% for use as training and independent test sets, respectively. Five-fold cross-validation was performed within the training set. This process simultaneously optimizes the hyperparameters of the classifier and the core parameters of the SCCFV feature extraction method. The classification performance of the final model was objectively evaluated using the independent test set, which was not involved in either the training or parameter selection processes.
According to the accuracy heatmaps of the four classifiers (
Supplementary Figure S2 ), RDA achieved the highest accuracy (99.7%) under the parameters J = 3 and M = 5 and was therefore selected as the final model with this parameter combination.Figure 2 illustrates the overall framework of the SCCFV method. First, the input sequence is converted into a four-dimensional vector representation via a numerical mapping layer to capture base position information. Subsequently, the sequence is uniformly partitioned into J subsegments, and both local and global features are extracted via a statistical feature computation layer to construct a multidimensional feature vector. After input to the RDA classifier optimized via 5-fold cross-validation, the optimal model is obtained by parameter tuning, ultimately achieving precise HIV-1 subtype classification.
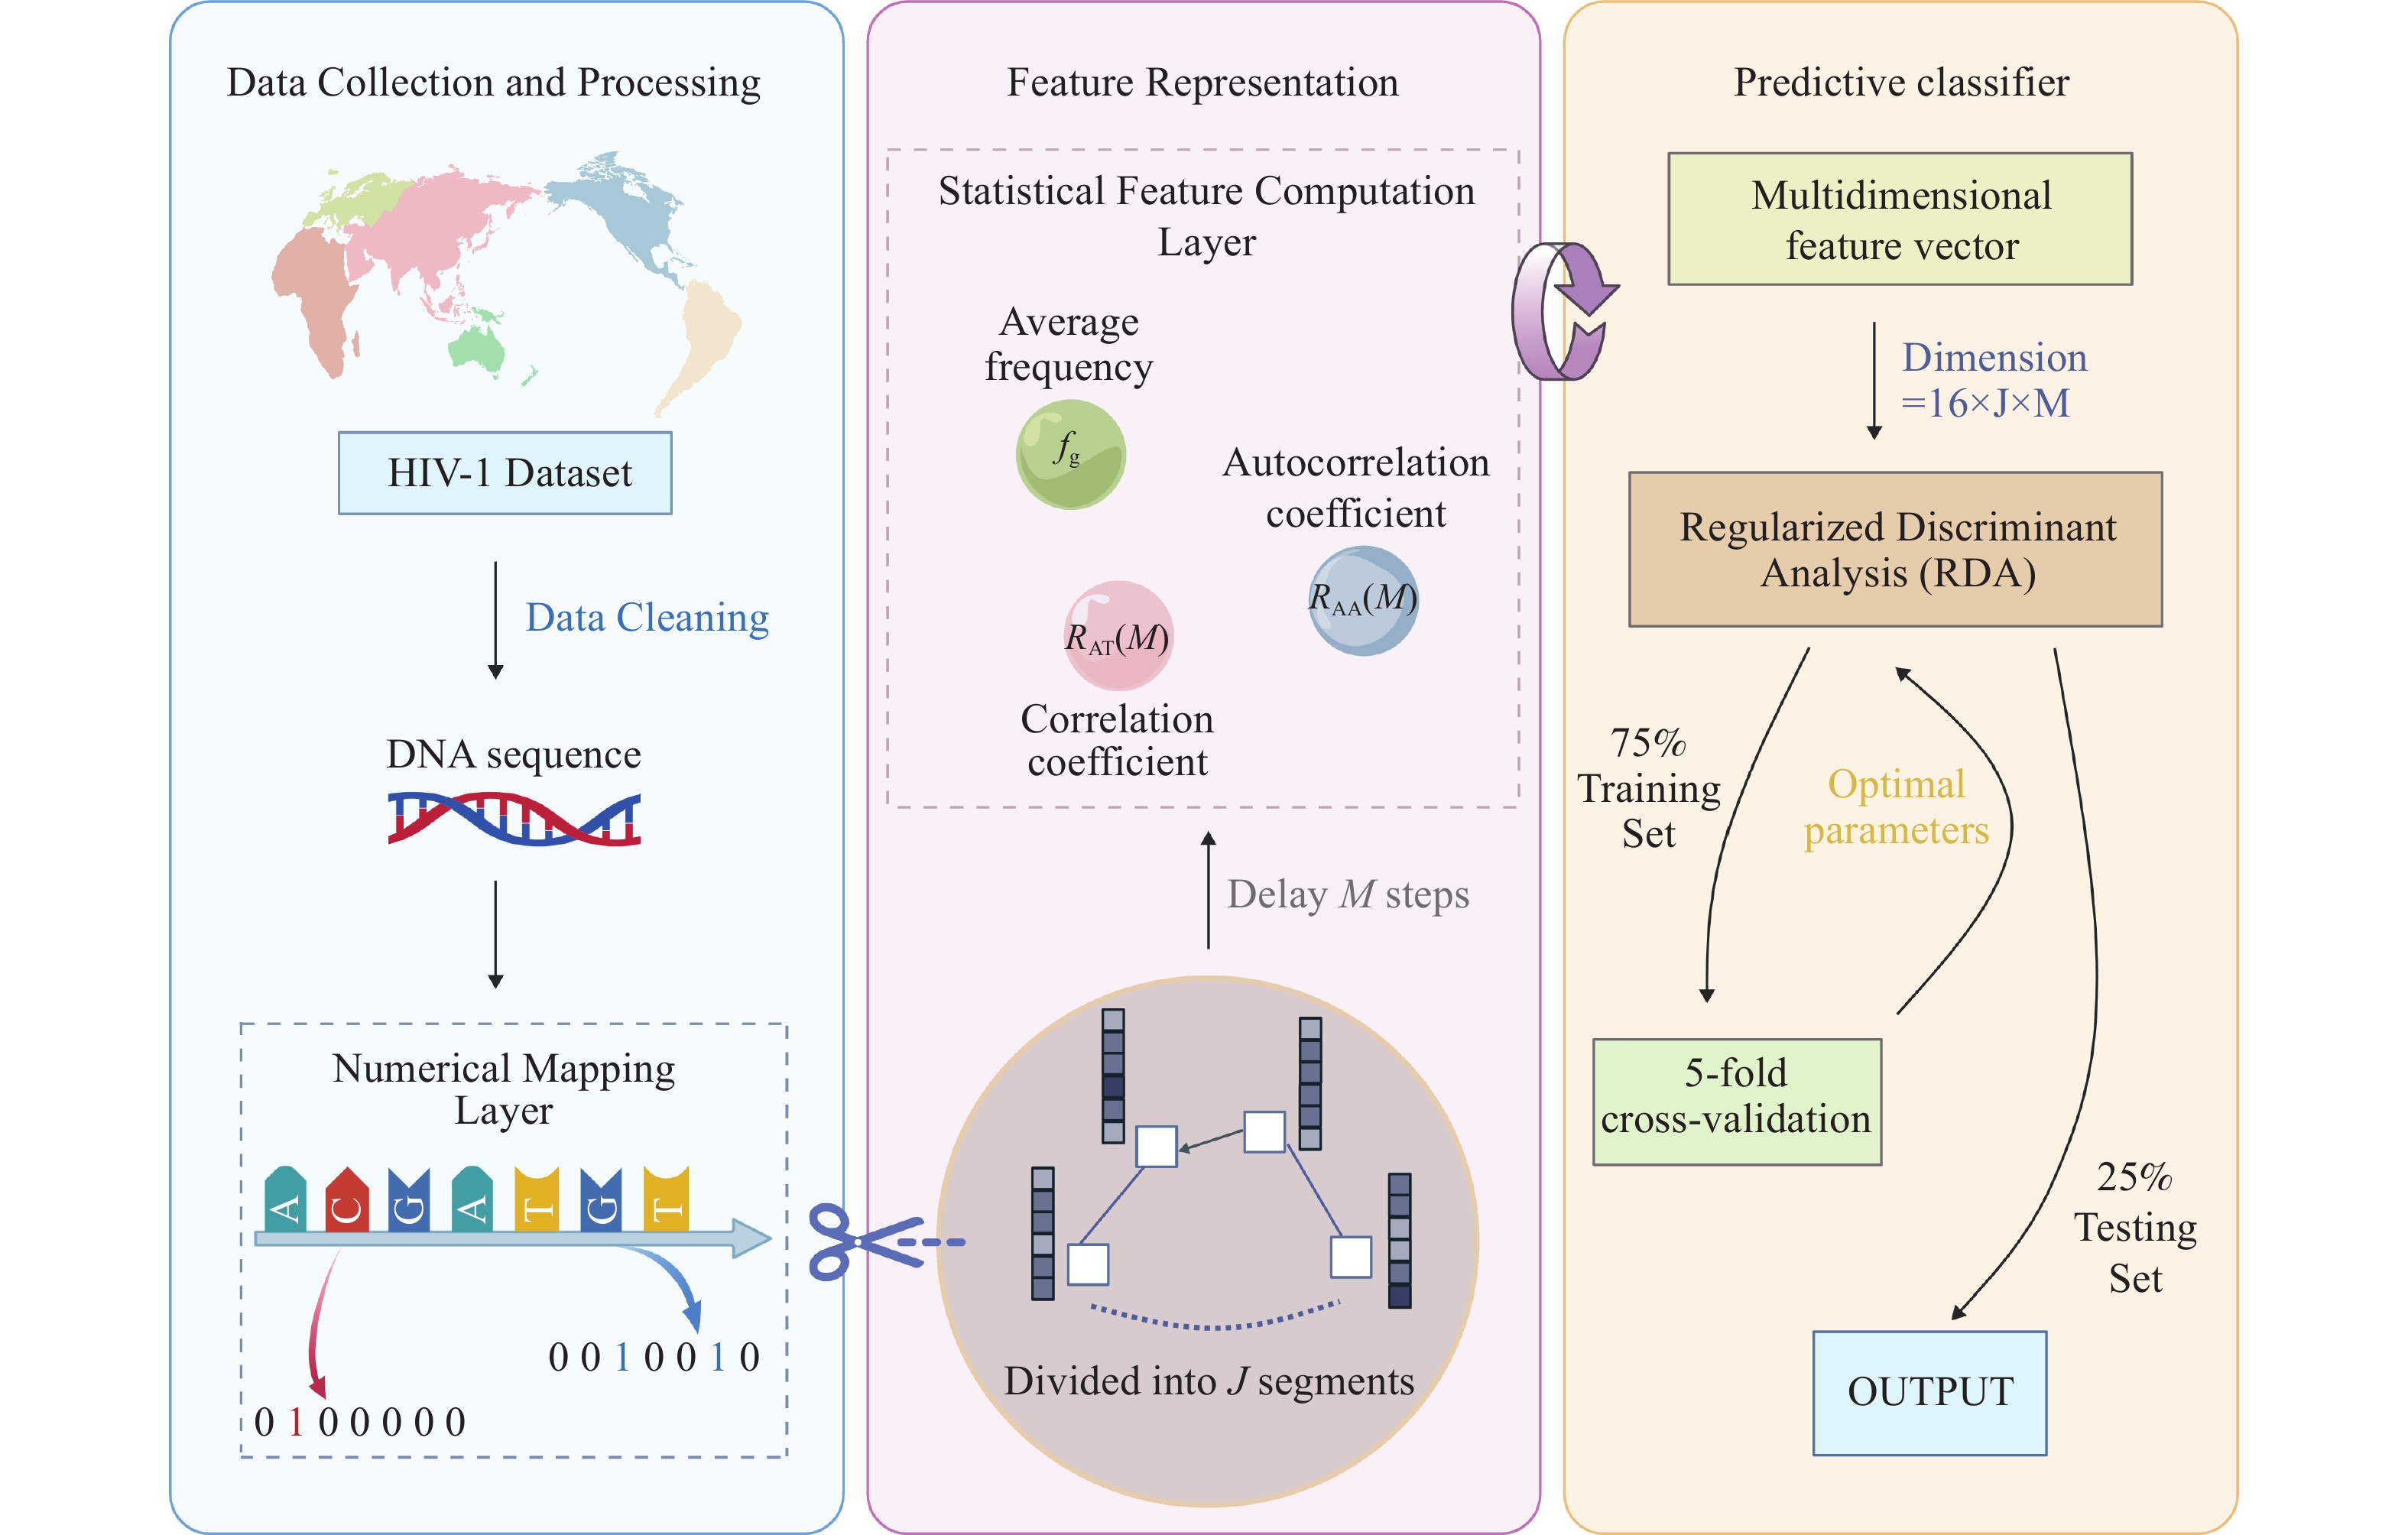 Figure 2.
Framework diagram of the SCCFV method.
Note: created using the BioGDP tool (https://BioGDP.com) (8)
Abbreviation: HIV=human immunodeficiency virus; RDA=regularized discriminant analysis; SCCFV=subsequence correlation coefficient feature vector.
-
The performance of the SCCFV-RDA method was compared with those of COMET (9), REGA (10), and HIVdb (11), which are sequence alignment-based tools that are widely used as authoritative standards in the field. SNV (12), an alignment-free method based on single-nucleotide variation features, was also included for comparison. REGA was not included in the comparative analysis of the Chinese pol dataset because of its prohibitively long computation time.
-
All the computational experiments were performed on a Lenovo Legion Y7000P laptop equipped with an Intel Core i7-14650HX processor, 16 GB RAM, and an NVIDIA GeForce RTX 4050 GPU. The algorithms were implemented using Python (version 3.9) in the Spyder integrated development environment. The key Python libraries NumPy and Pandas were used for data manipulation, whereas Scikit-learn (version 1.2; INRIA, Paris, France) was used for RDA, data preprocessing, model evaluation, and hyperparameter search (RandomizedSearchCV). The model persistence was assessed using Joblib. The source code and data are available at the repository provided in the “Data and code availability” section.
-
We analyzed HIV subtypes with more than nine sequence entries for the full genome and pol, env, gag, nef, rev, tat, vif, vpr, and vpu genes. The model built for each gene demonstrated excellent and robust performance (Table 1).
Dataset ParameterJ Parameter M Accuracy Recall Precision F1-score Number of categories Sample size Complete 5 5 1 1 1 1 34 18,147 pol 5 5 0.9988 0.9988 0.9989 0.9988 35 30,708 env 5 5 0.9986 0.9986 0.9986 0.9986 15 159,312 gag 5 5 0.9997 0.9997 0.9997 0.9997 34 95,637 ref 5 4 0.9988 0.9988 0.9989 0.9988 19 56,826 rev 5 5 0.9985 0.9985 0.9985 0.9985 26 94,842 tat 4 5 1 1 1 1 32 41,346 vif 5 4 0.9987 0.9987 0.9988 0.9987 31 47,792 vpr 4 5 0.9993 0.9993 0.9993 0.9993 19 46,621 vpu 5 5 0.9997 0.9997 0.9997 0.9997 24 105,808 Table 1. Classification metrics for 10 international datasets.
Despite significant variations in the sample size and number of subtypes covered across the datasets, all gene segment models achieved accuracy rates exceeding 99.85%. This demonstrates that the proposed method possesses excellent generalization capability and robustness.
-
The model achieved 99.7% accuracy in classifying 25% of the Chinese HIV pol dataset used as an independent test set.
We compared our model with COMET, HIVdb, and SNV using this same pol independent test set (Table 2).
Method
(Acc)
SubtypeSCCFV (99.70%) SNV (98.80%) HIVdb (82.41%) COMET (73.51%) Recall Precision F1-score Recall Precision F1-score Recall Precision F1-score Recall Precision F1-score B 0.9920 0.9964 0.9942 0.9414 0.9833 0.9619 0.9973 0.9574 0.977 0.9574 1 0.9782 C 0.9892 0.9684 0.9787 0.8280 0.8105 0.8191 0.9892 0.7863 0.8762 0.7634 0.9861 0.8606 CRF01_AE 0.9989 0.9972 0.9981 0.9912 0.9862 0.9887 0.9870 0.9970 0.9920 0.7995 0.9996 0.8884 CRF07_BC 0.9982 0.9980 0.9981 0.9885 0.9818 0.9851 0.6002 0.9971 0.7494 0.5459 1 0.7063 CRF08_BC 0.9991 0.9973 0.9982 0.9873 0.9846 0.9859 0.7873 1 0.8810 0.9545 1 0.9767 CRF55_01B 0.9778 0.9925 0.9851 0.9275 0.9573 0.9421 0.8935 1 0.9438 0.892 1 0.9429 Table 2. Comparison of the performance of four models in classifying Chinese HIV pol data.
Compared with the HIVdb algorithm, which was developed using European and American B subtype data, our method demonstrated comparable performance in classifying the B subtype. However, for the CRF07_BC and CRF08_BC strains prevalent in China, our model achieved recall rates of 0.9882 and 0.9991, respectively, significantly outperforming HIVdb (recall: 0.6002 and 0.7873, respectively). Furthermore, compared with the COMET method that was based on European and American training data, our model clearly demonstrated better recall performance across all categories. The SNV-feature-based linear discriminant analysis classifier performed poorly, with the recall and F1-scores for all subtypes falling below those of the SCCFV method.
We further validated the SCCFV-RDA model using 821 full-genome sequences encompassing the major subtypes circulating in China. The model achieved 100% accuracy, recall, precision, and F1-score for each subtype, indicating classification performance (
Supplementary Table S1 ). These results confirm that the SCCFV-RDA method generalizes effectively to non-pol genomic regions, reinforcing its utility for predicting HIV-1 strains prevalent in China. -
This is the first study to introduce a novel HIV-1 subtype classification method that integrates SCCFV with an RDA classifier. As an alignment-free approach, it effectively extracts discriminative features from HIV-1 sequences. It proved to be faster and more accurate than sequence alignment-based tools such as COMET and HIVdb and showed improvements across all classification metrics when evaluated against the alignment-free SNV method.
Our model — innovatively trained on a domestic sequence database — captures local genetic characteristics and addresses the limitations of international tools in classifying Chinese data. Moreover, unlike sequence alignment-based methods, the feature vector for each sequence need only be computed once, enabling the construction of a comprehensive feature vector database for all HIV-1 strains in China. Notably, the generalizability of our model beyond the pol region was confirmed using an independent set of 821 full-genome sequences.
Furthermore, the algorithm is designed to also predict subtypes for strains circulating globally. For instance, it achieved 99.88% classification accuracy on a global HIV-1 pol gene dataset encompassing 35 subtypes and 30,708 sequences, including 7,178 from Asia and 6,094 from Africa, demonstrating its robust generalizability.
However, this classification method has several limitations. Model performance depends on the quality of the annotated data. The model capability for discriminating rare subtypes with extremely limited sample sizes or URFs requires further validation with increased data accumulation. The model also lacks integration with relevant sociodemographic factors. Additionally, its ability to identify novel subtypes still requires its integration with more in-depth biological experiments.
In summary, we have generated a much-needed method for subtyping HIV-1 strains in China on the basis of specific gene fragments and full-genome sequences. This alignment-free and generalizable method can be directly applied to build a feature vector database of all circulating HIV-1 variants in China. Studies of its suitability for monitoring other rapidly evolving viruses are warranted.
HTML
Dataset
Subsequence Correlation Coefficient Feature Vector Method
Parameter Tuning and Classifier Selection
Comparison with Existing Tools
Implementation Details
Classification of the HIV Sequence Datasets
Classification of the Chinese Dataset
| Citation: |

|