
 Download:


-
Introduction: Human immunodeficiency virus (HIV)/acquired immunodeficiency syndrome (AIDS) remains a global public health threat, with distinct regional patterns across China. In this study, we examined the unique epidemic characteristics of Fujian Province to assess HIV transmission dynamics, evaluate progress toward the “95-95-95” targets, and optimize local prevention strategies.
Methods: HIV/AIDS surveillance data from Fujian Province spanning 1987–2024 were collected to analyze epidemiological characteristics and develop a comprehensive transmission dynamics model. Using the next-generation matrix method, we estimated the effective reproduction number (Reff) to assess transmissibility. By integrating spatiotemporal distribution analysis with evaluation of progress toward the 95-95-95 targets, we assessed epidemic trends and intervention effectiveness.
Results: The HIV/AIDS epidemic in Fujian Province showed an initial increase followed by gradual stabilization, with notable spatiotemporal heterogeneity. High-risk populations included males (81.86%) and individuals aged 20–70 years (89.21%). Although treatment coverage and viral suppression achieved the 95% targets, diagnostic coverage (86.30%) remained suboptimal. Model estimates revealed that Reff declined from 2–5 during 2009–2019 to below 1 after 2020, but rebounded to 1.03 by 2024.
Conclusion: Although HIV transmission in Fujian Province has stabilized, the persistent diagnostic gap and rebound in transmissibility in 2024 indicate potential resurgence risks. Future interventions should prioritize middle-aged and older adults, and enhanced case identification strategies are essential to support achievement of the 2030 HIV elimination targets.
-
Acquired immunodeficiency syndrome (AIDS), caused by human immunodeficiency virus (HIV), remains a major global public health challenge. By 2023, approximately 39.9 million people worldwide were living with HIV, with 1.3 million new infections and 630,000 AIDS-related deaths (1). China has a relatively low HIV/AIDS prevalence; however, significant regional disparities persist, with heterosexual transmission being the predominant route of infection. As of September 2018, China reported 850,000 people living with HIV and 262,000 AIDS-related deaths (2). Given the absence of a definitive cure for HIV infection, prevention strategies remain fundamental for epidemic control. In 2021, the United Nations adopted the Political Declaration on Ending AIDS 2030, and the World Health Organization released the Global Health Sector Strategy 2022–2030, establishing the “95-95-95” targets: 95% of infected individuals knowing their status, 95% receiving antiretroviral therapy, and 95% achieving viral suppression by 2030 (3). By 2020, China had achieved 75%, 92%, and 96%, respectively, with undiagnosed cases representing the primary obstacle (4). Fujian Province has a relatively high prevalence of sexually transmitted infections (5), and increasing HIV incidence poses substantial challenges to meeting the 2030 elimination targets. Mathematical modeling provides valuable tools for assessing HIV transmission dynamics and predicting epidemic trends.
In this study, we constructed a comprehensive transmission dynamics model based on HIV disease progression, calculated the effective reproduction number (Reff) using the next-generation matrix method, and evaluated the feasibility of eliminating AIDS in Fujian Province by 2030. Our findings provide an evidence-based foundation for optimizing regional HIV/AIDS prevention strategies.
We analyzed data from the HIV/AIDS reporting system of Fujian Province to examine epidemiologic characteristics from 1987 to 2024, focusing on spatiotemporal distribution and demographic trends.
We developed a transmission dynamics model based on HIV epidemiologic characteristics, following previous studies (6–7) (
Supplementary Figure S1 ). The model included the following compartments: S (susceptible), I (undiagnosed HIV-infected), T1 (diagnosed HIV-infected), T2 (receiving antiretroviral therapy), T3 (suppressed viral load), and A (people living with AIDS). Model assumptions were as follows: 1) Newborns are susceptible (S), with birth (br) and mortality rates (dr). 2) Susceptible individuals (S) may become infected through contact with individuals in compartments I, A, T1, or T2. The baseline transmission rate for I is β, and the relative transmissibility of A, T1, and T2 is κ, κ1, and κ2 times that of I, respectively. 3) Parameter p1 represents diagnostic coverage. The monthly transition rate from I to T1 is p1I, whereas individuals in I progress to AIDS at a rate of (1−p1)ω1I. 4) Parameter p2 represents treatment coverage. Individuals in T1 compartment transition to T2 at a monthly rate of p2δT1, while progression to AIDS occurs at a rate of (1−p2)ω2T1. 5) Parameter p3 denotes the viral suppression rate. Individuals in T2 progress to T3 at a monthly rate of p3γT2, whereas progression to AIDS occurs at a rate of (1−p3)ω3T2. 6) Parameter q represents the proportion of patients progressing to AIDS despite viral suppression. Individuals in T3 transition to AIDS at a monthly rate of qω4T3. 7) Disease-induced mortality rates are denoted by f1 for HIV-infected individuals and f2 for individuals with AIDS. Parameter details are provided in Table 1. The differential equation system is presented inSupplementary Figure S1B .Parameters Definition Unit Value Range Methods β Transmission rate coefficient of HIV-infected individuals,
the effective contact rate per monthMonth−1 − 0–1 Model fitting κ Transmission rate coefficient of patients with AIDS 1 0.2692 0–1 Reference κ1 Transmission rate coefficient of individuals diagnosed with HIV 1 − 0–1 Model fitting κ2 Transmission rate coefficient of ART-treated individuals 1 0.1111 0–1 Reference p1 Diagnosis coverage among individuals infected with HIV 1 − 0.2690–0.8620 Data collection p2 Treatment coverage among individuals diagnosed with HIV 1 − 0.2452–0.9705 Data collection p3 Viral suppression rate among ART-treated individuals 1 − 0.8482–0.9656 Data collection q Proportion of virally suppressed individuals progressing to AIDS 1 0.0500 0–1 Hypothesis ω1 Progression rate from HIV infection to AIDS Month−1 0.0093 0.0064–0.0189 References ω2 Progression rate from HIV diagnosis to AIDS Month−1 0.0083 – Hypothesis ω3 Progression rate from ART-treated individuals to AIDS Month−1 0.0076 – Hypothesis ω4 Progression rate from viral suppression individuals to AIDS Month−1 0.0069 – Hypothesis δ Progression rate from diagnosis to treatment Month−1 0.9709 0.0592– 3.3333 Reference γ Progression rate from treatment to viral suppression Month−1 0.1111 0.0833–0.1429 References f1 Fatality rate of individuals infected with HIV Month−1 − 0–0.1111 Data collection f2 Fatality rate of patients with AIDS Month−1 − 0–0.3333 Data collection br Birth rate Month−1 − 0.0006–0.0021 Statistical yearbook dr Death rate Month−1 − 0.0004–0.0006 Statistical yearbook Note: “−” means non-unique values, encompassing both year-to-year variations and changes across different time periods.
Abbreviation: HIV=human immunodeficiency virus; ART=antiretroviral therapy; AIDS=acquired immunodeficiency syndrome.Table 1. Definitions and values of model parameters.
The basic reproduction number (R0) represents the expected number of secondary infections generated by one infected individual in a completely susceptible population without interventions. The Reff measures the transmission potential under ongoing intervention and was calculated using the next-generation matrix method (8). The detailed formula is provided in the Supplementary Materials.
Between 1987 and 2024, Fujian Province reported 30,602 HIV/AIDS cases and 6,032 deaths. The epidemic showed distinct phases: annual cases remained below 10 during 1987–1996, increased gradually during 1997–2003, surpassed 100 after 2004, exceeded 1,000 beginning in 2013, and peaked in 2019 before stabilizing (Figure 1A). Since 2010, incidence patterns have shown consistent troughs in February, with mortality mirroring these seasonal variations. Annual deaths exceeded 100 in 2009 and 500 in 2018. After 2008, the annual mortality rate consistently remained above 1 per 100,000 population (Figure 1B). The spatial distribution of HIV/AIDS exhibited pronounced regional disparities, with higher prevalence in coastal areas and lower prevalence inland. Since 2004, prevalence has shifted from localized clustering to province-wide distribution.
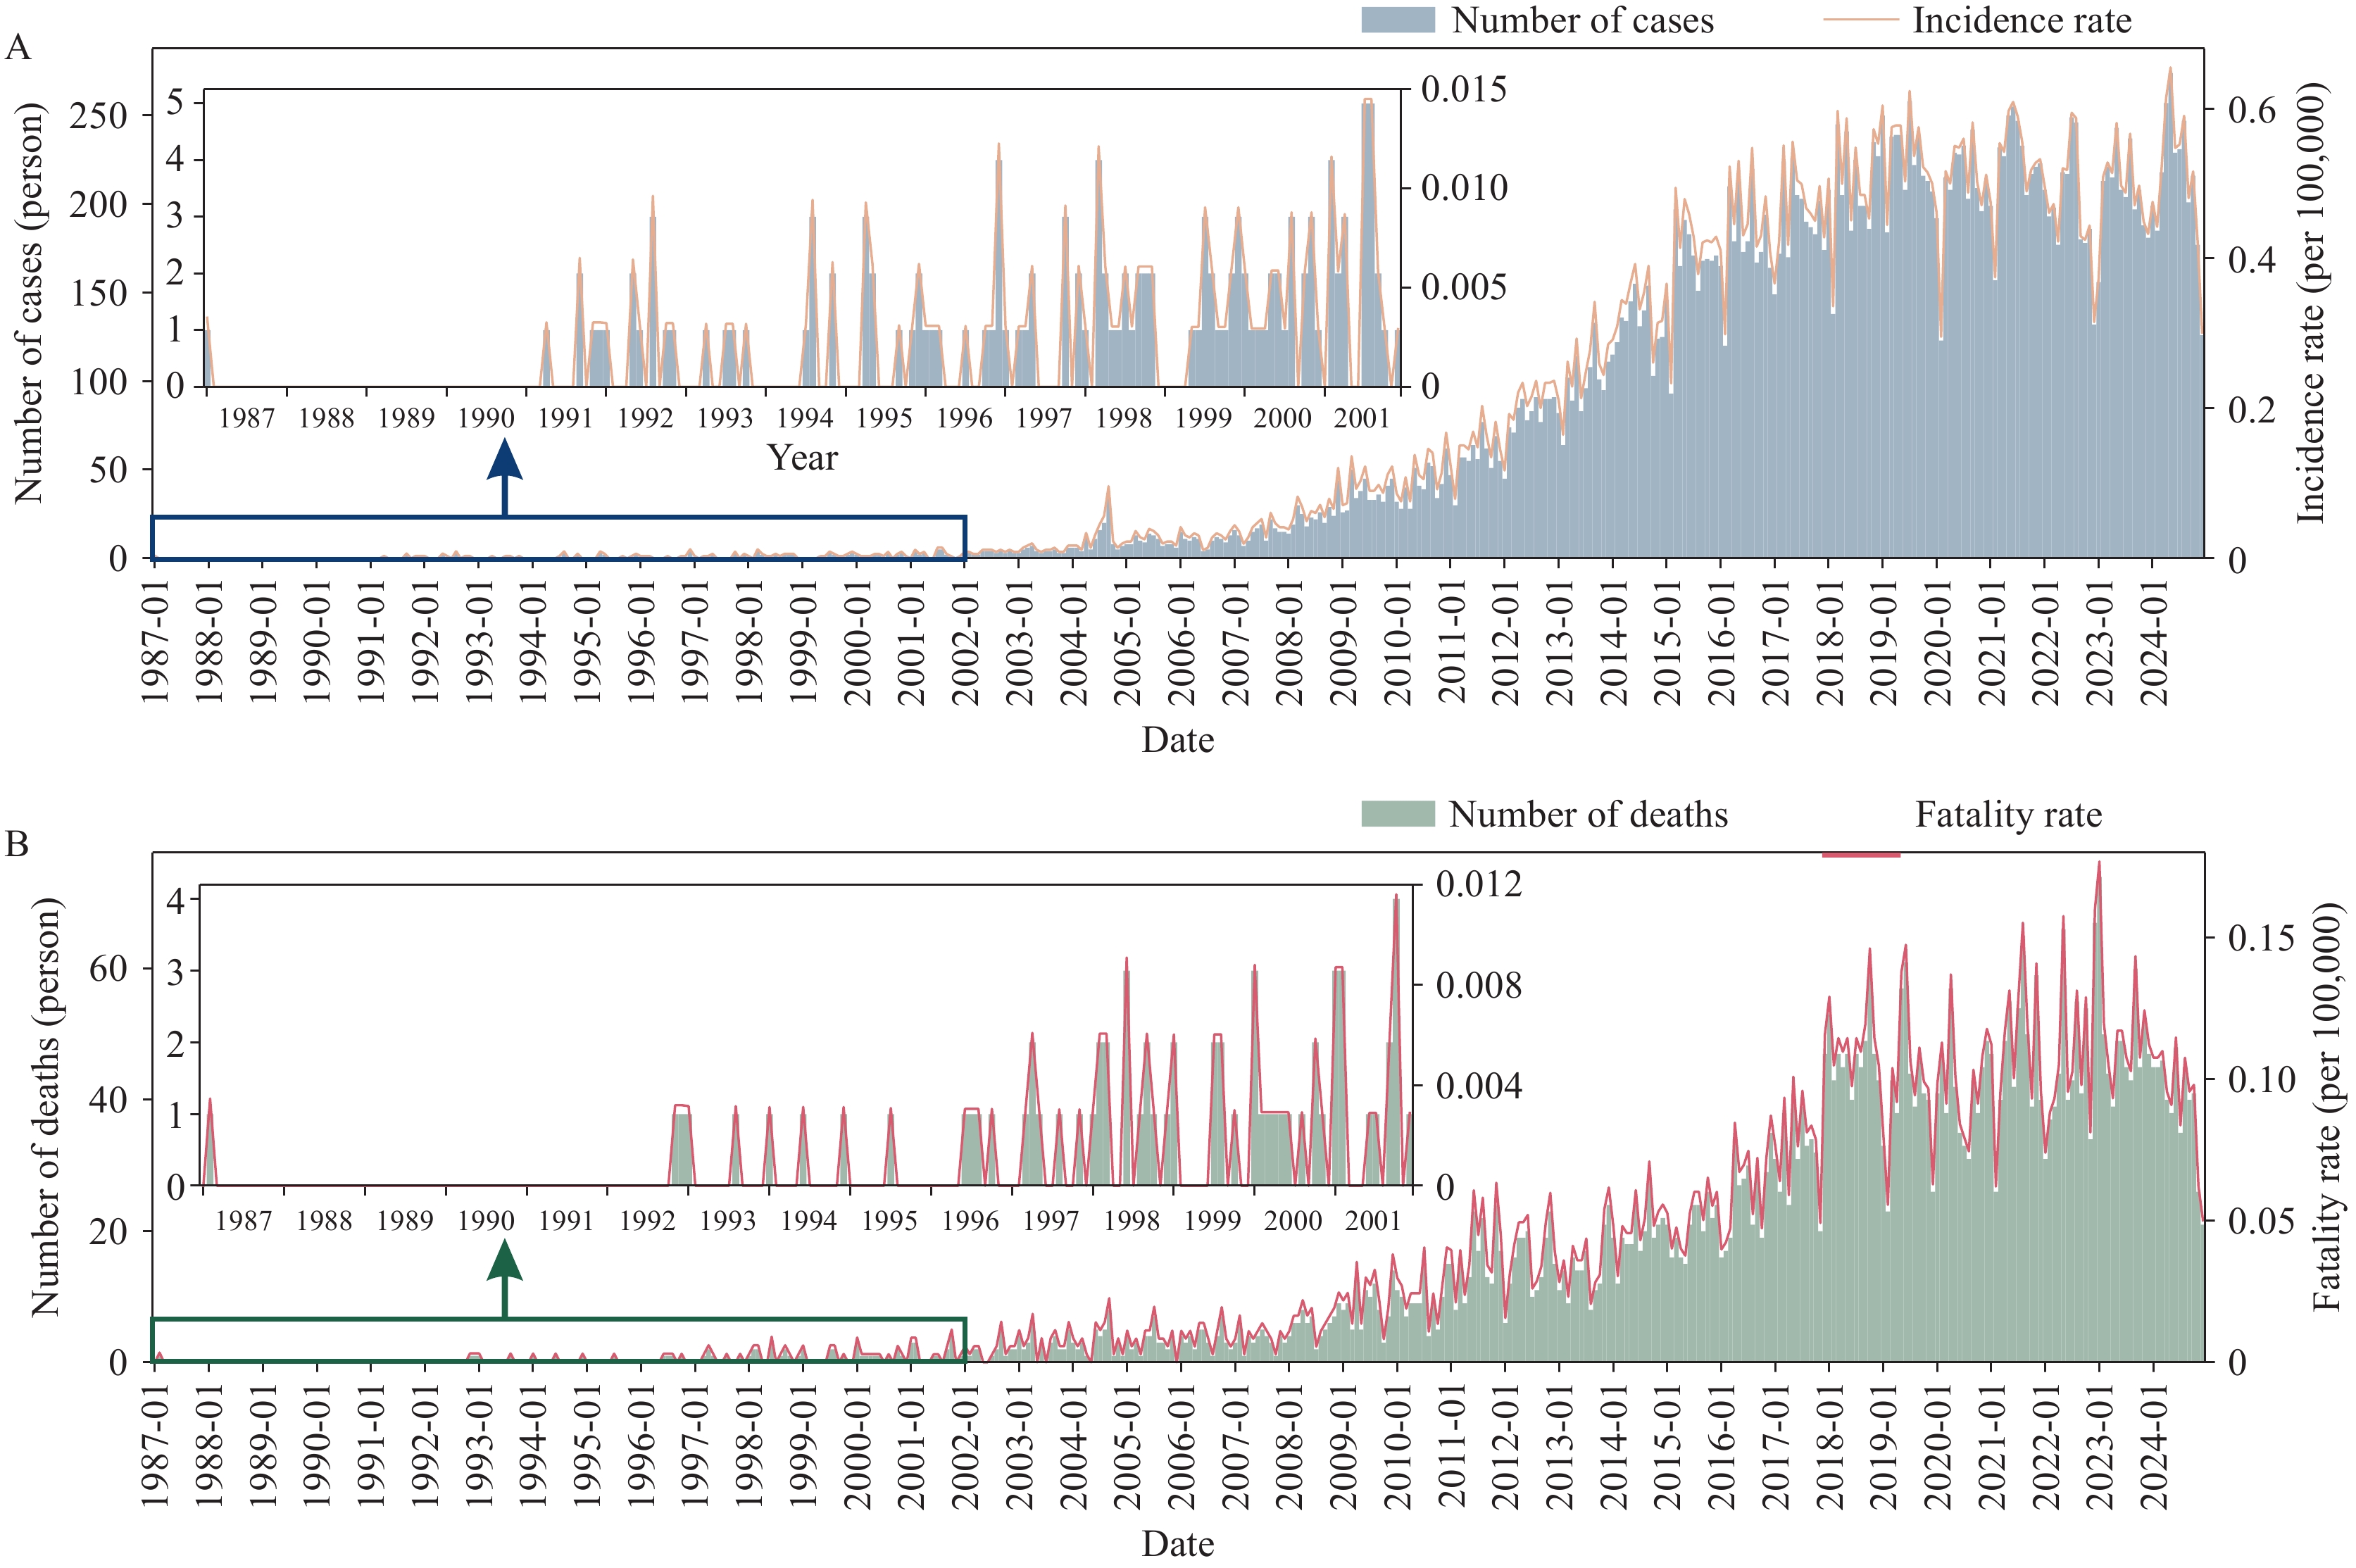 Figure 1.
Temporal distribution of HIV/AIDS in Fujian Province, 1987–2024. (A) Reported HIV/AIDS cases and incidence rate (per 100,000 population),1987-2024; (B) AIDS-related deaths and case fatality rate (per 100,000 population), 1987-2024.
Abbreviation: HIV=human immunodeficiency virus; AIDS=acquired immunodeficiency syndrome.Among the 30,602 patients with HIV/AIDS, 25,050 (81.86%) were male and 5,552 (18.14%) were female, yielding a male-to-female ratio of 4.51∶1 (Figure 2A). Males consistently outnumbered females across all periods, comprising approximately 80% of cases since 2012. The predominant age range was 20–70 years, accounting for 27,300 patients (89.21%) (Figure 2B). In 1991, most cases occurred among individuals aged 20–40 years. By 2020, a bimodal distribution emerged, with peaks among young adults (20–40 years) and middle-aged to older adults (50–70 years). By 2024, the 50–70-year age group exhibited a higher incidence peak than the 20–40-year cohort, suggesting a shift in disease burden toward older populations.
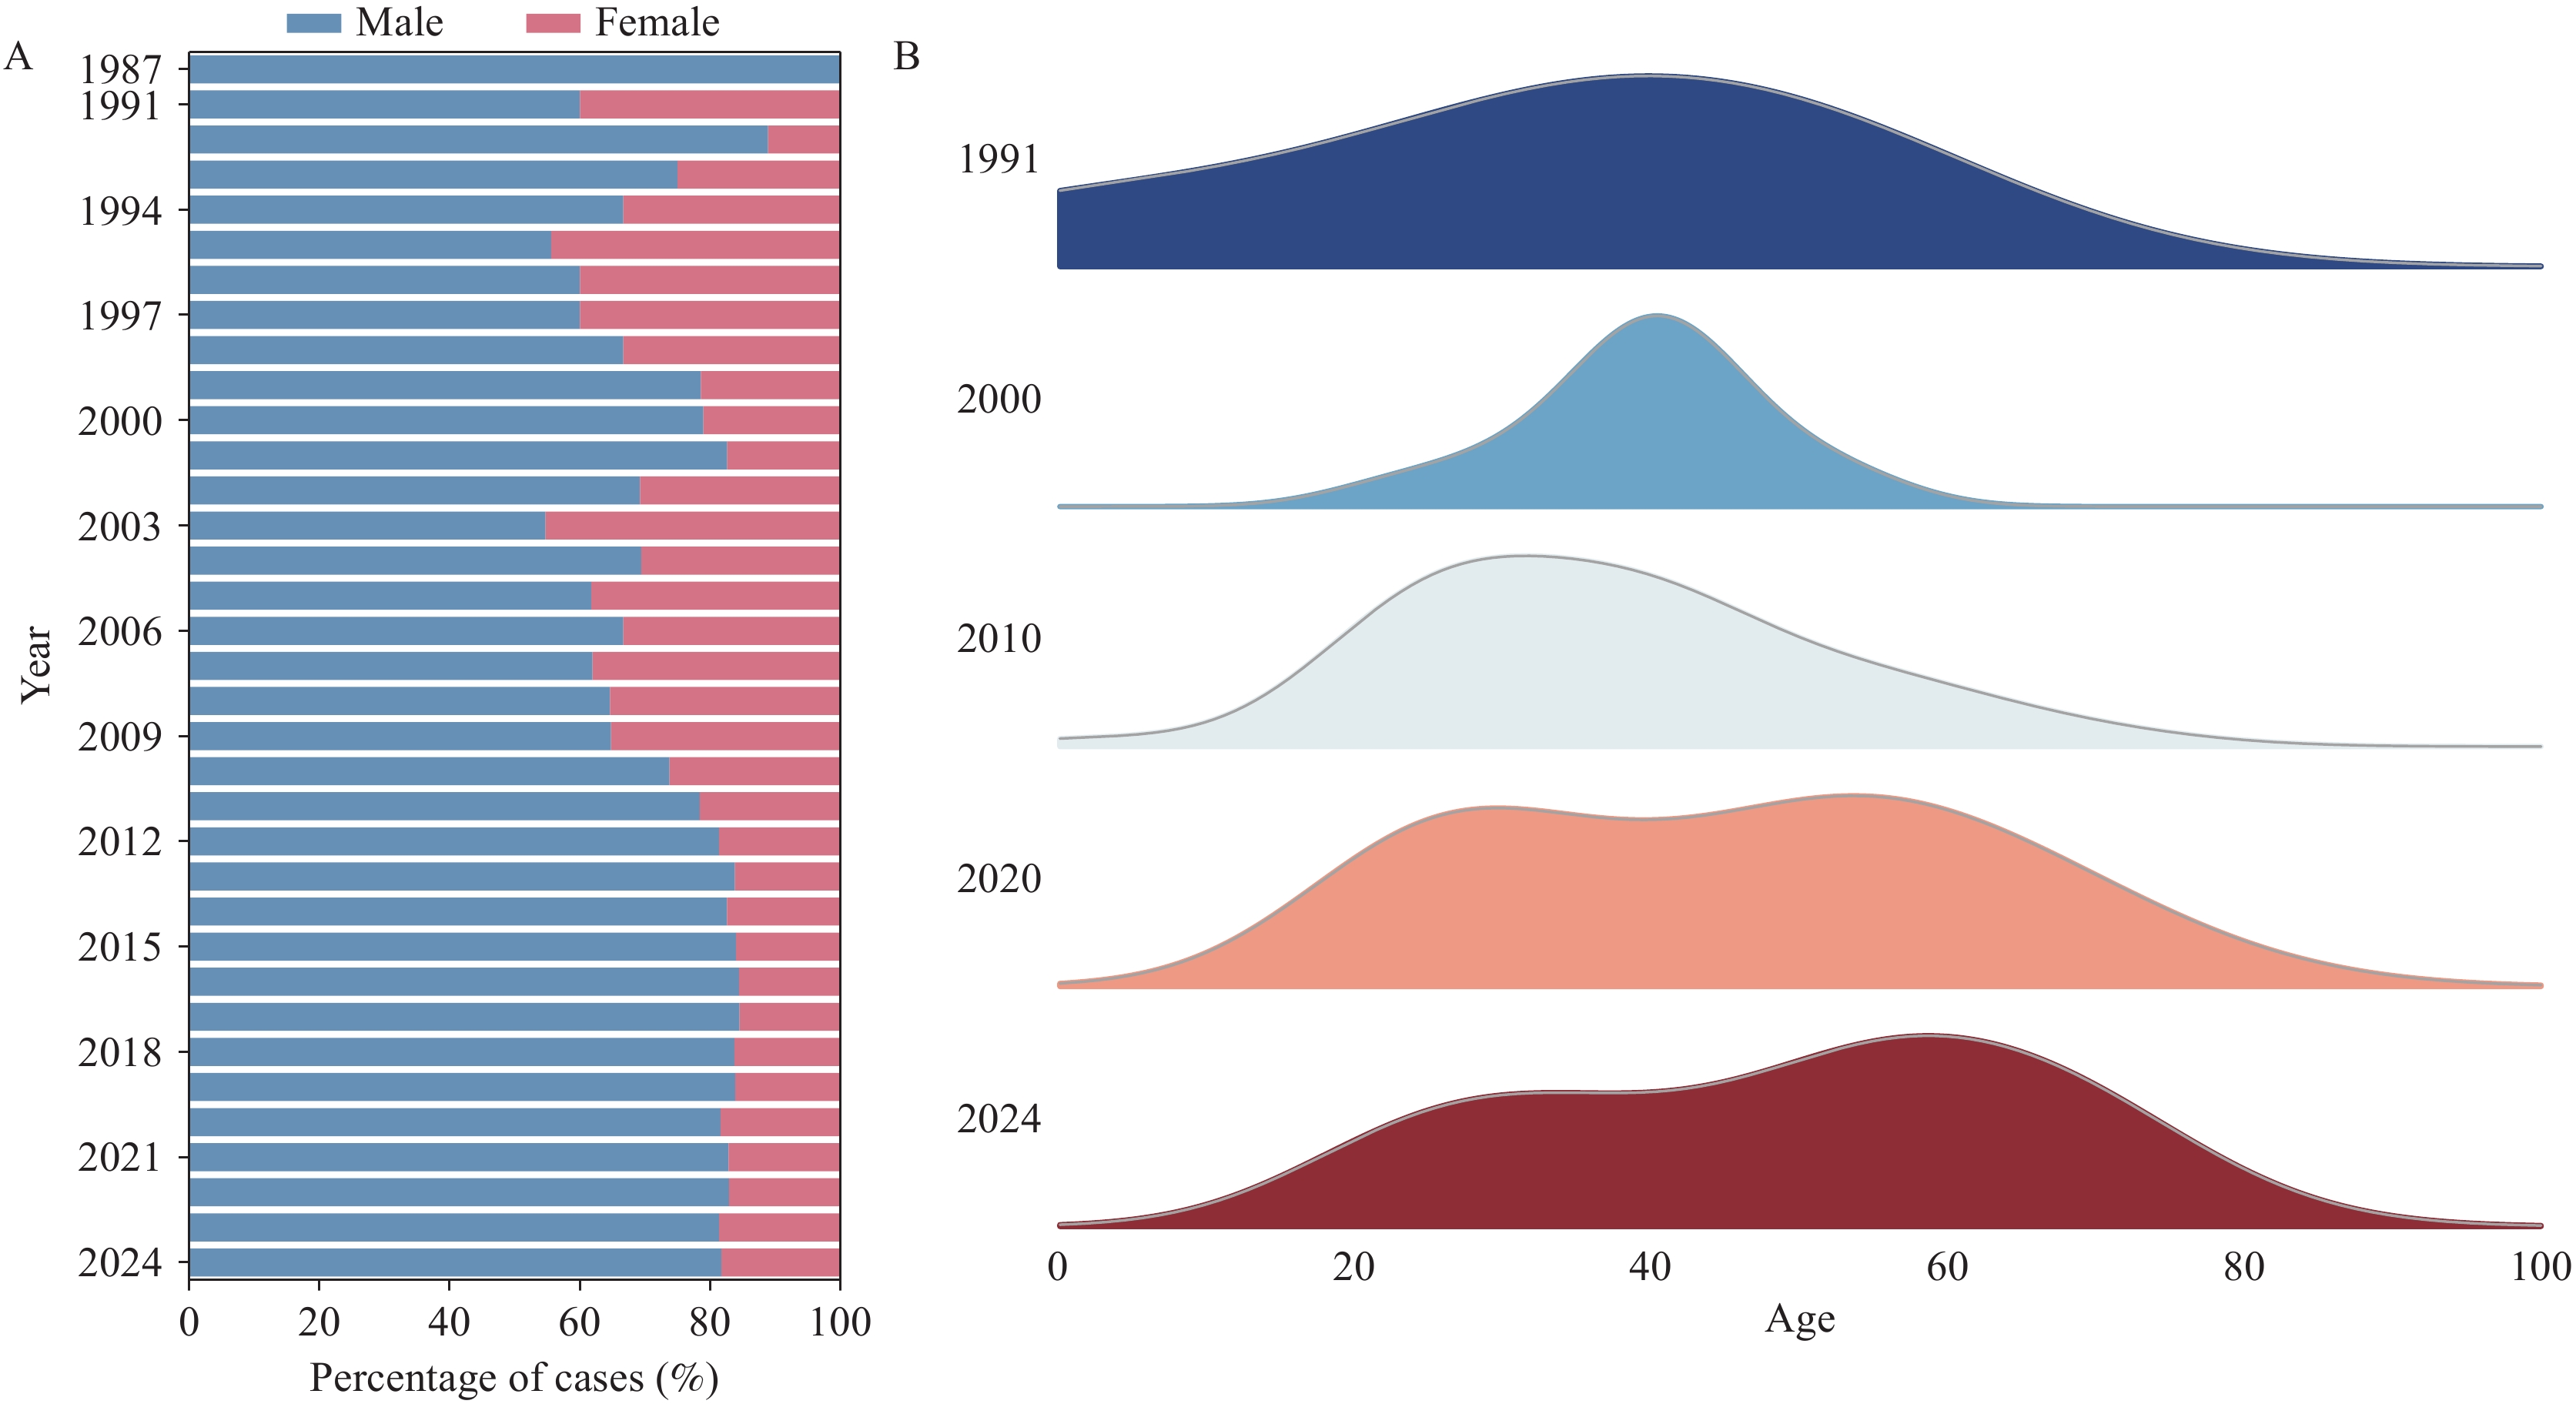 Figure 2.
Demographic distribution of HIV/AIDS cases in Fujian Province, 1987–2024. (A) Sex ratio of reported HIV/AIDS cases from 1987 to 2024 (data unavailable during 1988–1990). (B) Age distribution of reported HIV/AIDS cases in 1991, 2000, 2010, 2020, and 2024.
Abbreviation: HIV=human immunodeficiency virus; AIDS=acquired immunodeficiency syndrome.Fujian Province showed substantial progress toward the “95-95-95” targets during 2009–2024 (Figure 3). Diagnostic coverage increased from 26.90% (2009) to 86.30% (2024), remaining below the 95% target despite a temporary decline in 2018. Treatment coverage increased steadily, reaching 97.05% by 2024 and surpassing the 95% goal. Viral suppression rates exceeded 90% by 2011 and remained above 95% after 2019, achieving the target before 2030.
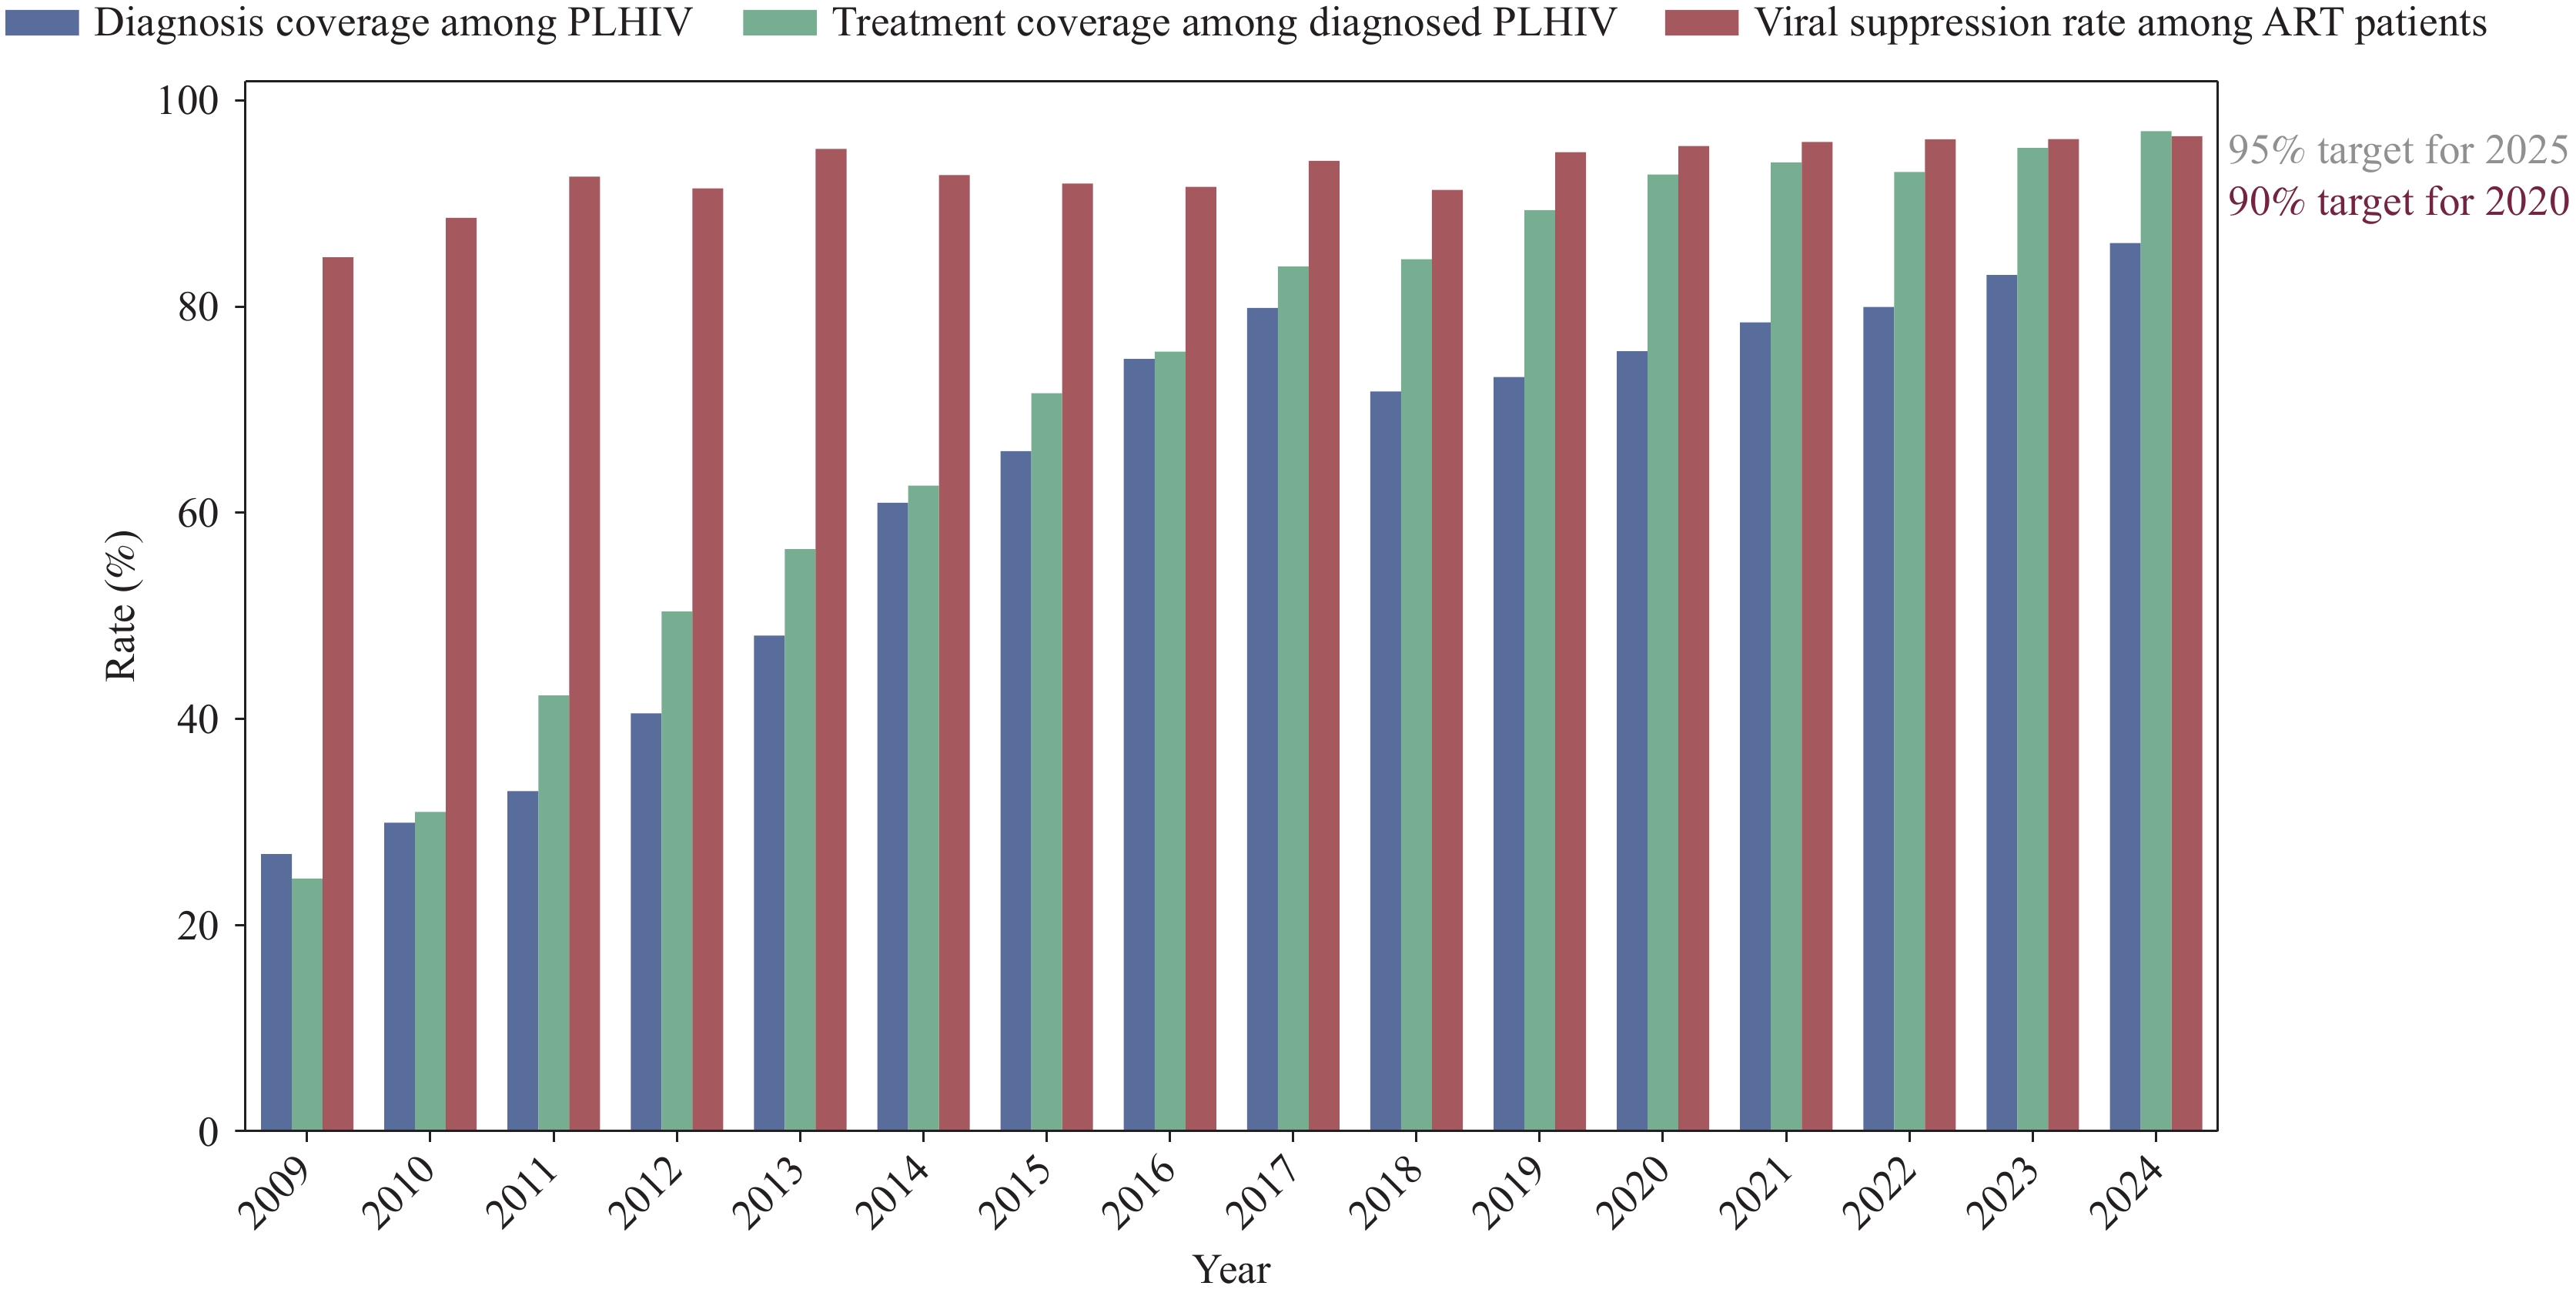 Figure 3.
Progress toward the “95-95-95” targets in Fujian Province, 2009–2024.
Abbreviation: PLHIV=people living with HIV; ART=antiretroviral therapy.We fitted the HIV transmission dynamics model to reported case numbers from 2009 to 2024. Model fitting was conducted across three periods: the slow-growth phase (2009–2012), rapid-growth phase (2013–2019), and stabilization phase (2020–2024) (
Supplementary Figure S2A ). Goodness-of-fit analysis showed statistically significant results (R2=0.864, P<0.001), indicating robust model performance (Supplementary Figure S2B ).The monthly Reff of HIV in Fujian Province from 2009 to 2024 (
Supplementary Figure S3A ) revealed three phases: 1) a slow-growth period (2009–2012), with Reff fluctuating consistently above the epidemic threshold; 2) a rapid-expansion phase (2013–2019), with Reff values ranging from 2.0 to 4.0 above the threshold; and 3) a stabilization phase (2020–2024), during which Reff declined toward 1.0, fell below the threshold after late 2022, and resurged to 1.03 by December 2024. Box plot analysis (Supplementary Figure S3B ) confirmed these trends. From 2009 to 2019, Reff exceeded 1.0 with considerable monthly variability, whereas by 2023 it fell below the epidemic threshold and became more tightly clustered, indicating improved epidemic control. -
In this study, we analyzed HIV/AIDS epidemiological patterns in Fujian Province and developed a transmission dynamics model. Through model fitting, we calculated transmissibility parameters, providing a foundation for understanding epidemic dynamics and informing optimized control strategies.
The spatiotemporal evolution of HIV/AIDS in Fujian Province exhibited phase progression characterized by regional heterogeneity. From 2020 to 2024, the epidemic exhibited a gradual upward trend, with a markedly slower growth rate than that observed before 2019. Annual reporting troughs each February since 2010 coincided with Spring Festival migration, which may reflect the “Spring Festival effect” reported for certain sexually transmitted infections in previous studies (9). No clear seasonal variation was observed in HIV incidence. Spatial distribution correlates with economic development and population mobility. Males consistently accounted for 80% of cases after 2012, yielding a 4.51∶1 male-to-female ratio exceeding the national average and likely reflecting coastal migration patterns (10). Age distribution revealed a bimodal pattern, with middle-aged and older adults surpassing young adults, consistent with global demographic transitions associated with antiretroviral therapy benefits (11). Prevention strategies should emphasize pre-exposure prophylaxis (PrEP) implementation among younger populations while strengthening screening among older adults (12).
Fujian Province has made substantial progress toward the “95-95-95” targets, although indicators developed unevenly. Although diagnostic coverage exceeded national levels, it remained below the 2030 AIDS elimination target. Treatment coverage and viral suppression rates surpassed their targets. This disparity highlights the need to strengthen proactive screening among high-risk populations and enhance treatment adherence programs.
The epidemic exhibited distinct phases. During 2009–2012, Reff fluctuated between 2.5–5, reflecting limited coverage of early prevention measures (13–14). We developed a comprehensive HIV transmission dynamics model for Fujian Province spanning 2009–2024, calibrated using a three-phase structure aligned with major shifts in provincial intervention strategies. The model demonstrated robust performance with strong statistical fit. The expansion of testing and treatment policies during 2013–2019 contributed to a decline in Reff, although it remained above the epidemic threshold. A marked decline in Reff was observed in early 2020, likely associated with public health and social measures implemented during the COVID-19 pandemic (15). From 2020 to 2024, Reff remained lower than in the pre-2019 period, while case numbers increased at a substantially slower rate. The slight rebound in Reff observed at the end of 2024 may reflect persistent undiagnosed infections. Strengthening case detection and sustaining high treatment coverage remain essential to achieving the “95-95-95” targets by 2030.
This study has several limitations that require consideration. First, the transmission dynamics model treated the population as homogeneous and did not account for individual behavioral patterns or social network structures influencing HIV transmission. Second, the model did not simulate specific intervention measures because current prevention strategies target high-risk populations through approaches that cannot be readily quantified using mathematical parameters. Future research should incorporate these behavioral and network factors to provide more comprehensive evaluations of progress toward ending the HIV epidemic by 2030.
In conclusion, the HIV/AIDS epidemic in Fujian Province demonstrated significant spatiotemporal heterogeneity, with coastal regions representing high-incidence areas. Males and individuals aged 20–70 years constituted the primary affected populations. The transmission dynamics model showed that Reff consistently exceeded the epidemic threshold throughout 2009–2019. After 2020, transmissibility declined below unity, although an upward trajectory emerged in 2024, signaling potential resurgence risk. While treatment coverage and viral suppression achieved the 95% benchmark, diagnostic coverage remained suboptimal. Future prevention efforts must prioritize targeted interventions for middle-aged and older adults, expand self-testing accessibility, and address diagnostic gaps to realize the 2030 objective of ending the HIV epidemic.
HTML
| Citation: |

|