
 Download:


-
In 2022, lung cancer was the leading cause of cancer worldwide and in China, accounting for 25.2%–28.5% of all malignant tumor-related deaths in China (1–2). With approximately 733,000 deaths annually, averaging over 2,000 deaths per day, lung cancer represents a major public health challenge (3). These figures underscore the importance of developing intuitive population-level indicators that reflect nationwide incidence and mortality rates of the disease.
The lifetime risk (LTR) of cancer is defined as the cumulative probability that an individual will be diagnosed with or die from cancer over the course of their lifetime, explicitly accounting for life expectancy and competing risks of death (4–6). Crucially, to avoid overestimating China’s rapidly aging population, LTR calculations should be adjusted for multiple primaries (AMP). This approach shifts the focus from a “tumor-based” to a “person-based” metric, providing a rigorous and realistic measure of the cumulative disease burden specifically.
Currently, there is limited research assessing the cumulative burden of lung cancer in China from an LTR perspective at both national and regional levels. To address this gap, this study aimed to estimate the LTR of lung cancer development and death across China using data from the Global Burden of Diseases, Injuries, and Risk Factors Study (GBD) 2023.
-
The cumulative risk is calculated by the formula:
$$ \mathrm{Cumulative}~\mathrm{risk}=1-e^{-\mathrm{cumulative}\; \text{rate}} $$ (1) $$ \mathrm{Cumulative}~\mathrm{rate}=\sum_{ }^{ }\limits_{i=1}^AW_iR_i $$ (2) $ A $ denotes the age bands typically used, 74, for the cumulative rate. $ {W}_{i} $ denotes the width of the ith age interval. $ {R}_{i} $ denotes age-specific incidence rates.
-
The AMP method was used to calculate the LTR, which accounts for deaths from other causes and applies a correction to routinely published incidence data to adjust for potential overestimation caused by recording multiple primary tumors within the same individual (6–7). This characteristic makes the AMP method particularly suitable for estimating the risks of all cancers, less survivable cancers, or specific cancers prone to multiple primary sites using routinely released data for the 5-year age group.
$$ \begin{aligned} S=& \int \limits_{0}^{\infty }{\lambda }_{c}\left(a\right){S}_{0}\left(a\right)da=\sum \limits_{i=1}^{f}\frac{{R}_{i}}{{R}_{i}+{M}_{i}-{D}_{i}}\widehat{S}_{0}^{*}\left({a}_{i}\right)\times\\ & \left(1-exp\left(-\frac{{w}_{i}}{{N}_{i}}\left({R}_{i}+{M}_{i}-{D}_{i}\right)\right)\right) \end{aligned} $$ (3) $$ \widehat{S}_{0}^{*}\left({a}_{i}\right)=exp(-\sum \limits_{j=1}^{i-1}\frac{{R}_{j}+\left({M}_{j}-{D}_{j}\right)}{{N}_{j}}) $$ (4) where for the age group $ i $: $ {R}_{i} $ indicates the annual number of cancer cases (When estimating the risk of developing lung cancer, $ {R}_{i} $ is the annual number of cases. When estimating the risk of dying from lung cancer, $ {R}_{i} $ is the annual number of deaths); $ {M}_{i} $ indicates the annual number of deaths; $ {D}_{i} $ indicates the annual number of cancer-related deaths; $ {N}_{i} $ indicates the population; $ {w}_{i} $ denotes the width of the age group $ i $. $ {\lambda }_{\mathrm{c}} $ indicates the cancer incidence rate; $ \widehat{S}_{0}^{*}\left({a}_{i}\right) $ denotes the probability of being alive and cancer-free at age $ {a}_{i} $. The 95% uncertainty intervals (UIs) were derived from the 2.5th and 97.5th percentiles of each estimate distribution.
Data on lung cancer incidence and mortality were obtained from GBD 2023 and stratified by sex and age group (0–4, 5–9, …, 90–94, and >95 years). Detailed population data for each province stratified by age group were not available for the non-census years. Therefore, the most recent authoritative dataset from the Seventh National Population Census conducted in 2020 was utilized to represent provincial age structures in this study.
This study estimated the LTR of lung cancer at both national and regional levels. The regional analysis encompassed geographic areas eastern, northern, northeastern, northwestern, south–central, and southwestern China. The eastern region includes Shanghai, Jiangsu, Zhejiang, Anhui, Fujian, Jiangxi, and Shandong provincial-level administrative divisions (PLADs); northern region includes Beijing, Tianjin, Hebei, Shanxi, and Inner Mongolia PLADs; the northeastern region includes Liaoning, Jilin, and Heilongjiang PLADs; northwestern region includes Shaanxi, Gansu, Qinghai, Ningxia, and Xinjiang PLADs; south-central region includes Henan, Hubei, Hunan, Guangdong, Guangxi, and Hainan PLADs; southwestern region includes Chongqing, Sichuan, Guizhou, Yunnan, and Xizang PLADs. All analyses were performed using R software (version 4.5.1, R Foundation for Statistical Computing, Vienna, Austria).
-
In 2023, the LTRs of developing and dying from lung cancer in the overall Chinese population were 6.52% (95% UI: 6.28, 6.56) and 5.98% (95% UI: 5.57, 6.26), respectively (Tables 1–2). Substantial regional variations in LTR had been observed across China. The Northeast region exhibited the highest LTRs for both developing and dying from lung cancer, at 7.86% (95% UI: 6.77, 8.50) and 7.42% (95% UI: 6.24, 8.18), respectively — markedly exceeding the national averages. In contrast, the Northwest region recorded the lowest LTRs, at 4.00% (95% UI: 3.59, 4.84) for developing lung cancer and 3.87% (95% UI: 3.37, 4.75) for death. This regional pattern remained consistent across sex groups.
Region Lifetime (birth–death) Age: 40–death Age: 50–death Age: 60–death Age: 70–death Lung cancer incidence (total population) China 6.52 (6.28, 6.56) 6.59 (6.36, 6.64) 6.57 (6.33, 6.62) 6.26 (5.99, 6.32) 5.17 (4.85, 5.22) Eastern 7.36 (6.55, 8.02) 7.43 (6.61, 8.11) 7.41 (6.58, 8.10) 7.11 (6.29, 7.78) 5.97 (5.24, 6.54) Northern 6.44 (5.83, 7.10) 6.50 (5.89, 7.18) 6.49 (5.87, 7.17) 6.26 (5.64, 6.92) 5.28 (4.73, 5.85) Northeastern 7.86 (6.77, 8.50) 7.91 (6.81, 8.57) 7.89 (6.77, 8.55) 7.59 (6.47, 8.26) 6.28 (5.24, 6.89) Northwestern 4.00 (3.59, 4.84) 4.06 (3.64, 4.92) 4.03 (3.61, 4.89) 3.80 (3.40, 4.61) 3.08 (2.74, 3.72) South–central 6.15 (5.51, 6.81) 6.21 (5.56, 6.89) 6.18 (5.53, 6.87) 5.86 (5.23, 6.51) 4.75 (4.21, 5.27) Southwestern 5.74 (5.06, 6.41) 5.84 (5.14, 6.54) 5.80 (5.10, 6.50) 5.37 (4.71, 6.03) 4.33 (3.79, 4.85) Lung cancer incidence (males) China 8.28 (7.74, 8.38) 8.43 (7.87, 8.54) 8.46 (7.88, 8.57) 8.14 (7.52, 8.28) 6.73 (6.06, 6.89) Eastern 9.71 (8.27, 10.85) 9.86 (8.37, 11.04) 9.89 (8.39, 11.09) 9.57 (8.07, 10.75) 8.04 (6.66, 9.07) Northern 7.77 (6.76, 8.75) 7.90 (6.85, 8.92) 7.93 (6.86, 8.98) 7.72 (6.64, 8.75) 6.52 (5.53, 7.42) Northeastern 8.80 (6.71, 9.95) 8.89 (6.77, 10.09) 8.92 (6.77, 10.15) 8.66 (6.50, 9.91) 7.17 (5.22, 8.33) Northwestern 5.20 (4.54, 6.37) 5.32 (4.63, 6.54) 5.32 (4.63, 6.56) 5.08 (4.41, 6.26) 4.11 (3.57, 5.04) South–central 8.02 (6.85, 9.00) 8.15 (6.94, 9.17) 8.17 (6.95, 9.22) 7.84 (6.63, 8.85) 6.37 (5.33, 7.20) Southwestern 7.32 (6.07, 8.44) 7.52 (6.21, 8.71) 7.53 (6.21, 8.75) 7.04 (5.81, 8.20) 5.63 (4.64, 6.58) Lung cancer incidence (females) China 4.52 (4.30, 4.74) 4.54 (4.32, 4.77) 4.49 (4.26, 4.71) 4.25 (4.02, 4.47) 3.61 (3.35, 3.81) Eastern 4.71 (4.01, 5.45) 4.73 (4.03, 5.48) 4.68 (3.98, 5.42) 4.46 (3.79, 5.17) 3.88 (3.28, 4.50) Northern 4.91 (4.18, 5.70) 4.93 (4.19, 5.72) 4.88 (4.14, 5.66) 4.69 (3.97, 5.43) 4.04 (3.40, 4.69) Northeastern 6.86 (5.58, 7.93) 6.88 (5.58, 7.95) 6.81 (5.53, 7.88) 6.52 (5.26, 7.56) 5.46 (4.31, 6.37) Northwestern 2.68 (2.28, 3.27) 2.70 (2.29, 3.30) 2.65 (2.25, 3.24) 2.47 (2.10, 3.02) 2.07 (1.76, 2.52) South–central 4.02 (3.37, 4.73) 4.03 (3.38, 4.75) 3.97 (3.33, 4.68) 3.74 (3.13, 4.41) 3.12 (2.60, 3.70) Southwestern 3.89 (3.25, 4.49) 3.92 (3.27, 4.53) 3.85 (3.22, 4.46) 3.56 (2.97, 4.12) 3.01 (2.49, 3.49) Table 1. Lifetime risks (%, 95% uncertainty interval) of developing lung cancer within selected age intervals by sex in 2023.
Region Lifetime (birth–death) Age: 40–death Age: 50–death Age: 60–death Age: 70–death Lung cancer death (total population) China 5.98 (5.57, 6.26) 6.06 (5.64, 6.35) 6.05 (5.63, 6.34) 5.84 (5.41, 6.11) 5.00 (4.60, 5.21) Eastern 6.74 (5.85, 7.51) 6.81 (5.91, 7.60) 6.81 (5.90, 7.60) 6.59 (5.70, 7.36) 5.71 (4.93, 6.36) Northern 5.93 (5.25, 6.66) 5.99 (5.30, 6.74) 5.99 (5.30, 6.75) 5.84 (5.15, 6.58) 5.10 (4.49, 5.70) Northeastern 7.42 (6.24, 8.18) 7.48 (6.28, 8.25) 7.48 (6.27, 8.26) 7.28 (6.07, 8.06) 6.28 (5.18, 7.01) Northwestern 3.87 (3.37, 4.75) 3.94 (3.43, 4.84) 3.93 (3.41, 4.84) 3.76 (3.26, 4.63) 3.18 (2.76, 3.86) South–central 5.45 (4.74, 6.19) 5.51 (4.79, 6.27) 5.50 (4.78, 6.26) 5.27 (4.57, 5.99) 4.43 (3.82, 5.01) Southwestern 5.35 (4.59, 6.06) 5.45 (4.67, 6.19) 5.44 (4.65, 6.17) 5.12 (4.39, 5.83) 4.31 (3.69, 4.89) Lung cancer death (males) China 7.61 (6.71, 8.19) 7.76 (6.83, 8.35) 7.80 (6.86, 8.40) 7.57 (6.63, 8.18) 6.47 (5.57, 6.97) Eastern 8.91 (7.21, 10.17) 9.05 (7.31, 10.36) 9.09 (7.33, 10.43) 8.87 (7.11, 10.18) 7.68 (6.09, 8.82) Northern 7.17 (5.92, 8.32) 7.29 (6.01, 8.49) 7.34 (6.03, 8.57) 7.19 (5.88, 8.43) 6.26 (5.03, 7.34) Northeastern 8.17 (5.92, 9.56) 8.27 (5.98, 9.70) 8.31 (5.99, 9.78) 8.13 (5.81, 9.65) 6.98 (4.95, 8.41) Northwestern 5.04 (4.22, 6.28) 5.16 (4.31, 6.47) 5.18 (4.32, 6.51) 5.01 (4.16, 6.30) 4.23 (3.51, 5.23) South–central 7.19 (5.84, 8.32) 7.31 (5.92, 8.49) 7.34 (5.94, 8.55) 7.10 (5.70, 8.27) 5.96 (4.73, 6.94) Southwestern 6.83 (5.49, 7.91) 7.03 (5.62, 8.18) 7.06 (5.64, 8.23) 6.70 (5.36, 7.82) 5.59 (4.49, 6.51) Lung cancer death (females) China 4.14 (3.81, 4.51) 4.17 (3.83, 4.54) 4.13 (3.80, 4.50) 3.98 (3.65, 4.34) 3.52 (3.20, 3.85) Eastern 4.30 (3.52, 5.03) 4.33 (3.53, 5.07) 4.29 (3.51, 5.03) 4.15 (3.39, 4.86) 3.73 (3.04, 4.38) Northern 4.50 (3.71, 5.30) 4.53 (3.73, 5.33) 4.50 (3.70, 5.30) 4.37 (3.59, 5.15) 3.93 (3.21, 4.63) Northeastern 6.62 (5.22, 7.82) 6.65 (5.24, 7.86) 6.61 (5.20, 7.82) 6.42 (5.02, 7.60) 5.64 (4.36, 6.75) Northwestern 2.59 (2.12, 3.25) 2.61 (2.13, 3.28) 2.58 (2.11, 3.25) 2.46 (2.01, 3.08) 2.15 (1.75, 2.71) South–central 3.48 (2.86, 4.16) 3.50 (2.88, 4.19) 3.46 (2.85, 4.14) 3.31 (2.72, 3.96) 2.90 (2.38, 3.48) Southwestern 3.61 (2.95, 4.26) 3.64 (2.97, 4.31) 3.60 (2.94, 4.27) 3.40 (2.77, 4.03) 2.99 (2.43, 3.55) Table 2. Lifetime risks (%, 95% uncertainty interval) of dying from lung cancer within selected age intervals by sex in 2023.
At the national level, the LTRs of lung cancer were higher in males [development: 8.28% (95% UI: 7.74, 8.38); death: 7.61% (95% UI: 6.71, 8.19)] than in females [development: 4.52% (95% UI: 4.30, 4.74); death: 4.14% (95% UI: 3.81, 4.51)]. Similar sex disparities were observed across all regions (Tables 1–2).
The LTR of lung cancer varies according to age and sex from birth to 95 years and above. Overall, LTR gradually declined with advancing age (Tables 1–2, Figure 1). The risk of developing lung cancer was very low from birth to age 40, resulting in nearly identical LTR estimates when measured from birth to death versus from age 40 to death [national estimates for development: 6.52% (95% UI: 6.28, 6.56) vs. 6.59% (95% UI: 6.36, 6.64); death: 5.98% (95% UI: 5.57, 6.26) vs. 6.06% (95% UI: 5.64, 6.35)]. Starting from age 70, the LTR was 5.17% (95% UI: 4.85, 5.22) for developing and 5.00% (95% UI: 4.60, 5.21) for dying from lung cancer. Sex-specific differences in LTR were also evident starting from the ages of 40, 50, 60, and 70 years (
Supplementary Figures S1–S2 ), with males consistently exhibiting a significantly higher risk of development.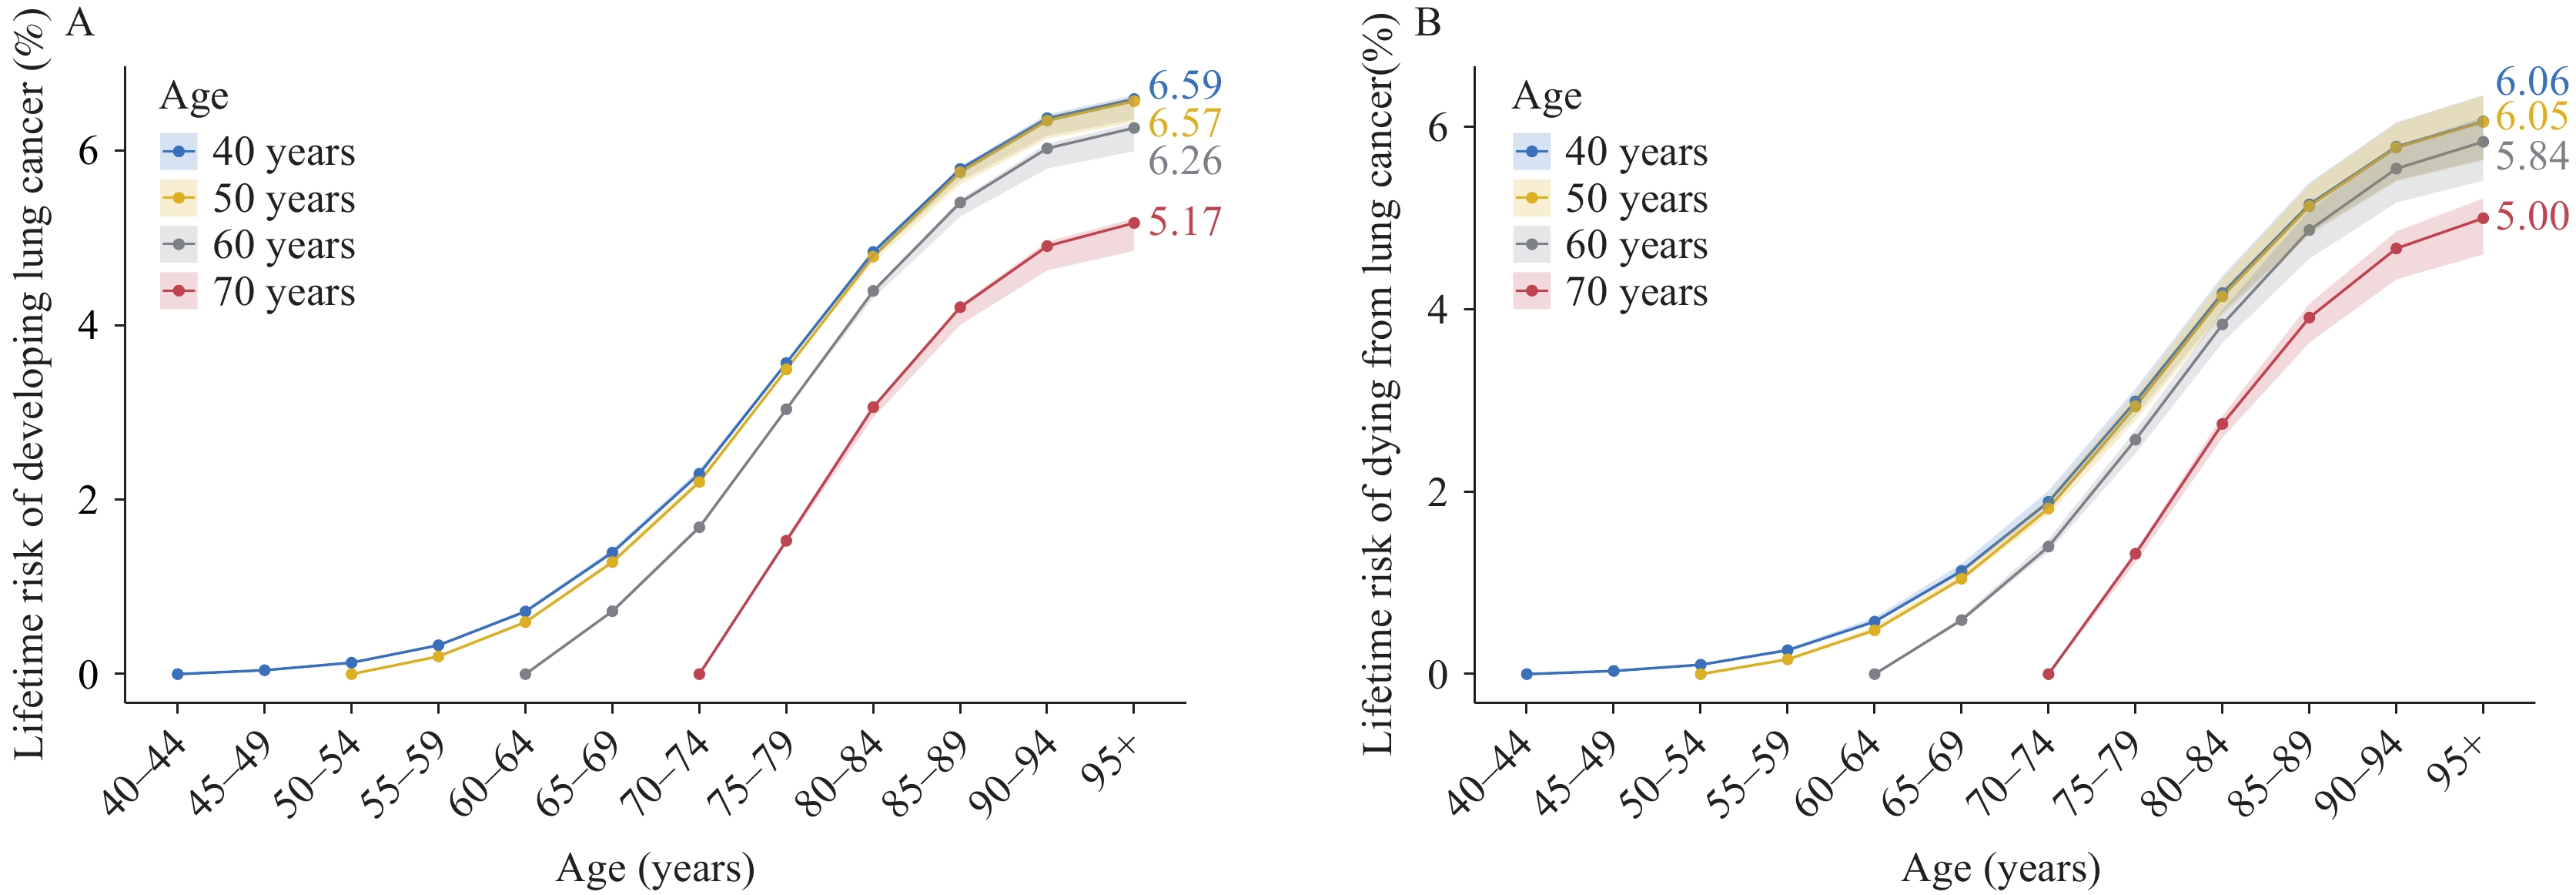 Figure 1.
Lifetime risks (%) of developing or dying from lung cancer within selected age intervals in China, 2023 (both sexes). (A) Developing lung cancer; (B) Dying from lung cancer.
To evaluate the consistency and added value of the LTR estimates, a sensitivity analysis was conducted comparing the LTR with the standard cumulative risk (0–74 years) metric (Figure 2). An approximately linear divergence was observed, where the LTR consistently exceeded the cumulative risk (0–74) in regions with a higher life expectancy. This pattern underscores the fact that the standard 0–74 metric may underestimate the disease burden in aging populations. Specifically, in 2023 (national life expectancy: 78.6 years), the cumulative risks for incidence (3.50%) and mortality (2.93%) in the 0–74 age group were significantly lower than their corresponding LTRs, confirming that extending the observation window to the full lifespan captures a substantial portion of late–life risks.
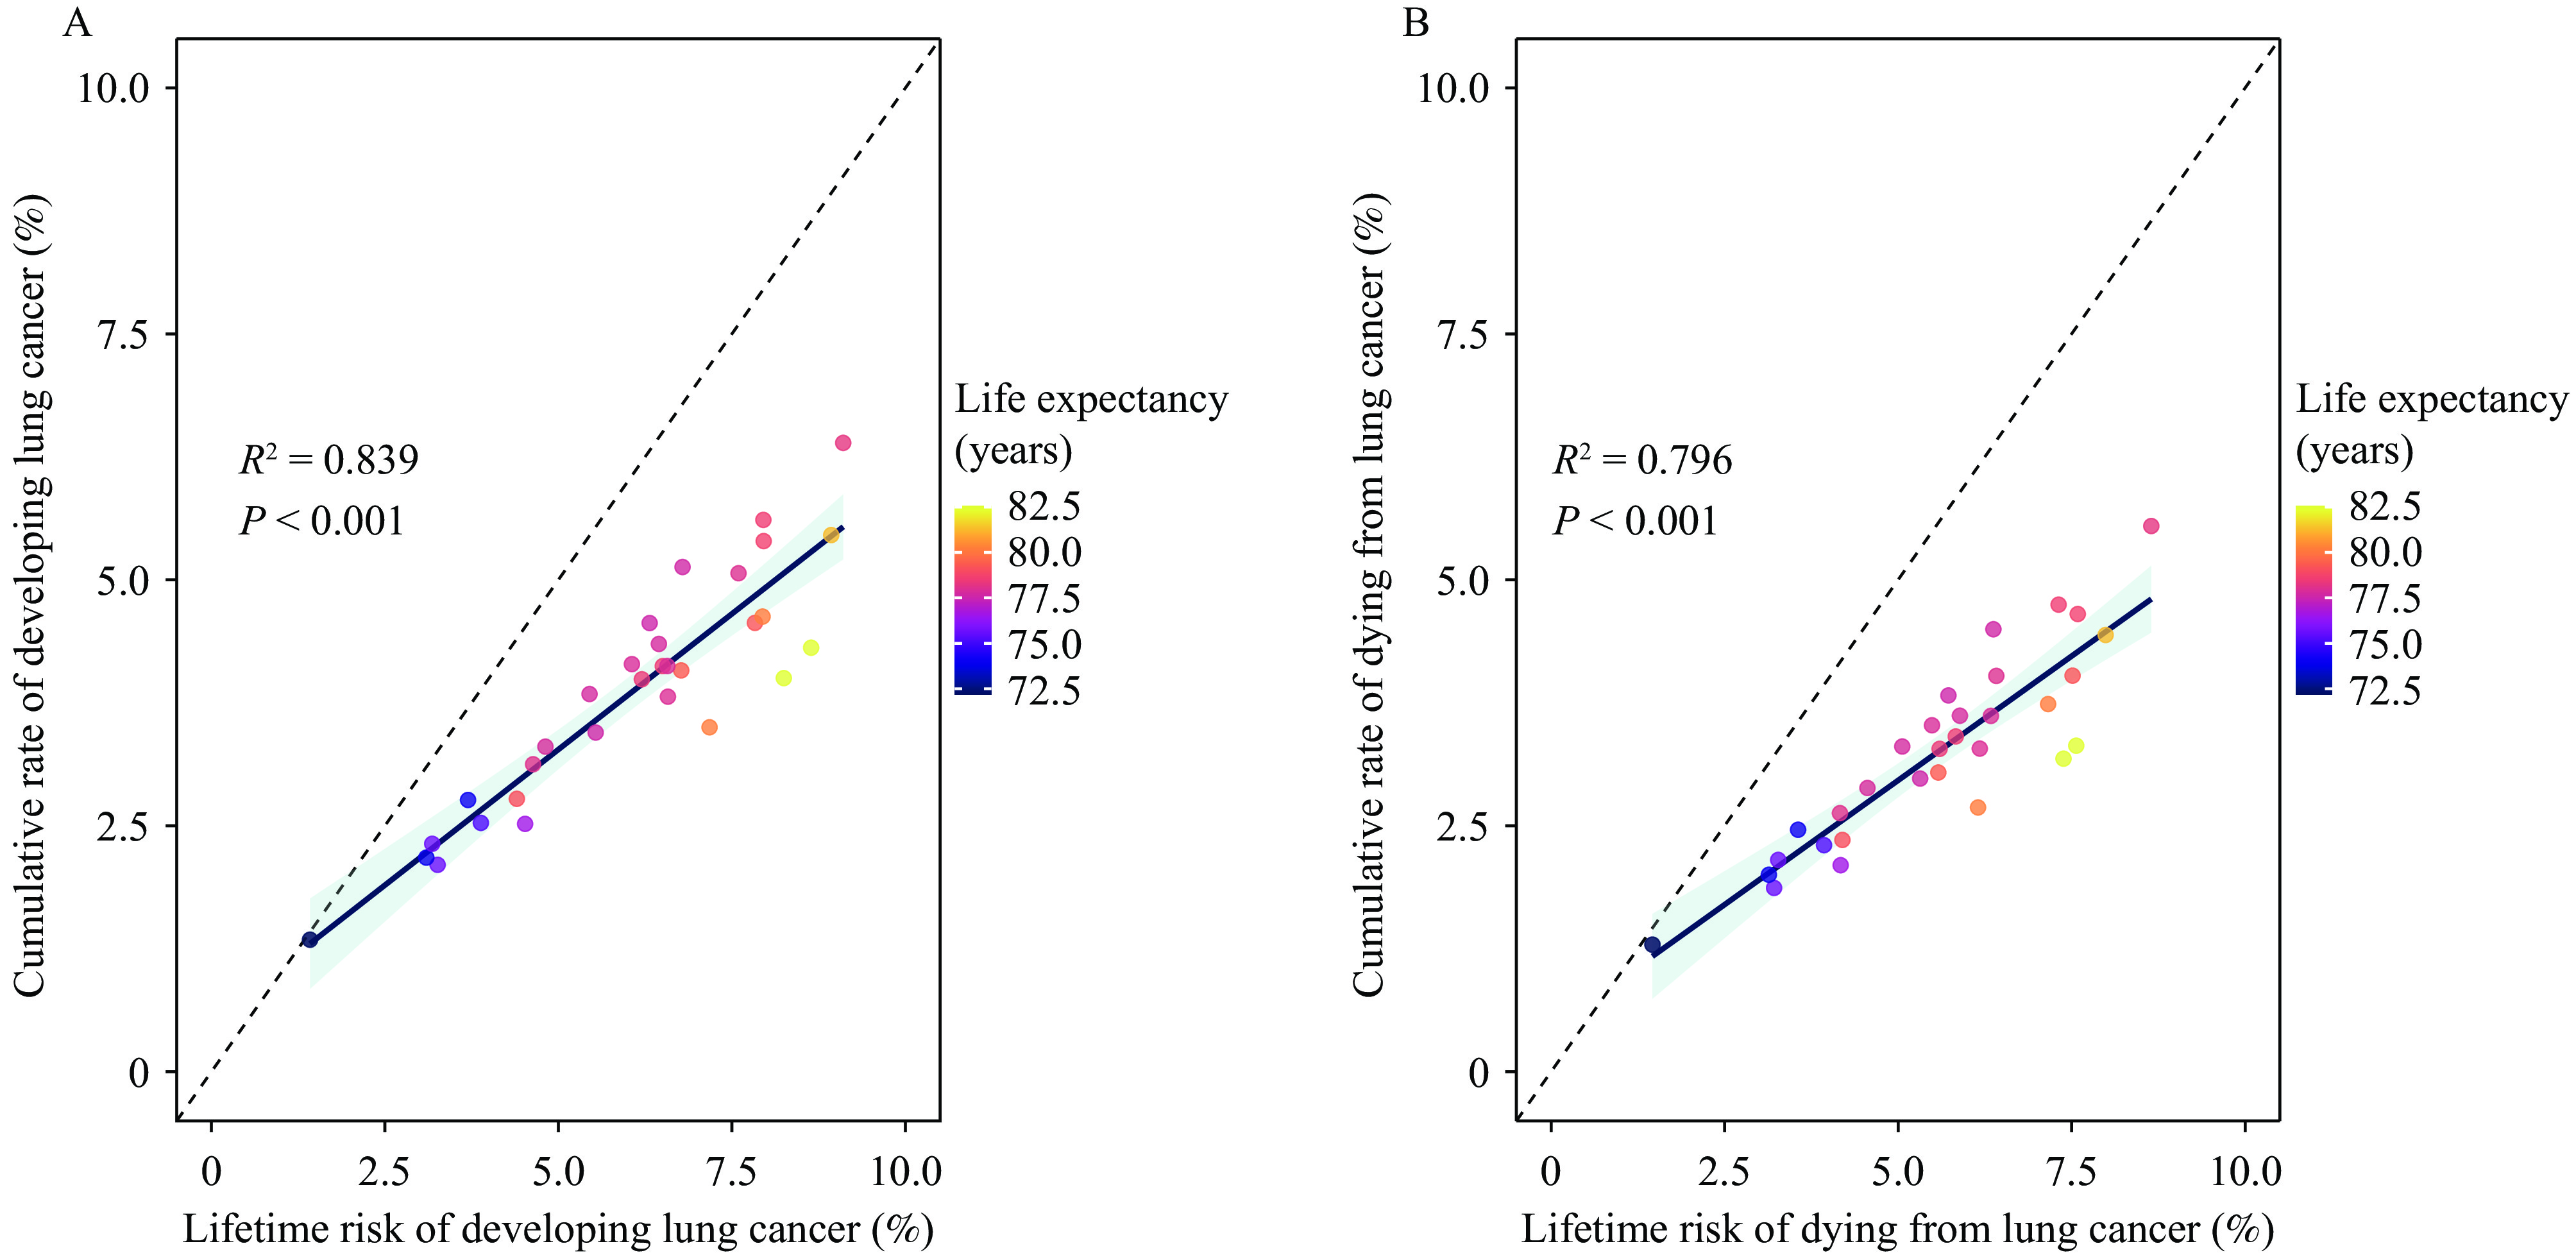 Figure 2.
Comparison between lifetime risk and cumulative risk (0–74 years) of lung cancer in China, 2023 (both sexes). (A) Lifetime risk of developing lung cancer versus cumulative incidence rate; (B) Lifetime risk of dying from lung cancer versus cumulative mortality rate.
Note: Each circle represents a province. The color gradient indicates life expectancy at birth, ranging from purple (lower life expectancy) to yellow (higher life expectancy). The solid blue curve denotes the fitted trend using linear regression, with the shaded area representing the 95% UI. R2 and P values indicate the goodness of fit and statistical significance, respectively.
Abbreviation: UI=uncertainty interval.
-
This study provides the first comprehensive estimate of the LTR of developing and dying from lung cancer at both the national and regional levels in China. In 2023, the LTR of lung cancer in the overall Chinese population corresponded to one in 15 cases of development and one in 17 deaths, with considerable geographic heterogeneity. Marked regional disparities were identified, with the highest risk in the northeastern region, followed by the eastern and northern regions, whereas the northwestern region had the lowest risk. LTR declined steadily with increasing age at diagnosis, with notable differences emerging after 40 years of age. Nationally and regionally, males consistently exhibited approximately twice the lifetime risk as females.
The calculated LTR for lung cancer was lower than the estimates reported in recent global studies based on the GLOBOCAN and World Population Prospects data (5,8–9), despite employing an identical calculation methodology. This discrepancy is primarily attributable to the heterogeneity of the data sources. GLOBOCAN estimates, largely derived from cancer registries in regions with well–established diagnostic accessibility, tend to capture higher detection rates characteristic of developed areas. In contrast, this study employed GBD 2023, which uses modeling to account for broader regional variations, potentially yielding a more conservative national baseline.
Substantial regional variations in LTR were observed, with consistently higher risks in the northeastern, eastern, and northern regions. This pattern is likely driven by the combined effects of increased life expectancy in developed regions and higher exposure to risk factors, including tobacco use (notably in the northeastern China) and air pollution (10–11). Conversely, lower risks in the southwestern and northwestern regions may be attributed to higher competing mortality from non-cancer causes and potential underdiagnosis due to limited access to healthcare. These findings underscore the need for regionally tailored policy interventions. In high-risk areas, priorities should include strengthening early screening programs such as low-dose CT scans. In lower-risk regions, efforts should focus on controlling traditional risk factors. It is also critical to address gaps in the healthcare infrastructure through policies that promote medical alliances and telemedicine, thereby enhancing primary care capacity.
Overall, the ratio of the LTR of death to the development of lung cancer in China was 0.92, with similar ratios observed in most regions. This pattern may be partly attributed to the limited availability and uptake of early screening methods for lung cancer. As many individuals do not undergo regular screening, it is difficult to detect the disease at an early stage. These high ratios highlight the need for public health policies that prioritize the development and dissemination of early diagnostic technologies and address therapeutic bottlenecks (12–13).
It was observed that the LTR of lung cancer was consistently higher in males than in females, by approximately two-fold, both nationally and across all regions. This disparity is likely directly related to historically higher smoking rates among males, combined with biological differences, differential exposure to behavioral risk factors, and variations in health awareness (14–15). These findings offer a clear direction for improving the precision of public health interventions. Estimates of age-conditional probabilities provide further insights into prevention and control. The relatively low lifetime risk of lung cancer before the age of 40 in the Chinese population suggests that cancer screening in younger adults may have limited cost-effectiveness. These age-specific risk estimates also provide evidence for defining appropriate target ages and intervals when designing lung cancer screening programs.
This study had several limitations. First, the LTR calculated using the AMP is typically based on historical registration data and may not be able to predict future risk trends. Second, the distribution of certain key risk factors, which could help further explain regional disparities, was not incorporated. Finally, the ratio of lifetime mortality to the incidence risk in this study was higher than that in registry-based reports. This likely reflects the GBD’s comprehensive coverage of under-registered regions with poorer prognoses, unlike urban-focused registries. Thus, these results represent the aggregate population burden rather than the clinical survival rates.
In conclusion, this study provides a comprehensive quantification of the LTR of lung cancer in China, offering valuable evidence for health system planning and targeted prevention strategies across different regions.
-
Gratefully acknowledge access to and use of the GBD database provided by the Institute for Health Metrics and Evaluation and the Chinese Center for Disease Control and Prevention & Chinese Academy of Preventive Medicine.
HTML
Cumulative Risk
The “AMP” Method
| Citation: |

|