
 Download:


-
Introduction: Diarrhea and constipation are prevalent gastrointestinal conditions among older adults. This study examined the prevalence and demographic distribution of diarrhea and constipation among older adults in China for the development of targeted prevention strategies.
Methods: This study utilized data from the 2024 China Survey of Aging and Health (CAHS) covering 31 provincial-level administrative divisions (PLADs) and 41,859 older adults aged ≥65 years were included. Weighted prevalence estimates with 95% confidence intervals (CIs) were calculated. The Rao-Scott chi-square test was used to compare differences in prevalence across demographic subgroups.
Results: In 2024, the weighted prevalence of diarrhea and constipation among older adults in China was 14.2% (95% CI: 12.1, 16.6) and 16.4% (95% CI: 14.2, 18.9), respectively. The prevalence of diarrhea (16.8%) and constipation (20.8%) were the highest in western China. Constipation prevalence showed a significant increasing trend with age (P<0.001), reaching 24.9% among adults aged ≥80 years, whereas no such age-related pattern was observed for diarrhea.
Conclusions: The burden of diarrhea and constipation in the older Chinese population is substantial. Prevention and management strategies should prioritize high-risk populations, particularly the oldest-old and residents of the western regions.
-
Gastrointestinal disorders, particularly diarrhea and constipation, are significant health concerns in older adults worldwide (1). These conditions can substantially impair quality of life, increase healthcare utilization, and lead to serious complications, including dehydration, malnutrition, and fecal impaction. With China’s rapidly aging population, understanding the epidemiological characteristics of these conditions has become increasingly important for public health planning.
Diarrhea in older adults may result from infections, medications, dietary factors, or underlying diseases, whereas constipation is often associated with reduced physical activity, inadequate fiber intake, medication side effects, and age-related physiological changes (2-3). Both these conditions can significantly affect the health and well-being of older adults. This study utilized data from the 2024 China Survey of Aging and Health (CAHS) to examine the prevalence and demographic distribution of diarrhea and constipation among adults aged ≥65 years throughout China, providing evidence for targeted prevention and intervention strategies.
The CAHS uses a multistage stratified cluster sampling design across 31 provincial-level administrative divisions (PLADs) in China. Probability proportional-to-size sampling was used to ensure national and provincial representativeness. The sampling framework comprised three sequential stages. First, the required sample size for each PLAD was calculated based on the standardized age distribution and sex ratio of the older population. Second, two to three representative survey cities were selected from each PLAD based on prefecture-level city gross domestic product rankings. Third, each prefecture-level city contributed to a minimum of two districts or counties, representing medium development levels. The CAHS successfully recruited 42,507 individuals aged ≥65 years. After excluding 648 participants with missing information on diarrhea and constipation status, 41,859 valid samples were included in the final analysis. A detailed description of the CAHS sampling design and methodology has been published previously (4).
Diarrhea and constipation status were assessed through face-to-face interviews conducted by trained interviewers, consistent with methodological approaches used in previous epidemiological studies on gastrointestinal disorders in older adults (5–6). Participants were defined as having diarrhea if they reported having been diagnosed with diarrhea by a medical institution within the past year or having self-reported core diarrhea symptoms (increased frequency of defecation, loose or watery stool consistency, or urgency to defecate). Similarly, participants were defined as having constipation if they reported being diagnosed with constipation by a medical institution within the past year or reported core constipation symptoms (such as reduced frequency of defecation, dry and hard stool consistency, straining during defecation, or feeling of incomplete evacuation). Data on age, sex, education, and household income were collected using standardized questionnaires. BMI was calculated from objectively measured height and weight. Current smoking status and alcohol consumption were defined as binary variables (yes/no, including former users).
Statistical analyses included sampling design, non-response adjustment, and post-stratification correction weights to ensure population representativeness. We computed weighted prevalence estimates with 95% confidence intervals (CIs) using survey-weighted methods and evaluated subgroup disparities through Rao-Scott χ2 tests. All analyses were conducted using R software (version 4.4.2, R Foundation for Statistical Computing, Vienna, Austria). Statistical significance was set at two-sided P<0.05.
In 2024, the weighted prevalence of diarrhea and constipation among older adults aged ≥65 years in China was 14.2% (95% CI: 12.1, 16.6) and 16.4% (95% CI: 14.2, 18.9), respectively (Tables 1–2). The prevalence of diarrhea was highest in western China (16.8%), while that of constipation was highest in western China (20.8%) and central China (19.4%). No significant differences were observed in the prevalence of diarrhea according to sex, age group, residence, education level, BMI, or household income (all P>0.05). However, constipation prevalence significantly increased with age (P<0.001), from 11.8% in the 65–69 years age group to 24.9% in adults aged ≥80 years. Constipation prevalence also varied significantly by region (P=0.010).
Characteristics Sample size N (%) Diarrhea n (%) Weighted prevalence (95% CI) χ2 P Total 41,859 (100.00) 4,816 (11.51) 14.24 (12.14, 16.64) Region 0.931 0.422 Eastern region 16,795 (40.12) 1,473 (8.77) 13.63 (10.18, 18.01) Central region 11,462 (27.38) 1,340 (11.69) 13.93 (10.69, 17.95) Western region 10,115 (24.16) 1,598 (15.80) 16.84 (12.59, 22.15) Northeastern region 3,487 (8.33) 405 (11.61) 10.63 (6.38, 17.20) Sex 0.117 0.733 Male 19,893 (47.52) 2,422 (12.18) 14.64 (11.64, 18.27) Female 21,966 (52.48) 2,394 (10.90) 13.90 (11.24, 17.07) Age group (years) 1.459 0.227 65–69 12,518 (29.91) 1,337 (10.68) 12.39 (9.19, 16.51) 70–74 12,794 (30.56) 1,413 (11.05) 16.75 (12.45, 22.16) 75–79 8,001 (19.11) 938 (11.72) 11.75 (9.02, 15.17) ≥80 8,546 (20.42) 1,128 (13.20) 15.49 (11.65, 20.30) Residence 2.451 0.118 Urban 25,553 (61.05) 2,680 (10.49) 12.81 (10.51, 15.53) Rural 16,306 (38.95) 2,136 (13.10) 16.57 (12.76, 21.24) Education 0.192 0.824 Primary school and below 22,475 (53.69) 2,796 (12.44) 14.38 (11.57, 17.74) Junior high school 10,402 (24.85) 1,164 (11.19) 15.06 (11.17, 19.99) Senior high school and above 8,982 (21.46) 856 (9.53) 13.22 (9.63, 17.89) BMI (kg/m2) 0.474 0.673 <18.5 1,920 (4.59) 206 (10.73) 15.74 (9.21, 25.60) 18.5–24.9 27,769 (66.34) 3,295 (11.87) 13.84 (11.42, 16.67) 25.0–29.9 10,765 (25.72) 1,169 (10.86) 14.10 (10.33, 18.95) ≥30 1,405 (3.36) 146 (10.40) 21.61 (8.27, 45.75) Monthly household income (CNY) 0.472 0.752 Q1 (<3,000) 11,437 (27.32) 1,273 (11.13) 14.00 (9.91, 19.43) Q2 (≥3,000 and <6,000) 11,468 (27.40) 1,461 (12.74) 12.46 (9.29, 16.52) Q3 (≥6,000 and <10,000) 7,989 (19.09) 781 (9.78) 14.65 (10.66, 19.79) Q4 (≥10,000) 4,703 (11.24) 566 (12.05) 17.16 (11.83, 24.23) Unwilling to disclose 6,262 (14.96) 735 (11.74) 14.24 (8.91, 21.98) Smoking 1.274 0.259 Yes 4,083 (9.75) 549 (13.45) 18.67 (11.06, 29.77) No 37,776 (90.20) 4,267 (11.30) 13.79 (11.71, 16.16) Alcohol consumption 3.729 0.054 Yes 3,007 (7.18) 477 (15.86) 22.04 (13.75, 33.38) No 38,852 (92.82) 4,339 (11.17) 13.70 (11.60, 16.11) Abbreviation: CI=confidence interval; CNY=Chinese Yuan. Table 1. Characteristics of participants and prevalence of diarrhea among adults aged 65 years and older in China, 2024.
Characteristics Sample size N (%) Constipation n (%) Weighted prevalence (95% CI) χ2 P Total 41,859 (100.00) 6,617 (15.81) 16.4 (14.21, 18.85) Region 3.917 0.010 Eastern region 16,795 (40.12) 2,105 (12.54) 12.45 (9.40, 16.33) Central region 11,462 (27.38) 2,141 (18.68) 19.41 (15.14, 24.54) Western region 10,115 (24.16) 1,731 (17.11) 20.75 (16.11, 26.31) Northeastern region 3,487 (8.33) 640 (18.35) 13.38 (9.06, 19.31) Sex 0.027 0.871 Male 19,893 (47.52) 3,253 (16.35) 16.2 (13.16, 19.78) Female 21,966 (52.48) 3,364 (15.32) 16.57 (13.67, 19.95) Age group (years) 6.149 <0.001 65–69 12,518 (29.91) 1,597 (12.76) 11.75 (8.46, 16.09) 70–74 12,794 (30.56) 1,781 (13.92) 15.18 (11.39, 19.95) 75–79 8,001 (19.11) 1,406 (17.57) 16.50 (12.69, 21.17) ≥80 8,546 (20.42) 1,833 (21.45) 24.89 (19.61, 31.05) Residence 0.050 0.824 Urban 25,553 (61.05) 3,981 (15.58) 16.19 (13.53, 19.27) Rural 16,306 (38.95) 2,636 (16.17) 16.73 (13.23, 20.93) Education 1.670 0.189 Primary school and below 22,475 (53.69) 3,782 (16.83) 15.81 (12.98, 19.12) Junior high school 10,402 (24.85) 1,591 (15.30) 20.07 (15.52, 25.55) Senior high school and above 8,982 (21.46) 1,244 (13.85) 14.23 (10.30, 19.34) BMI (kg/m2) 0.539 0.645 <18.5 1,920 (4.59) 304 (15.84) 17.35 (10.65, 26.99) 18.5–24.9 27,769 (66.34) 4,329 (15.59) 15.73 (13.11, 18.77) 25.0–29.9 10,765 (25.72) 1,718 (15.96) 17.09 (13.03, 22.10) ≥30 1,405 (3.36) 266 (18.95) 22.49 (13.10, 35.83) Monthly household income (CNY) 1.278 0.278 Q1 (<3,000) 11,437 (27.32) 1,721 (15.05) 16.63 (12.65, 21.55) Q2 (≥3,000 and <6,000) 11,468 (27.40) 1,805 (15.74) 16.97 (13.07, 21.74) Q3 (≥6,000 and <10,000) 7,989 (19.09) 1,209 (15.14) 13.16 (9.85, 17.36) Q4 (≥10,000) 4,703 (11.24) 759 (16.15) 14.38 (10.39, 19.57) Unwilling to disclose 6,262 (14.96) 1,123 (17.93) 22.21 (14.12, 33.14) Smoking 0.555 0.457 Yes 4,083 (9.75) 758 (18.56) 19.43 (11.81, 30.28) No 37,776 (90.25) 5,859 (15.51) 16.08 (13.89, 18.55) Alcohol consumption 0.805 0.370 Yes 3,007 (7.18) 565 (18.79) 13.82 (9.35, 19.97) No 38,852 (92.82) 6,052 (15.58) 16.58 (14.28, 19.17) Abbreviation: CI=confidence interval. Table 2. Characteristics of participants and prevalence of constipation among adults aged 65 years and older in China, 2024.
The age-stratified analysis by sex and residence revealed distinct patterns. For diarrhea, no significant age-related trends were observed across subgroups (all P>0.05). For constipation, significant age-related increases were observed in the total population (P<0.001), males (P=0.018), females (P=0.003), and urban residents (P<0.001), but not in rural residents (P=0.303) (Figure 1).
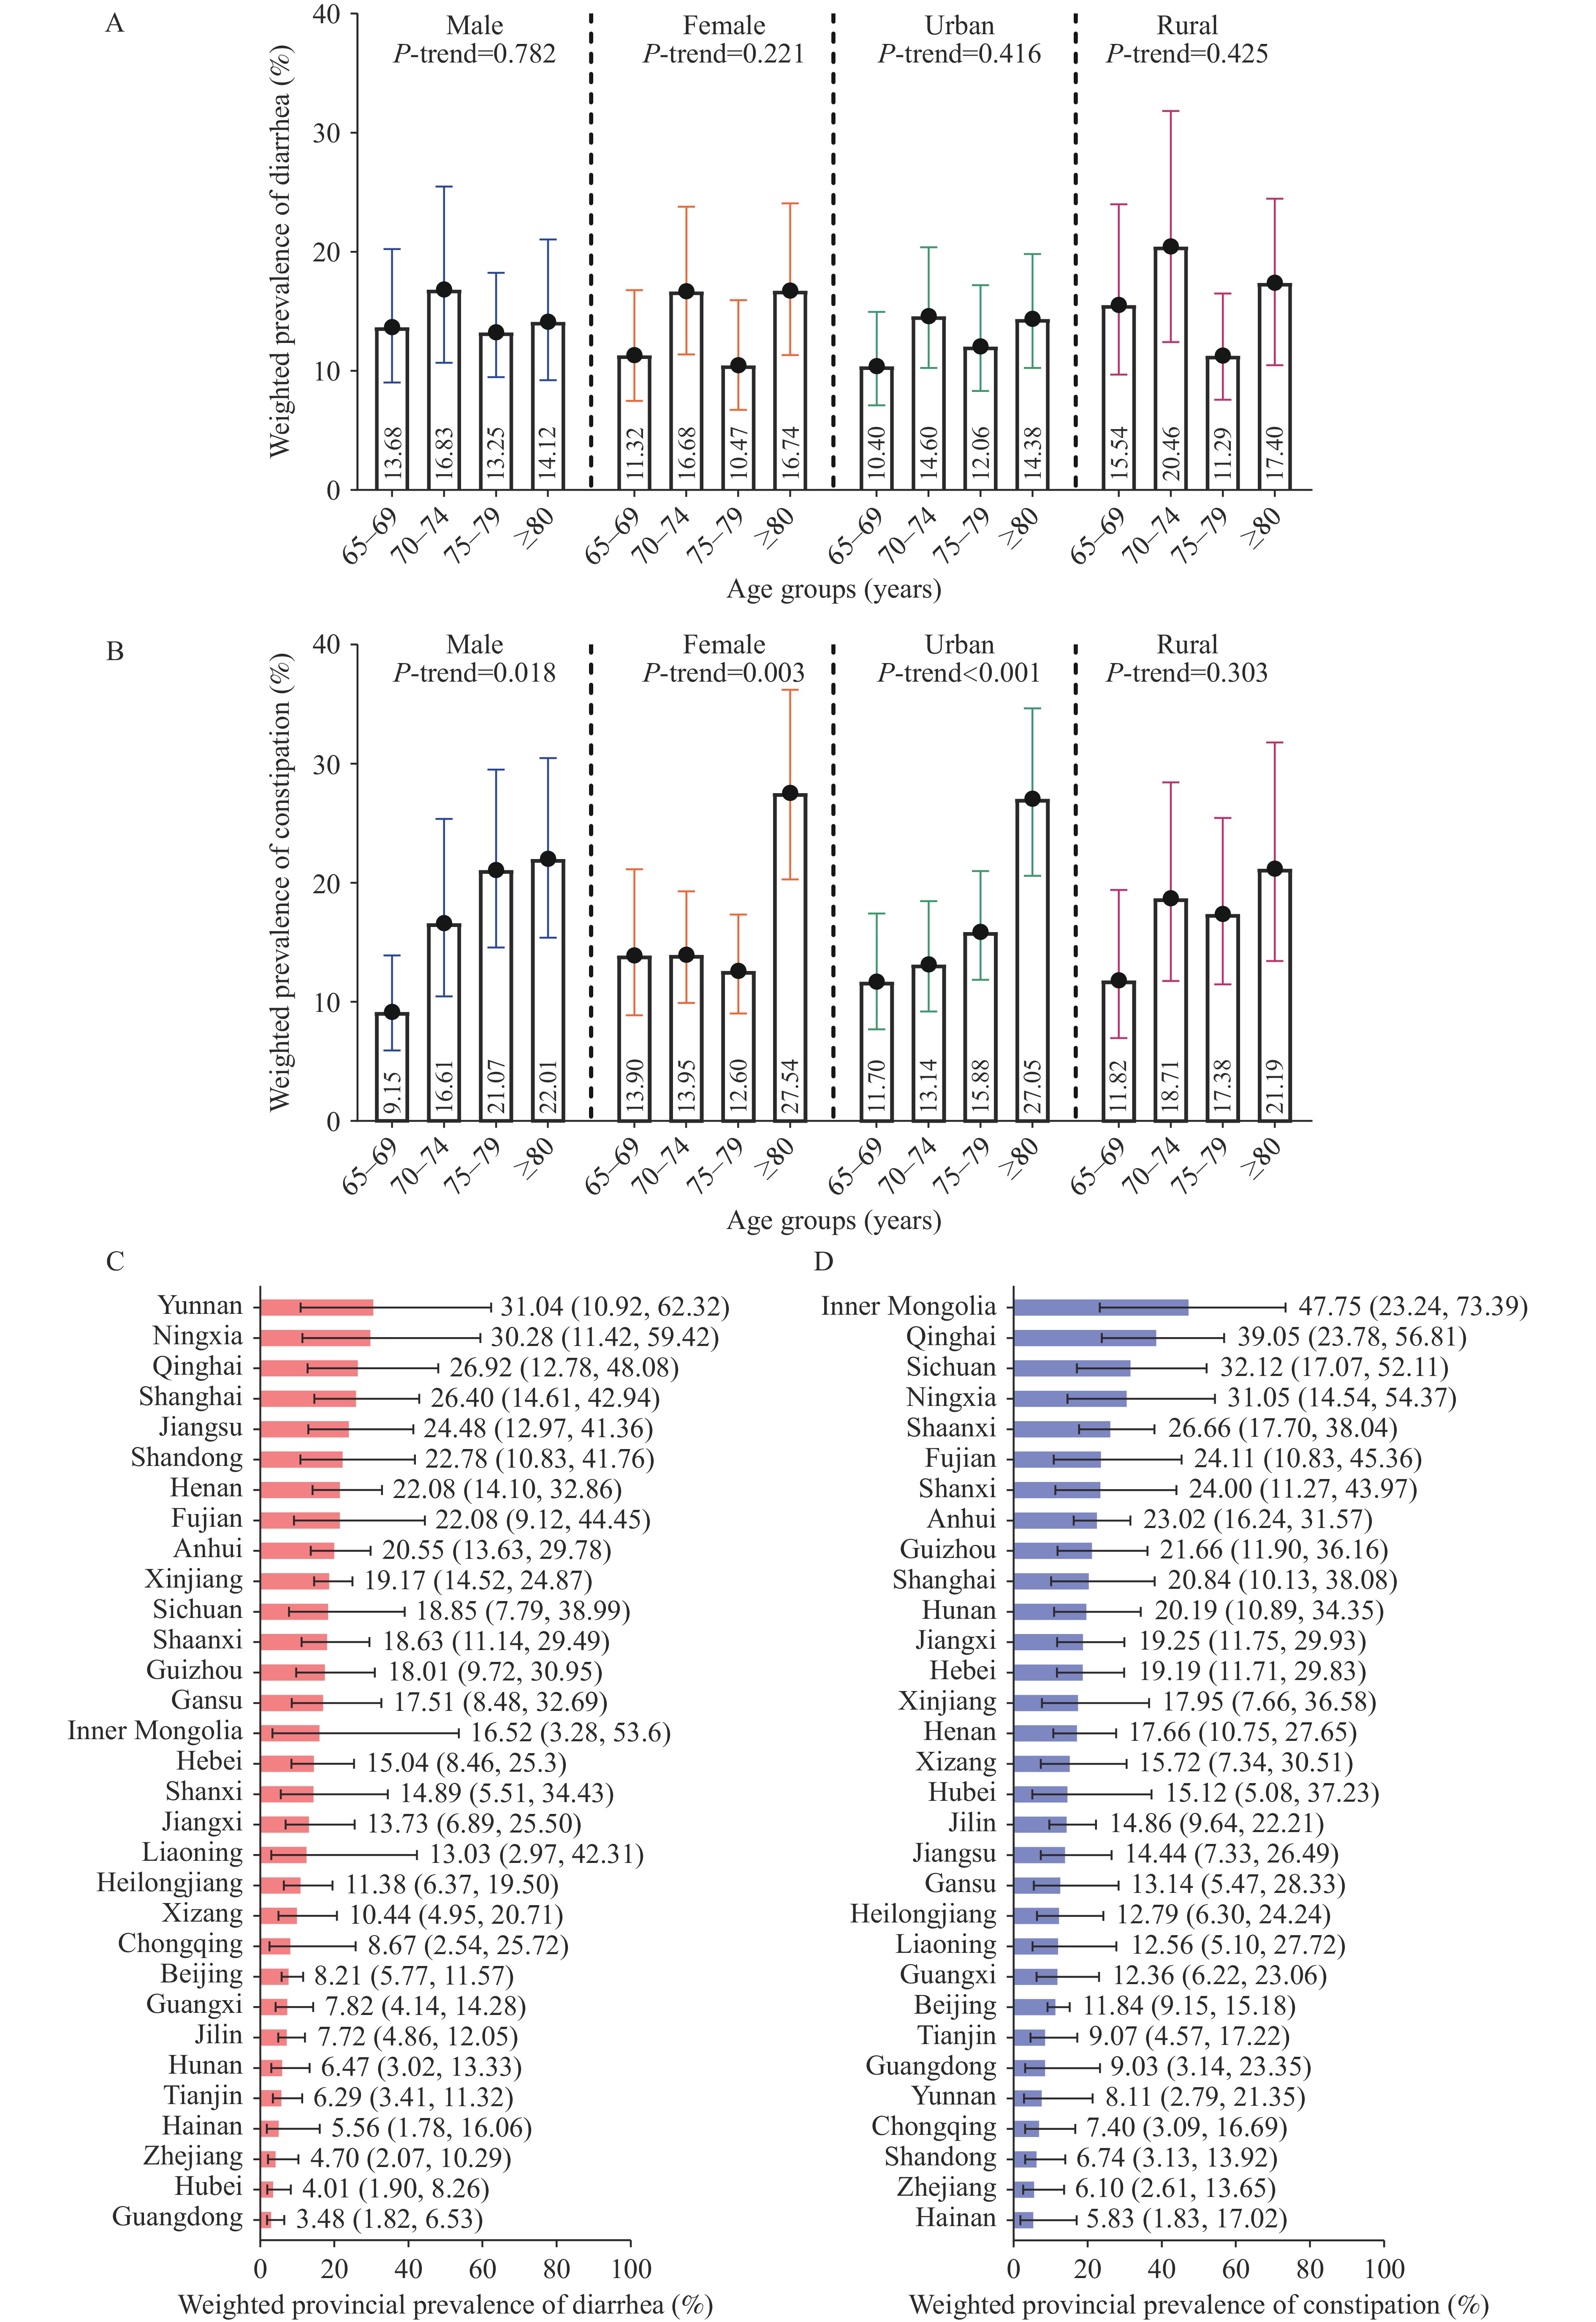 Figure 1.
Age-stratified and provincial weighted prevalence of diarrhea and constipation among adults aged 65 years and older in China, 2024. (A) Prevalence of diarrhea by sex and residence; (B) Prevalence of constipation by sex and residence; (C) Prevalence of diarrhea; (D) Prevalence of constipation.
Provincial-level analysis revealed substantial geographic variation. For diarrhea, prevalence ranged from 3.5% in Guangdong to 31.0% in Yunnan. For constipation, prevalence ranged from 5.8% in Hainan to 47.7% in Inner Mongolia. Notable high-prevalence provinces for diarrhea included Yunnan (31.0%), Ningxia (30.3%), Qinghai (26.9%), Shanghai (26.4%), and Jiangsu (24.5%). For constipation, high-prevalence provinces included Inner Mongolia (47.7%), Qinghai (39.1%), Sichuan (32.1%), and Ningxia (31.0%) (Figure 1).
-
This study found that the weighted prevalence of diarrhea and constipation among older adults aged ≥65 years in China in 2024 was 14.2% and 16.4%, respectively. These findings indicate that gastrointestinal disorders represent a substantial public health burden among China’s aging population.
The observed prevalence rates are consistent with the global literature on gastrointestinal disorders in older adults. Previous studies have reported constipation prevalence ranging from 10% to 40% among older populations, depending on the definition used and the population studied (1,7). A multicenter study in four cities of China reported a constipation prevalence of 17.60% among older people aged ≥65 years, which is comparable to our findings (1).
Regional variations in prevalence were also notable. The highest prevalence of both diarrhea and constipation was observed in western China, which may reflect differences in dietary habits, access to healthcare, environmental factors, and socioeconomic development. Previous research has indicated that the prevalence of constipation in northern areas is significantly higher than that in southern areas, which may be attributed to different dietary habits (8). Inner Mongolia exhibited the highest constipation prevalence, possibly because of dietary patterns, climate conditions, and limited access to fresh vegetables and fruits.
The significant age-related increase in constipation prevalence, from 11.8% in the 65–69 years group to 24.9% in those aged ≥80 years, aligns with known physiological changes associated with aging, including decreased gastrointestinal motility, reduced physical activity, increased medication use, and changes in dietary patterns (9). Previous studies using CLHLS data have also demonstrated that functional impairment rates among individuals aged 85 and above are significantly higher, particularly among females and older populations residing in rural areas (9). These findings underscore the importance of targeted interventions for constipation among the oldest-old population. In contrast, diarrhea showed no significant age-related trend, with its prevalence fluctuating slightly across age groups rather than rising consistently. Unlike constipation’s cumulative burden from reduced gut motility and inactivity, diarrhea triggers are episodic, aging-unrelated, and often linked to unhealthy lifestyle factors, such as poor dietary choices, explaining the lack of age-associated prevalence accumulation (10).
The findings in this report are subject to at least four limitations. First, the cross-sectional design captured disease status at a single time point, preventing the examination of temporal trends or causal relationships. Second, the reliance on self-reported measures introduces potential recall bias. Third, this study only reported the overall prevalence of diarrhea. Limited by the questionnaire, infectious and non-infectious diarrhea were not stratified, which requires further exploration with more detailed diagnostic information. Finally, potential influencing factors, such as medication use, dietary habits, and physical activity levels, were not included in this analysis. Future studies are warranted to explore the independent and interactive effects of these factors on diarrhea and constipation, particularly on the age-related mechanisms of functional constipation.
In conclusion, diarrhea and constipation are significant health burdens in China’s older population, with notable regional and demographic variations. Prevention and management strategies should prioritize high-risk populations, particularly the oldest-old and residents of the western regions.
-
All research personnel who contributed to the data collection efforts and all study participants whose involvement made this investigation possible.
-
The CAHS protocol was approved by the Ethics Committee of Beijing Hospital (approval number: 2021BJYEC-359-02).
HTML
| Citation: |

|