
 Download:


-
Introduction: Extreme heat poses an increasing threat to public health. This study evaluates the county-level heat vulnerability across China in 2020.
Methods: A comprehensive county-level assessment of heat vulnerability was conducted across China using the 2020 data encompassing socioeconomic, demographic, environmental, and infrastructure-related indicators. The Boruta machine-learning algorithm was applied to objectively identify indicators associated with the proportion of non-accidental deaths on extreme-heat days. A heat-vulnerability index (HVI) was constructed using principal component analysis and validated using linear regression against the proportion of non-accidental deaths on extreme-heat days.
Results: Ten key indicators were integrated into a county-level HVI representing national heat-vulnerability patterns in 2020. The HVI demonstrated a significant positive correlation with the proportion of non-accidental deaths on extreme-heat days (P<0.05). Spatial analysis revealed that high-vulnerability counties were primarily concentrated in Southwestern China, whereas low-vulnerability areas were mainly located in South China and the eastern coastal regions.
Conclusion: This study delivers an accurate and up-to-date representation of current vulnerability patterns by providing an updated and refined county-level assessment for 2020, supporting evidence-based public-health planning, efficient resource allocation, and climate-adaptation strategies to mitigate the impact of extreme heat.
-
Extreme-heat exposure has been consistently associated with increased morbidity and mortality (1). Considering the substantial regional and population heterogeneity of heat-related impacts, assessing vulnerability and identifying vulnerable regions are essential for climate-change adaptation (2). The multi-indicator heat-vulnerability index (HVI) is widely used for such assessments and is developed in three steps: vulnerability-indicator selection, assigning of indicator weights, and composite-index calculation (3–4). However, most existing studies select indicators based on a literature review or expert judgment, which introduces subjectivity and lacks quantitative validation. This may lead to the inclusion of weakly related indicators and omission of key determinants, thereby compromising the accuracy and reliability of the HVI. In China, the current heat-vulnerability assessments share these limitations, and county-level evaluations remain scarce. The only national county-level study reflects the conditions in 2010 and no longer represents the current spatial distribution of heat vulnerability. Therefore, this study applies a machine-learning approach for objective indicator screening, and uses the most recently available data to construct a county-level HVI for China for 2020. This can be used to identify highly vulnerable regions and inform targeted public health and climate-adaptation strategies. The year 2020 was selected because the Seventh National Population Census provides the most comprehensive and up-to-date county-level demographic data required for the vulnerability assessment.
Following the framework of the Intergovernmental Panel on Climate Change, heat vulnerability was assessed across two dimensions: sensitivity and adaptive capacity (5). The methodology applied in this study included the following steps: indicator screening using the Boruta algorithm, HVI calculation using principal component analysis (PCA), and HVI validation.
This study first compiled demographic, socioeconomic, and land-use variables for 2,844 counties nationwide (including urban districts, county-level cities, counties, and autonomous counties) and then extracted 323 counties with complete daily non-accidental death data and daily maximum-temperature records. Data from these 323 counties were used to screen for HVI indicators to ensure that they were objective and strongly associated with the proportion of nonaccidental deaths on extreme-heat days. Boruta analysis was conducted using indicators from these counties as input variables and the proportion of non-accidental deaths on extreme-heat days as the outcome. The proportion is defined as the number of non-accidental deaths on extreme-heat days divided by the total number of non-accidental deaths during the warm season (May–October). Extreme-heat days were defined as days on which the daily maximum temperature exceeded the 95th percentile of the county-specific historical maximum-temperature distribution during the warm season from 2013 to 2018. Boruta, a feature-selection algorithm based on random forests, constructs randomly permuted “shadow features” and compares their importance with that of the original variables. Through iterative statistical testing, Boruta identifies all features that exhibit a significant association with the outcome, thereby reducing the subjectivity in the indicator selection. Notably, the 323 counties used for indicator screening and vulnerability validation span all seven major geographical regions of China, covering diverse climatic and socioeconomic contexts. The selected indicators were applied uniformly to 2,844 county-level units to construct the national HVI. The HVI construction involved three main steps: indicator normalization, dimensionality reduction, and composite-index calculation. First, all retained indicators were normalized to remove the influence of different units. Second, PCA was conducted to address the multicollinearity among the variables and reduce redundancy across the indicator categories. The proportion of total variance explained by each principal component (PC) was obtained from the PCA output. PC scores were classified into six ordered categories (1–6) based on standard deviation (SD) intervals from the mean to enhance interpretability and mitigate the influence of extreme values: ≥2 SD below the mean, 1–2 SD below the mean (includes 1 SD below, excludes 2 SD below), 0–1 SD below the mean [includes the mean (0 SD), excludes 1 SD below], 0–1 SD above the mean [excludes the mean (0 SD), includes 1 SD above], 1–2 SD above the mean (excludes 1 SD above, includes 2 SD above), and >2 SD above the mean. Owing to the lack of clear empirical evidence on the relative influence of each PC on heat vulnerability, and to avoid subjective bias while ensuring simplicity and reproducibility in index construction, equal weights were assigned to all retained PCs, and their scores were summed to generate the HVI for each county (6). Finally, linear regression was performed to evaluate the HVI reliability using the proportion of non-accidental deaths on extreme-heat days as the dependent variable and HVI as the independent variable. Demographic data were obtained from the China Population Census Yearbook 2020; gross domestic product (GDP) data were sourced from the 2021 China County Statistical Yearbook and statistical bulletins of districts; air conditioning (AC) was estimated using provincial-level data adjusted by urban–rural population composition (
Supplementary Material ); and land-use data were derived from the Geo-Simulation and Optimization System platform (Supplementary Table S1 ) (7). Daily non-accidental deaths were provided by the China CDC, and daily maximum-temperature data were obtained from the European Centre for Medium-Range Weather Forecasts (ECMWF) (Supplementary Table S2 ). All data processing and analyses were performed using R software (version 4.4.1; R Core Team, Vienna, Austria) and ArcGIS (version 10.8; Esri, Redlands, CA, USA).As shown in Figure 1, we identified 10 key indicators that were significantly associated with the proportion of non-accidental deaths on extreme-heat days. These included AC, population density, aged ≥65 years and ≤5 years, illiteracy ratio, proportion of education below senior high school, GDP, and proportions of urban, water, and grassland areas.
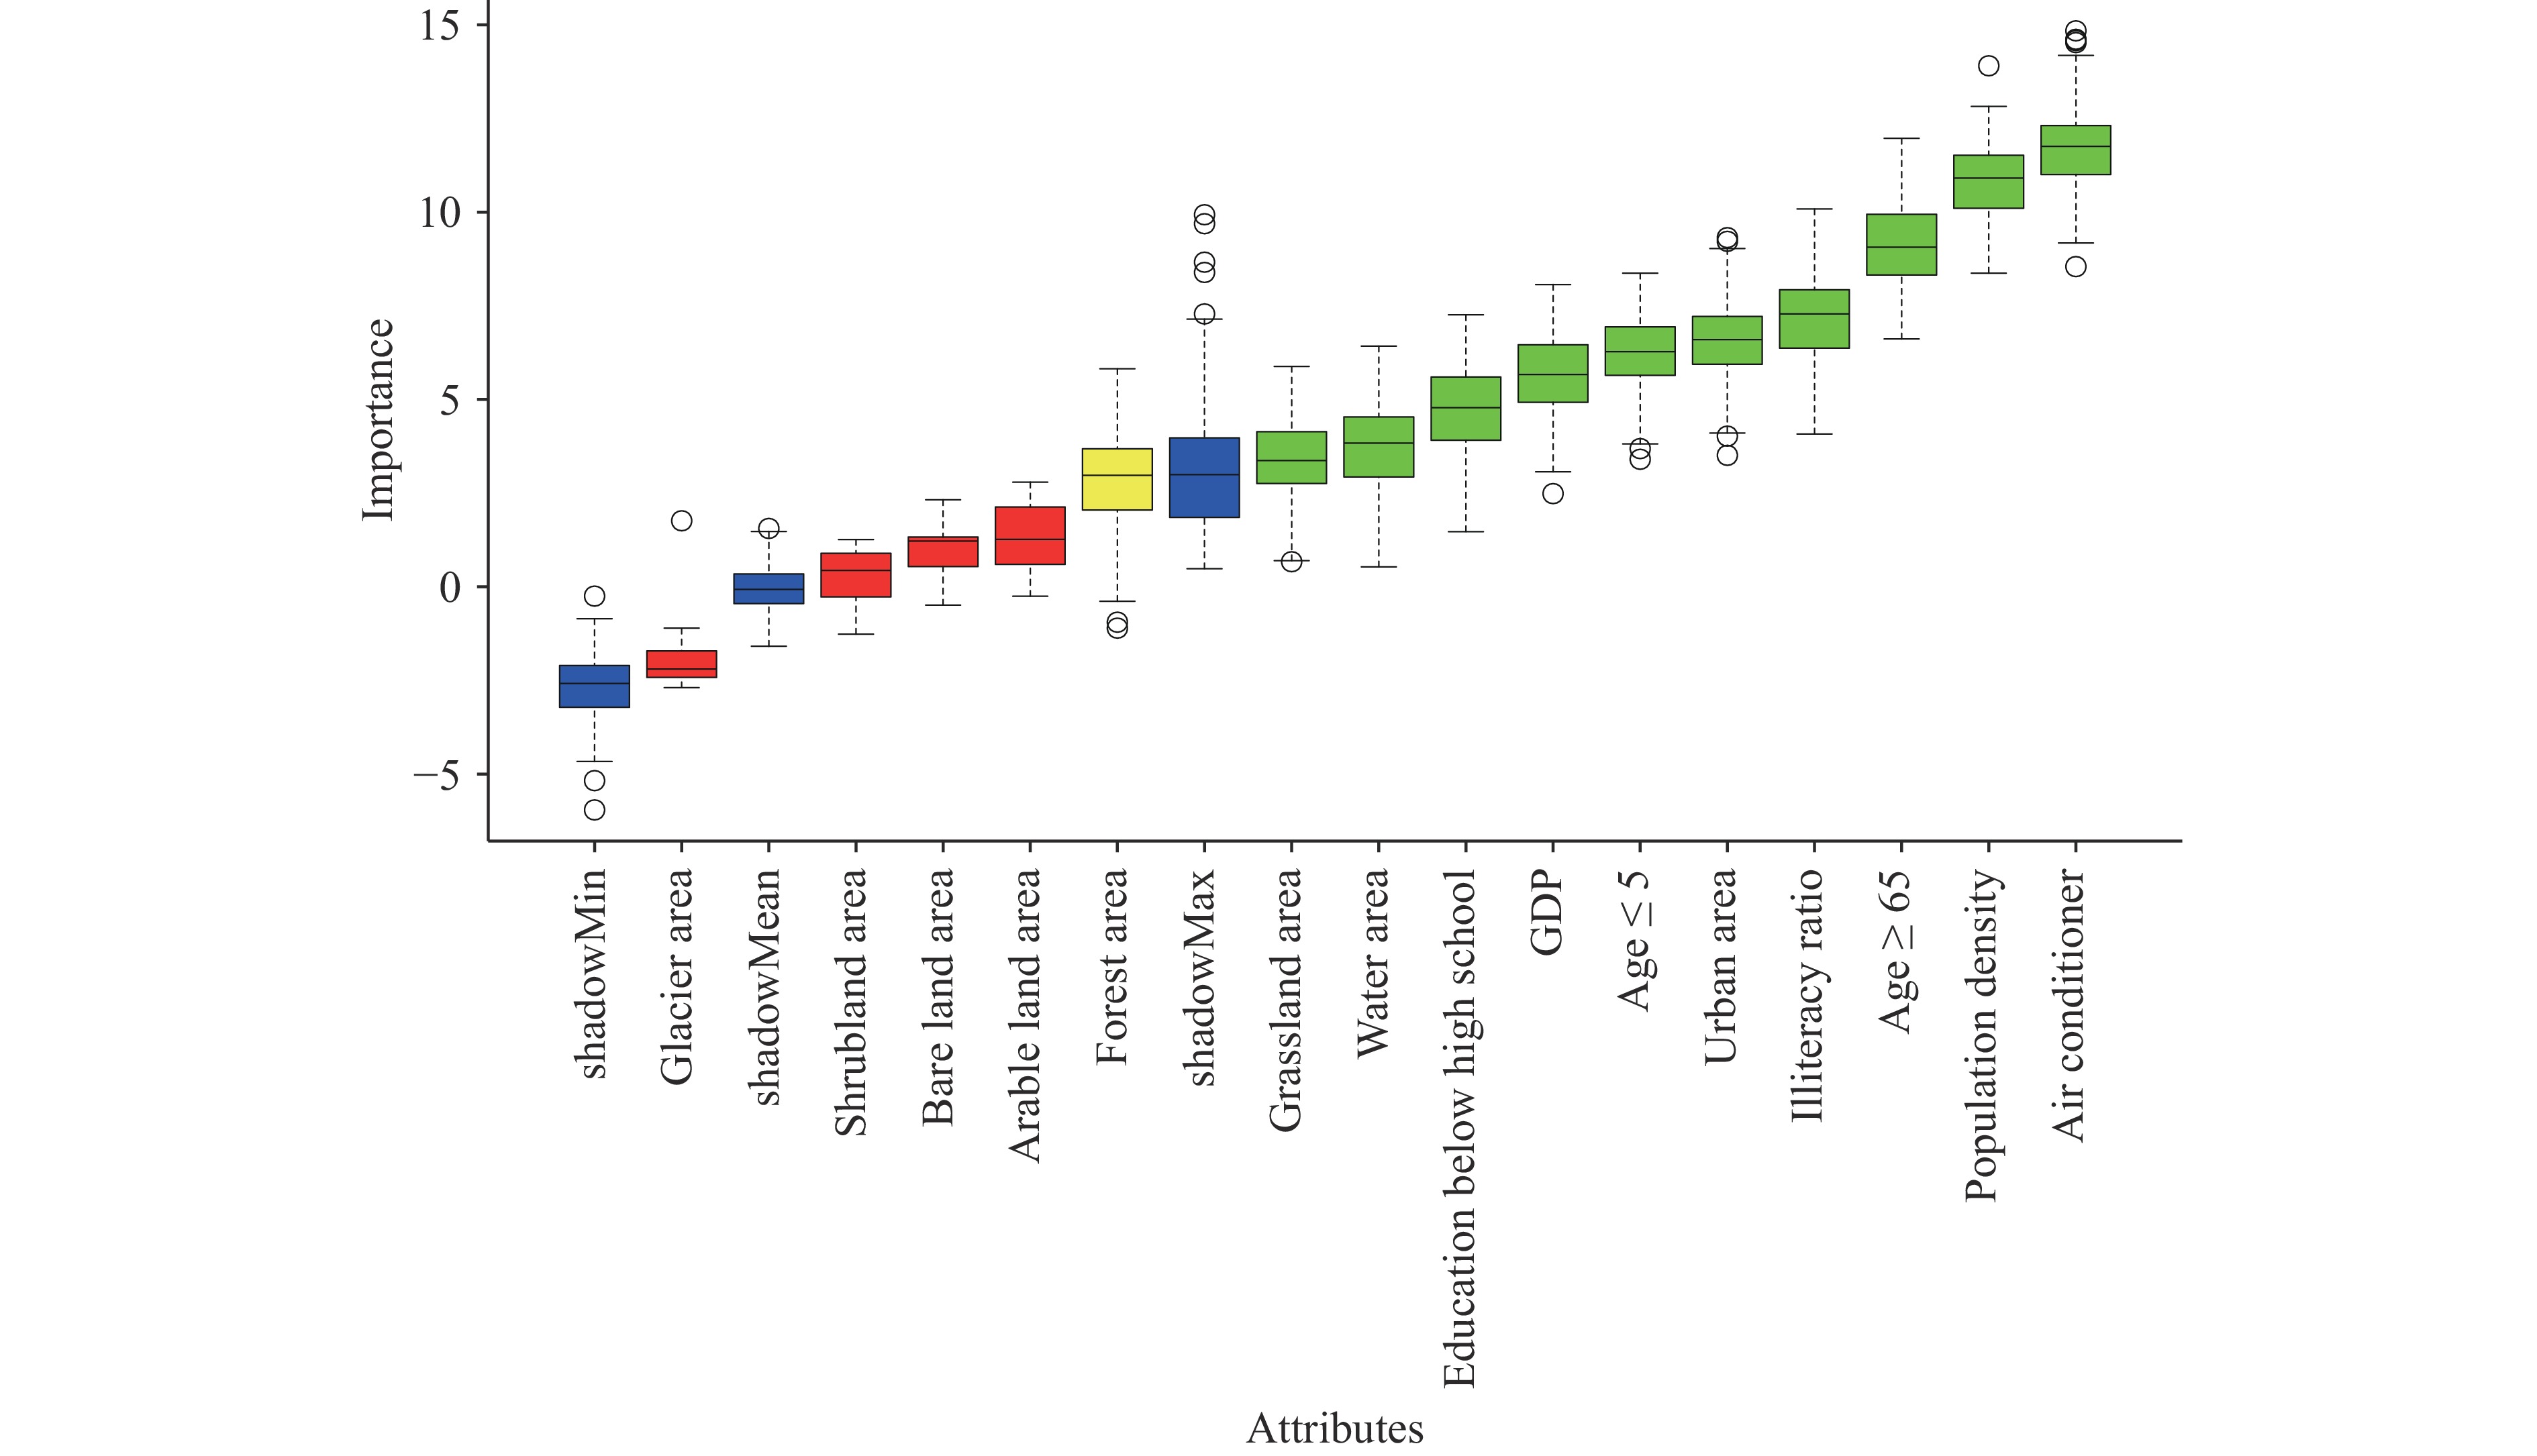 Figure 1.
Ranking of heat-vulnerability indicators screen (N=323).
Note: Green indicates features with importance significantly higher than the shadow features and are thus retained; yellow indicates features with importance comparable to the shadow features and require further iterative assessment; blue represents the shadow features; red indicates features with importance lower than the shadow features and are thus removed.
Abbreviation: GDP=gross domestic product.
Supplementary Figure S1 shows a scree plot used to determine the number of PCs. We selected PCs with eigenvalues greater than 1, and four PCs were extracted, which cumulatively explained 76% of the variance in the original 10 variables (Table 1). PC1 represented the residential environment and resource allocation, characterized by high loadings on AC, population density, and grassland. PC2 reflected population structure and social vulnerability, comprising ages ≤5 and ≥65 years, as well as the illiteracy ratio. PC3 captured educational-attainment and urban-development levels, represented by the proportion of people who were educated below senior high school and in urban areas. PC4 was dominated by water-body proportion, indicating local hydrological features.Indicators PC1 PC2 PC3 PC4 Air conditioner (sets per 100 households) 0.79* 0.14 0.05 0.20 Population density (persons/km2) −0.77* 0.05 −0.39 −0.09 Age ratio (age ≤5) (%) −0.14 0.88* 0.17 0.13 Age ratio (age ≥65) (%) −0.24 −0.78* 0.27 −0.09 Illiteracy ratio (%) 0.32 0.72* 0.28 −0.16 Education below high school (%) 0 0.07 0.88* 0.07 Urban area (%) 0.20 0.04 0.78* 0 GDP (10,000 CNY) 0.60 −0.03 0.56 0.78* Grassland area (%) −0.70* −0.43 0.10 0.16 Water area (%) 0.15 0.06 0.09 0.93* Abbreviation: GDP=gross domestic product; PC=principal component; CNY=Chinese Yuan.
* Absolute values ≥0.7 are the most significant loadings on that factor.Table 1. Factor loadings of the heat-vulnerability indicators in Chinese counties (N=2,844).
Supplementary Figure S2 shows a frequency distribution of HVI. The spatial analysis revealed pronounced regional variations in heat vulnerability across China (Figure 2). Counties with high vulnerability were primarily concentrated in Southwestern China, including Yunnan, Guangxi, Sichuan, Guizhou, and Tibet, whereas low-vulnerability areas were mainly distributed in South China and the eastern coastal regions. Results from the linear regression analysis, conducted after confirming a clear linear relationship between the HVI and proportion of non-accidental deaths on extreme-heat days, indicated that each one-unit increase in HVI was associated with an average 2.41% increase in the proportion of non-accidental deaths on extreme-heat days (95% confidence interval: 1.05, 3.77%, P<0.05).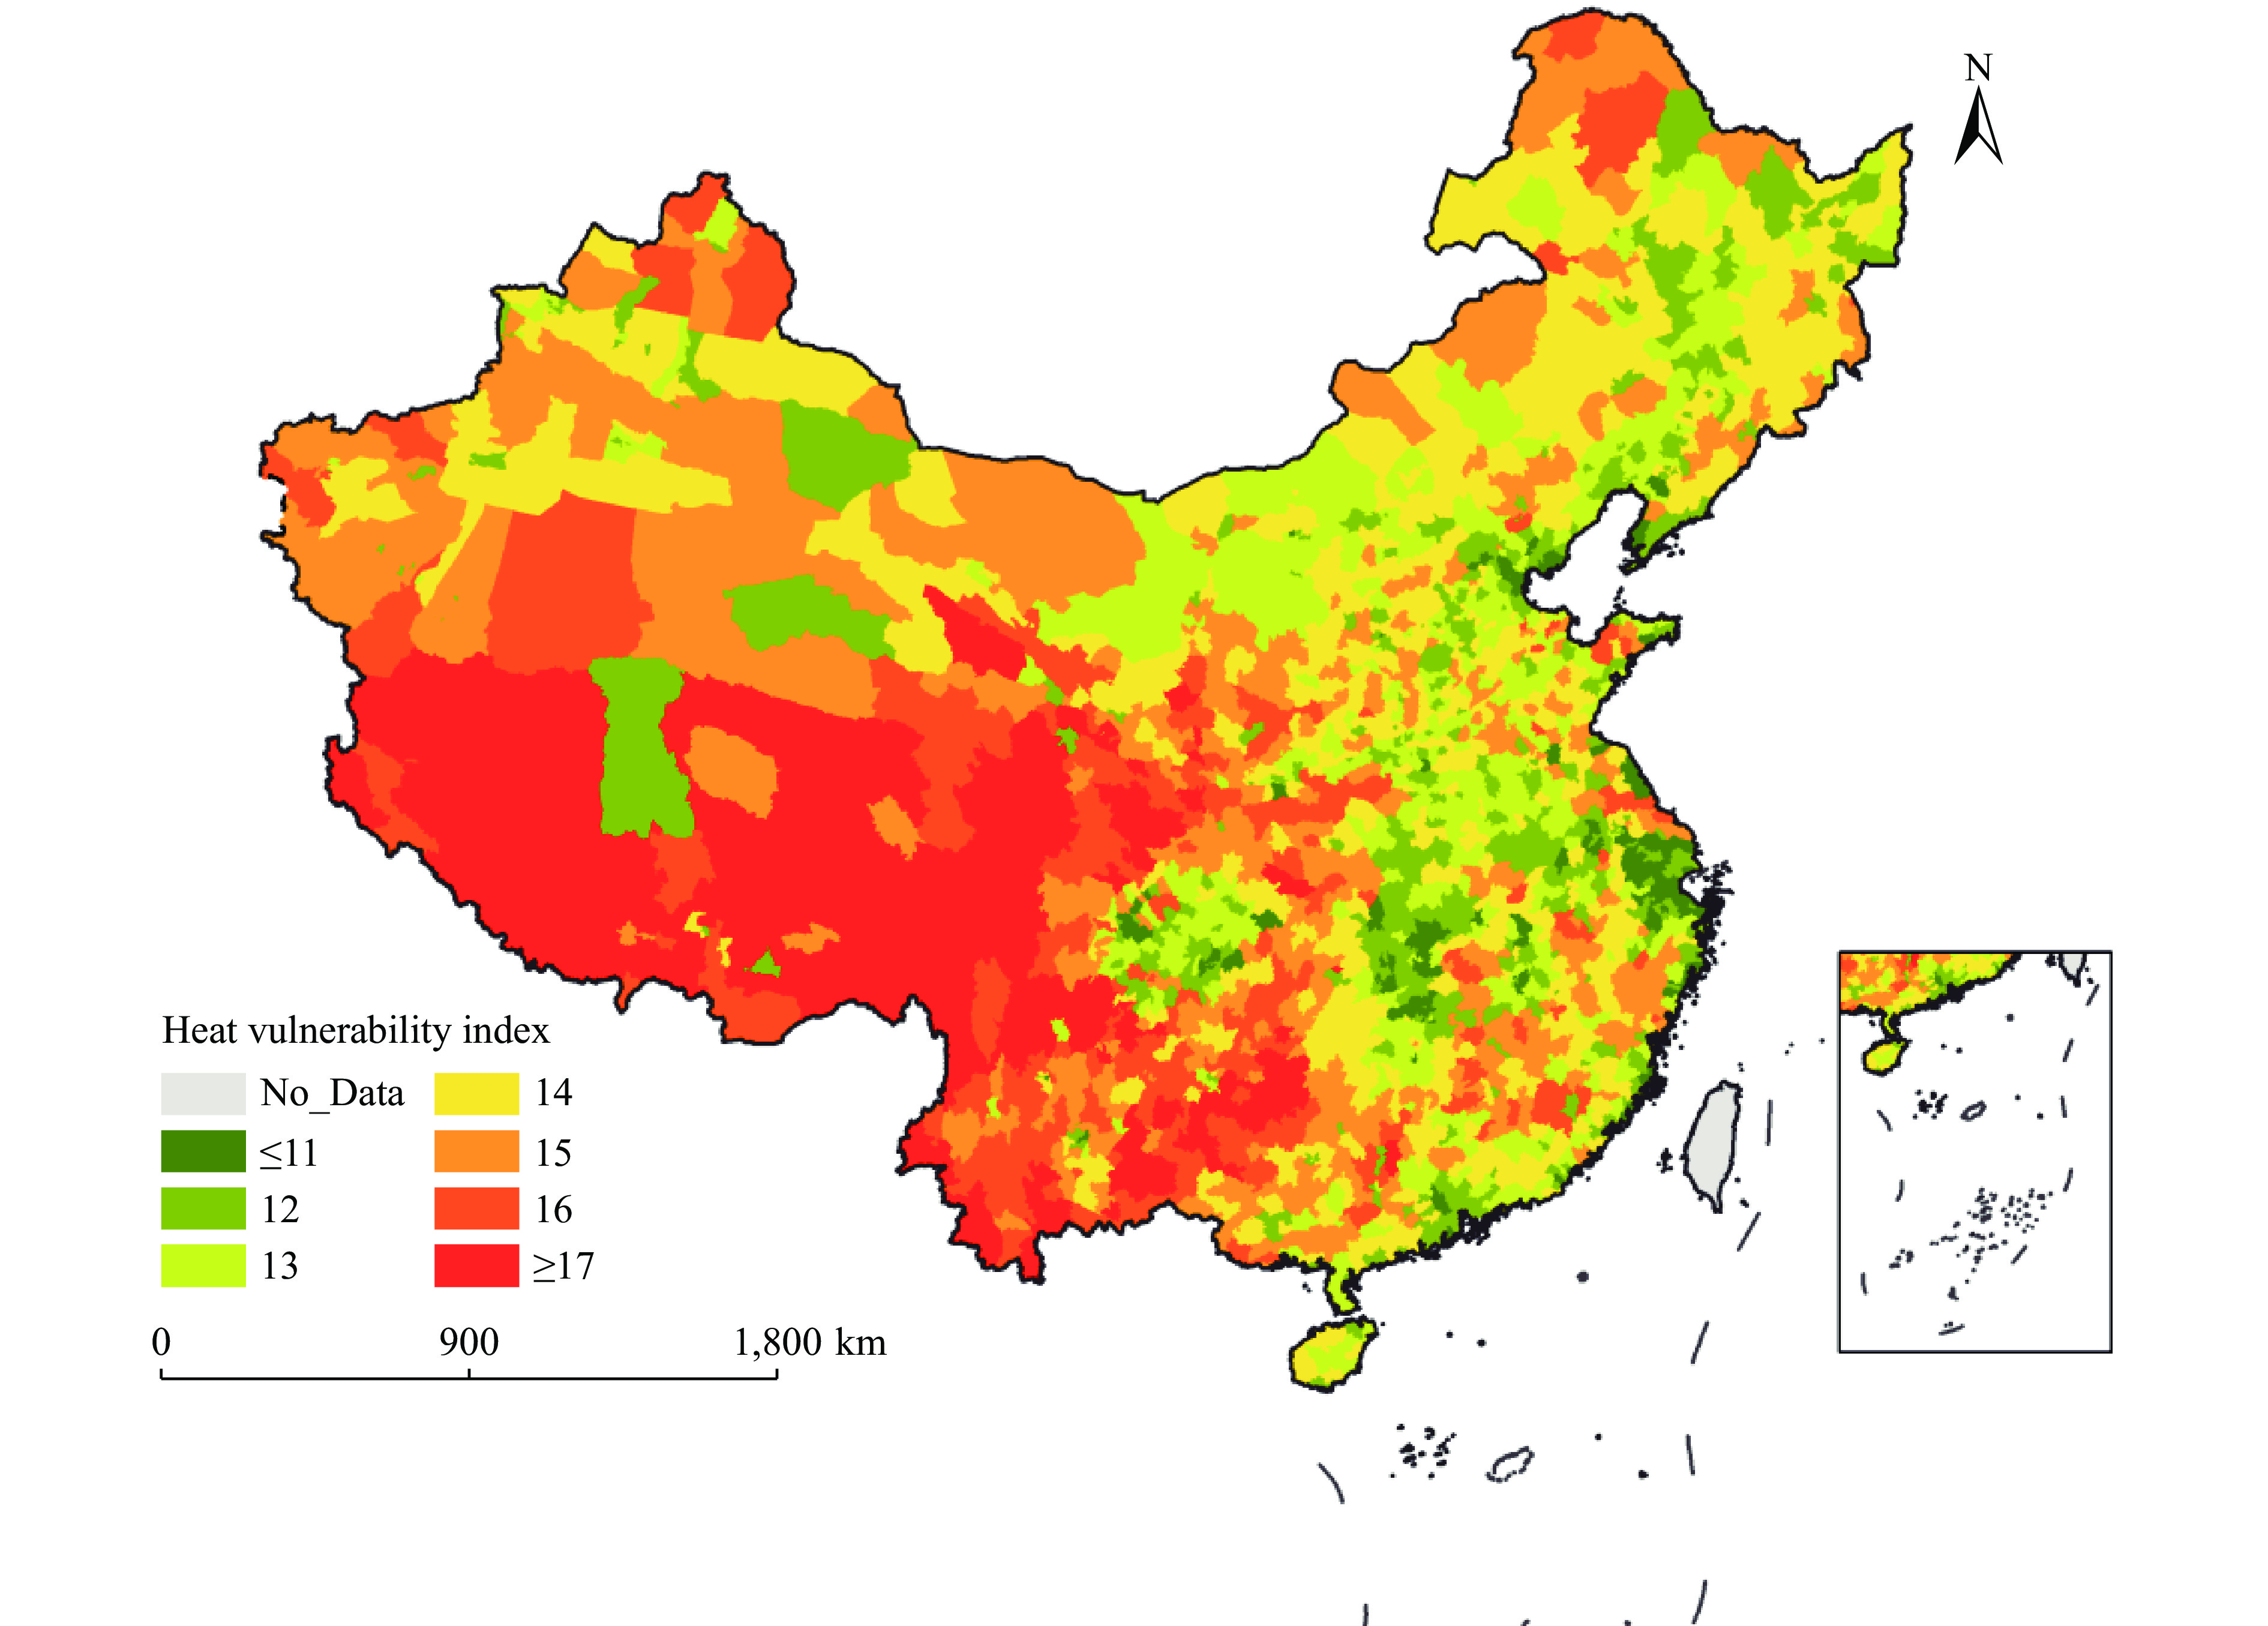 Figure 2.
Spatial distribution of heat vulnerability in counties of China in 2020 (N=2,844).
Map approval number: GS京(2026)0497号. -
This study comprehensively assessed county-level heat vulnerability across China in 2020 using a machine-learning-based approach and confirmed a significant positive correlation between the HVI and proportion of non-accidental deaths on extreme-heat days. These findings revealed pronounced spatial disparities in heat vulnerability nationwide.
A major methodological contribution of this study is the integration of machine learning into indicator selection. Using the Boruta algorithm, the 10 indicators most strongly associated with the proportion of non-accidental deaths on extreme-heat days were objectively identified. This overcame the subjectivity of the literature or expert-based selection and enhanced the scientific rigor and robustness of the HVI by avoiding weakly correlated variables (8). These indicators reflect multiple dimensions of population characteristics, socioeconomic conditions, and environmental features. Therefore, these indicators not only help explain the underlying mechanisms driving regional differences in heat vulnerability but also provide clear public health and heat adaptation implications. For regions with higher vulnerability, more targeted public health preparedness, greater protection of sensitive populations, strengthened social support, and environmental resilience may be required.
Southwestern China has been consistently identified as a region with persistently high heat vulnerability, which is consistent with earlier research (9). This consistency underscores the stability of vulnerability patterns in this region over the past decade, suggesting that Southwestern China should remain a focal area for heat-related health prevention and adaptation. Moreover, the results highlight the dynamic nature of heat vulnerability across China. Vulnerability has increased significantly in several south-central regions, whereas some northern areas have experienced a decline. These spatiotemporal shifts indicate that heat vulnerability is not static but evolves in response to climate change, socioeconomic development, and policy-driven adaptation measures (10).
This study had several limitations. First, the HVI was constructed using 2020 indicator data, whereas mortality and meteorological data were from 2013 to 2018, creating a temporal mismatch that may bias the indicator selection and affect the consistency between the HVI and mortality validation. To reduce this bias, six years of daily non-accidental deaths were aggregated to calculate the proportion of deaths on extreme heat days, which smoothed interannual fluctuations and provided a more stable estimate than the single-year data. Additionally, owing to data constraints, county-level AC was estimated using provincial urban–rural AC data combined with county-level population structures. This derived measure may introduce uncertainty and cannot fully reflect true county-level AC levels; however, it represents the most feasible and reasonable approach under the current data conditions. Finally, an equal-weighting method was adopted to aggregate all the retained PCs, which did not fully consider the actual relative importance of each component to heat vulnerability. In future research, more refined weighting strategies, such as regression coefficient-based weighting, Bayesian hierarchical models, and data-driven machine-learning approaches, may be explored to further optimize index construction.
In conclusion, this study refined the heat-vulnerability-assessment framework by incorporating machine learning techniques and provided an updated county-level HVI for China in 2020. The findings revealed substantial spatial heterogeneity, with Southwestern China exhibiting a significantly higher vulnerability than the southern and eastern coastal regions. These results offer an accurate understanding of current vulnerability patterns and provide a scientific foundation for public health planning, targeted resource allocation, and climate-adaptation strategies to mitigate the health impacts of extreme heat.
-
This study was supported by the Capital’s Funds for Health Improvement and Research (grant number 2024-1G-4231).
-
The mortality dataset used in this study was approved by the Ethical Review Committee of the National Institute of Environmental Health, Chinese Center for Disease Control and Prevention (Approval No. 202102).
HTML
| Citation: |

|