
 Download:


HTML
-
Introduction: As public concern over indoor environmental quality and healthy living conditions continues to grow, understanding indoor radon levels, their determinants, and urban-rural disparities in residential buildings has become increasingly important.
Methods: This study measured indoor radon concentrations in 1,139 dwellings across 20 cities from 2023 to 2025 using the solid-state nuclear track detector (SSNTD) technique over a 6-month cumulative sampling period.
Results: The median indoor radon concentration was 67 Bq/m3, corresponding to an annual effective dose of 2.03 mSv/year. Urban areas had a median concentration of 65 Bq/m3 (dose: 1.97 mSv/year), while rural areas reached 72 Bq/m3 (dose: 2.18 mSv/year).
Conclusion: Comparison with previous data revealed an increasing trend in indoor radon concentrations nationwide, with rural areas exhibiting significantly higher levels than urban areas. To mitigate indoor radon pollution, a comprehensive strategy is recommended, including controlling radon exhalation from building materials at the source, ensuring adequate ventilation, and inspecting and sealing structural cracks.
-
Ionizing radiation poses well-documented health risks, and radon (222Rn) constitutes the most significant source of natural ionizing radiation exposure (1). This radioactive gas originates from uranium decay in soil, rocks, and building materials, entering indoor environments through diffusion and advection. The World Health Organization identifies indoor radon as the second leading cause of lung cancer after smoking (1). Epidemiological studies in Europe (2), North America (3), and China (4) provide compelling evidence linking indoor radon exposure to lung cancer risk, even at the relatively low concentrations typical of residential buildings (1). Understanding indoor radon concentrations and their determinants is therefore essential for developing evidence-based building design standards and improving public health outcomes. However, most previous indoor radon surveys in China focused predominantly on urban areas, leaving rural radon exposure data limited. As of 2021, China’s rural permanent population stood at 509.78 million, and the potential health implications for this substantial population underscore the need for further investigation into rural indoor radon levels. This study represents the largest and most comprehensive indoor radon survey conducted in China in recent years, systematically measuring radon concentrations in urban and rural dwellings across 20 cities from 2023 to 2025. A detailed questionnaire capturing potential influencing factors accompanied each measurement. By integrating measurement data with questionnaire responses, this study aimed to compare radon levels between urban and rural areas, identify key factors influencing indoor radon concentrations, and provide a scientific basis for developing effective radon control and mitigation measures.
This study adopted a combination of stratified sampling and purposive selection. Cities were chosen to represent diverse climatic zones and geographical regions, with approximately 40 urban and 20 rural dwellings selected per city to reflect typical local building types. Surveys spanned from July 2023 to July 2025, with each city undergoing approximately six months of long-term cumulative monitoring that covered the winter season. Indoor radon concentrations were measured using the solid-state nuclear track detector (SSNTD) technique for long-term cumulative assessment. The study employed LIH radon detectors manufactured by the National Institute for Radiological Protection (NIRP) in China, with CR-39 (Fukuvi Chemical Industry Co., Ltd., Fukui, Japan) as the detecting material. After sampling, detectors were placed in containers filled with 6.25 mol/L NaOH and etched in a water bath at 80 °C for 8 hours. Etching rendered latent tracks clearly visible under microscopic examination. Average indoor radon concentrations were then calculated from the observed track density, exposure duration, and a calibration factor of 4.8 Tr/cm2 per Bq/(h·m3), as determined through standard procedures of the National Institute of Metrology, China.
Indoor radon concentration in air was calculated using Equation (1):
$$ {C}_{Rn}=\frac{n-{n}_{b}}{t\cdot F} $$ (1) Where: CRn — average indoor radon concentration during the exposure period, Bq/m3; n — track density, Tr/cm2; nb — background track density, Tr/cm2; t — sampling time, h; F — calibration factor, (Tr/cm2) /[Bq/(h·m3].
The annual effective dose from indoor radon exposure was estimated using the equation recommended by the United Nations Scientific Committee on the Effects of Atomic Radiation (UNSCEAR) (5), as shown in Equation (2):
$$ {E=C}_{{{R}_{n}}}\cdot F\cdot T\cdot DCF $$ (2) Where: E — effective dose (mSv/year); CRn — indoor radon concentration (Bq/m3); F — equilibrium factor between radon and its progeny, 0.48 (6); T — exposure time, 7,000 h/year; DCF — dose conversion factor, 9 nSv/[(Bq·h)/m3] (7).
Statistical analyses were conducted using R (version 4.5.0; R Foundation for Statistical Computing, Vienna, Austria). Two-group comparisons employed Student’s t-test or the Mann-Whitney U test, as appropriate, while comparisons among three or more groups used analysis of variance (ANOVA) or the Kruskal-Wallis test. Statistical significance was set at P<0.05.
This survey yielded 1,139 valid indoor radon measurements, with a median concentration of 67 Bq/m3 (range: 5–587 Bq/m3). Overall, 24.1% of dwellings exceeded 100 Bq/m3, and 0.6% exceeded 300 Bq/m3. Assessing effective doses in residential settings is essential for characterizing indoor radon exposure (8). Figure 1 presents the median indoor radon concentrations and corresponding annual effective doses across the 20 cities. Urban areas contributed 810 measurements (median: 65 Bq/m3; dose: 1.97 mSv/year), with 20.9% exceeding 100 Bq/m3 and 0.1% exceeding 300 Bq/m3. Rural areas contributed 329 measurements (median: 72 Bq/m3; dose: 2.18 mSv/year), with 32.2% exceeding 100 Bq/m3 and 1.8% exceeding 300 Bq/m3. Indoor radon concentrations differed significantly between rural and urban areas (P<0.001), with rural levels exceeding urban levels.
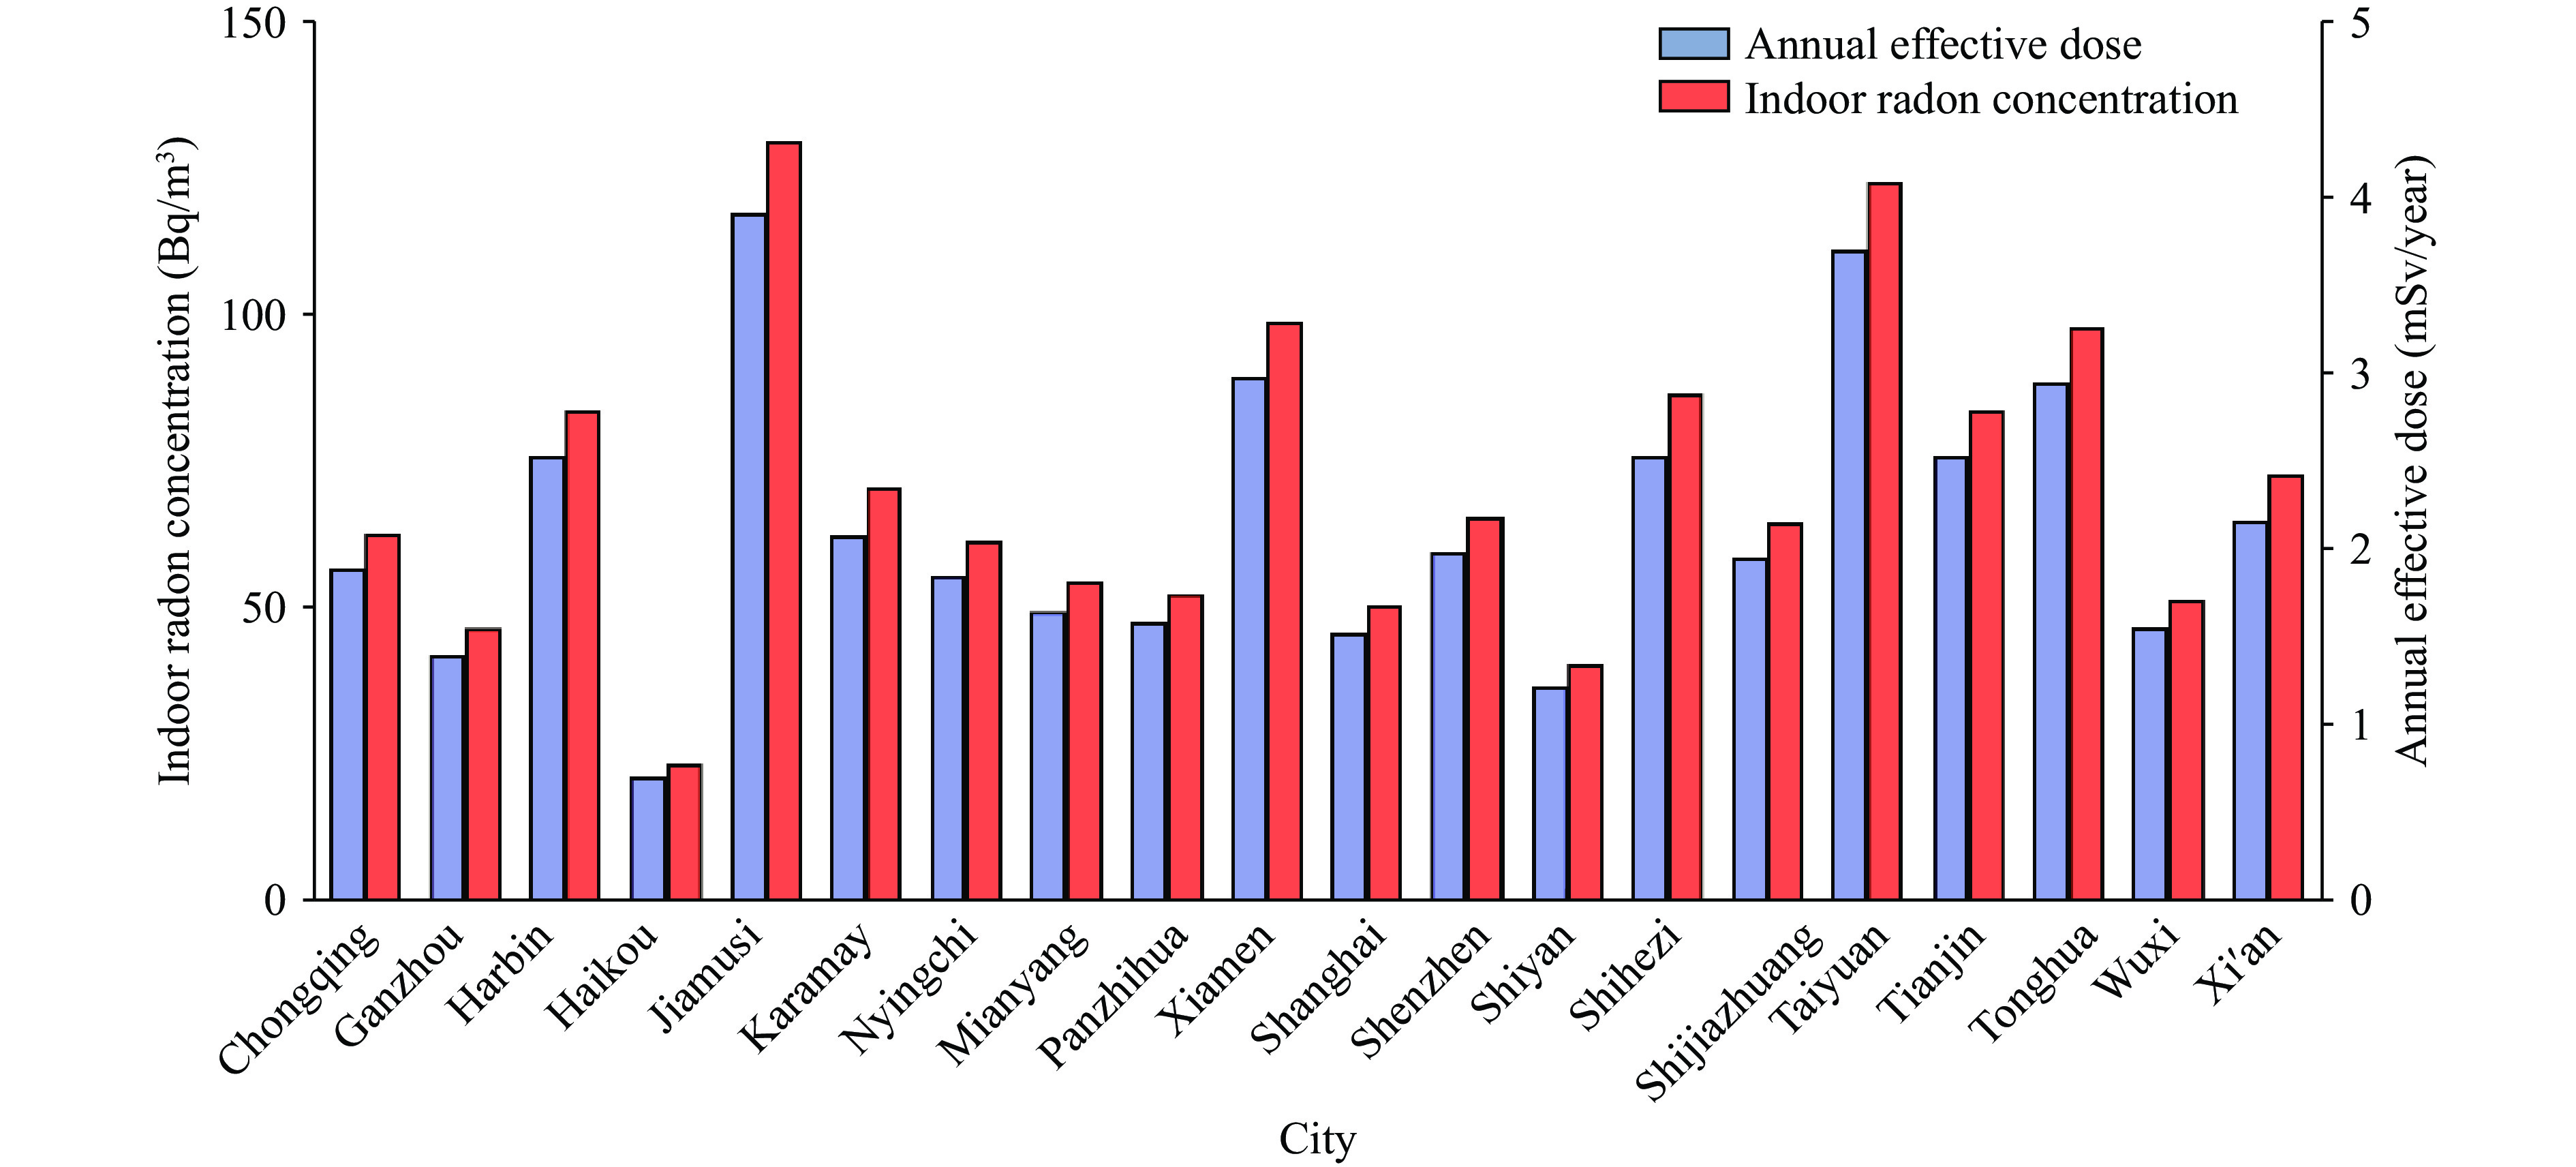 Figure 1.
Median indoor radon concentrations (Bq/m3) and annual effective doses (mSv/year) for residents across 20 cities in China.
Indoor radon concentrations were further analyzed by geographic region, climate zone, floor level, building structure type, and construction period. Northern cities exhibited significantly higher concentrations than southern cities (P<0.001). According to the Uniform Standard for Design of Civil Buildings (GB 50352), China encompasses five climate zones: the severe cold zone (SCZ), cold zone (CZ), hot-summer and cold-winter zone (HCZ), hot-summer and warm-winter zone (HWZ), and mild zone (MZ) (no data available). Concentrations differed significantly among these zones (P<0.001), with higher levels in the SCZ and CZ than in the HCZ and HWZ; concentrations in the HWZ also significantly exceeded those in the HCZ. Floor level similarly influenced radon concentrations (P<0.001), with ground-floor dwellings recording higher levels than upper floors. Building structure type showed significant effects (P<0.05), as brick-wood structures (BWS) exhibited higher concentrations than reinforced concrete structures (RCS) and brick-concrete structures (BCS). Because only the SCZ and CZ contained buildings spanning all three development stages (9), construction-period analysis was restricted to these zones, revealing significant differences among building periods (P<0.001). Table 1 presents detailed statistical results.
Influencing factors Sample Indoor radon concentration (Bq/m3) Median (25th–75th) Z/H-value P City Urban 810 65 (47–93) −3.567 0.001 Rural 329 73 (51–116) Region North 521 90 (67–121) −16.548 0.001 South 618 53 (41–70) Building
Climate
ZonesSCZ 345 84 (68–116) 266.183 0.001 CZ 230 89 (59–122) HCZ 403 51 (41–65) HWZ 161 59 (36–95) Floor
Level1 237 71 (50–122) 18.333 0.001 2–3 249 61 (42–90) 4–9 409 68 (48–98) ≥10 244 68 (51–94) Building
StructureRCS 1,009 67 (47–97) 6.173 0.046 BCS 88 66 (51–103) BWS 42 80 (50–140) Building
PeriodPre–1980 4 106 (72–110) 29.939 0.001 1980–1989 23 47 (40–66) 1990–1999 59 73 (58–99) 2000–2010 155 93 (70–122) Post–2010 171 84 (65–115) Note: The Z- and H-values represent the test statistics for the Mann-Whitney U test and the Kruskal-Wallis test, respectively.
Abbreviation: SCZ=severe cold zone; CZ=cold zone; HCZ=hot-summer and cold-winter zone; HWZ=hot-summer and warm-winter zone; RCS=reinforced concrete structure; BCS=brick-concrete structure; BWS=brick-wood structure.Table 1. Distribution of indoor radon concentrations across different factors.
-
This study characterized indoor radon concentrations in 1,139 dwellings across 20 cities in China from 2023 to 2025. The findings align with previous reviews (10-11), which documented a continuously rising trend in indoor radon concentrations across China over recent decades. China’s Standards for Indoor Air Quality (GB/T 18883-2022) establish a radon reference level of 300 Bq/m3, representing the maximum acceptable average concentration and serving as a nationally recognized risk benchmark rather than a strict safety threshold. When indoor radon exceeds this level, remedial action is recommended.
Ventilation rate emerged as a critical determinant of indoor radon concentration. During winter months, the substantially lower temperatures in northern regions and cold zones discourage frequent ventilation, promoting indoor radon accumulation. All four cities with radon concentrations exceeding 300 Bq/m3 are located in northern China. In these high-radon areas, elevated concentrations reflect low ventilation rates, partly attributable to the thicker walls designed to resist cold climates.
Since 1986, China has progressively implemented residential building energy efficiency standards for new urban construction. However, previous studies (12-13) demonstrated that energy-saving designs inadvertently reduce ventilation rates, thereby promoting indoor radon accumulation. Moreover, incorporating industrial by-products into building materials — while improving energy efficiency — has increased their radium content, consequently elevating indoor radon concentrations (14). These findings suggest that current energy efficiency standards may need revision to balance thermal performance with indoor air quality, particularly with respect to radon mitigation.
Unlike modern medium- and high-rise buildings, bungalows experience more direct radon exhalation from the underlying soil. Direct ground-floor contact with the soil enables radon gas to infiltrate indoor spaces more readily, resulting in elevated concentrations (15). BCS and BWS are typically used for low-rise buildings in rural areas, whereas RCS predominates in urban high-rise construction. Low-rise buildings face the combined influence of both soil-derived and building-material-derived radon. Furthermore, rural BCS and BWS dwellings tend to be older — 42% were constructed before 2000, compared with only 15% of RCS buildings. In many BCS and BWS dwellings, floors are laid directly on the soil, allowing radon to infiltrate through floor cracks or foundation gaps and elevating indoor concentrations.
Indoor radon levels exceeding the national reference level signal potential public health risks, and effective mitigation demands coordinated interventions at multiple levels. Source control measures should encompass stricter regulation of building materials with high radium content and enforcement of radon exhalation standards. At the building level, improved ventilation, higher air exchange rates, and sealing of structural cracks can limit radon entry and accumulation. At the resident level, regular ventilation practices and targeted public education are essential for reducing exposure. These findings collectively underscore the need for integrated regulatory, environmental, and educational measures to address radon-related health risks in China.
This study has several limitations. Although the 20 cities were selected to represent different regions of China, constraints in research personnel and infrastructure may have limited representativeness. The sample of 1,139 dwellings may not fully capture national indoor radon patterns, and the target of 60 dwellings per city was determined by prior experience and practical considerations rather than formal statistical power calculations. Future studies employing larger, more systematically designed samples are warranted.
| Citation: |

|