
 Download:


-
Introduction: Drug-resistant tuberculosis (TB) poses a significant threat to public health. This study aimed to analyze the drug resistance patterns of Mycobacterium tuberculosis (MTB) and its risk factors in 10 districts of Hunan Province from 2018‒2025. The study provides a reference for formulating strategies to prevent and control drug-resistant TB.
Methods: Isolates were collected from patients with pulmonary TB between January 2018 and December 2025 at 10 surveillance sites in Hunan Province. Drug resistance profiles were determined for two anti-TB drugs, rifampicin (RIF) and isoniazid (INH). Statistical analyses of epidemiological characteristics and risk factors for drug resistance were performed.
Results: Among the 25,978 MTB isolates tested, 1,320 (5.08%) strains were resistant to one or more anti-TB drugs. The prevalence of rifampicin-resistant (RR) and multidrug-resistant (MDR) TB was 553 (2.13%) and 310 (1.19%), respectively. Univariate analysis revealed that sex, age, occupation, patient source, prior treatment history, comorbidities, residential district, and time of diagnosis were significantly associated with overall TB drug resistance (all P<0.05). RR-TB was significantly associated with all variables except occupation (all P<0.05). Multivariate logistic regression revealed the following independent predictors of drug resistance: male sex, retreatment status, age 25–44 years, diabetes mellitus, and residence in Lengshuitan.
Conclusion: The results demonstrated the factors that indicated a significant risk of MDR-TB. Therefore, intensifying MDR-TB surveillance to develop treatment and monitoring guidelines is urgently needed.
-
Tuberculosis (TB), a chronic infectious disease caused by Mycobacterium tuberculosis (MTB), is primarily treated with anti-TB drugs. According to a 2025 report from the World Health Organization (1), TB remains one of the deadliest infectious diseases worldwide, causing over 1.2 million deaths and infecting 10.7 million people in 2024. China ranks fourth in estimated TB incidence among the top 30 high-burden TB countries, with approximately 28,000 new patients diagnosed with multidrug-resistant (MDR)- and rifampicin-resistant (RR)-TB annually. The MDR/RR rate was 3.2% in newly diagnosed patients and 16.0% in retreated patients. Rifampicin (RIF) is a first-line drug; once resistance occurs, treatment is adjusted to a complex second-line anti-TB drug regimen (2). The transmission of MDR-TB strains plays a significant role in the burden of MDR-TB in China (3). To understand the characteristics and risk factors of patients with MDR/RR-TB, we used partial research data from the National Science and Technology Major Project for the 13th Five-Year Plan to analyze the RR-TB status and risk factors of patients with bacteriologically positive pulmonary TB (PTB) in Hunan Province.
We adopted a multi-stage stratified cluster random sampling method to select ten counties across three cities in Hunan and included patients with bacteriologically confirmed PTB. The inclusion criteria were: 1) diagnosis between January 1, 2018, and December 31, 2025; 2) sputum smear-positive and/or mycobacterial culture-positive with the cultured strain identified as MTB complex and/or molecular biology-positive samples; and 3) signed informed consent forms and cooperation with the study.
Data of 30,505 patients with etiologically positive PTB between 2018‒2025 were obtained from the China Disease Prevention and Control Information System. This included demographic (sex, age, ethnicity, occupation, and household registration), diagnosis, and treatment information (patient source, treatment category, comorbidities, area of residence, and time of diagnosis). A total of 4,527 cases tested positive using only sputum smear acid-fast staining but did not yield successful MTB isolation or nucleic acid amplification test confirmation. Hence, we enrolled 25,978 etiologically confirmed cases, defined as those with positive sputum smear acid-fast staining and MTB culture or nucleic acid amplification test results. The molecular biological method was an Xpert MTB/RIF assay for the detection of MTB and RR genes.
All analyses were performed using WPS Office software (WPS Software, Singapore) and SPSS (version 20.0, IBM Corp., Armonk, NY, USA). Count data were expressed as the composition ratio or rate (%) and measurement data as (x±s). Inter-group differences were compared using χ2 tests and multivariate analysis using binary logistic regression analyses. All the tests were two-sided. Statistical significance was set at P<0.05.
Of the 25,978 patients with pathogen-confirmed PTB included in the analysis, 1,320 (5.08%) exhibited resistance to at least one first-line anti-TB drug. Between 2018‒2020, molecular assays accounted for most tests (69.05%), whereas phenotypic methods accounted for 30.95%. From 2021 onwards, molecular testing became the predominant modality, and it comprised 82.79% of all tests during 2021–2025, while phenotypic testing declined to 17.21%.
Univariate analysis identified sex, age, occupation, patient source, history of prior treatment, comorbidities, district of residence, and time of diagnosis as statistically significant correlates of drug resistance (all P<0.05). No significant association was observed between ethnicity and drug resistance (P>0.05). A total of 553 patients (2.13%) were resistant to RIF. Univariate analysis revealed that sex, age, patient source, prior treatment history, comorbidities, residential district, and time of diagnosis were significantly associated with RR-TB (all P<0.05) but not ethnicity or occupation (P>0.05).
Multivariate logistic regression analysis (Table 1) identified the following independent predictors of anti-TB drug resistance: male sex [adjusted odds ratio (aOR)=0.842; 95% confidence interval (CI), 0.732, 0.969] and retreatment status (aOR=4.416; 95% CI: 3.794, 5.141); age 25–44 years (versus ≥65 years; aOR=1.329, 1.491; 95% CI: 1.168, 1.785), diabetes mellitus (aOR=1.486; 95% CI: 1.200, 1.842), and Lengshuitan residence (versus Qiyang City; aOR=1.603; 95% CI: 1.315, 1.956). In contrast, residence in other counties and cities (versus Qiyang City) was associated with a significantly lower risk (aOR=0.123–0.686; 95% CI: 0.093, 0.884). Additionally, a later diagnosis was protective against drug resistance (aOR=0.969 per unit increase; 95% CI: 0.943, 0.996).
Influencing factor β Wald χ2 P aOR (95% CI) Sex −0.172 5.785 0.016 0.842 (0.732–0.969) Age (years) 27.894 <0.001 <25 0.081 0.359 0.549 1.085 (0.831–1.415) 25–44 0.400 19.024 <0.001 1.491 (1.246–1.785) 45–64 0.284 18.766 <0.001 1.329 (1.168–1.511) ≥65 (reference) − − − 1 Treatment classification 1.485 367.194 <0.001 4.416 (3.794–5.141) Comorbidity 19.215 0.001 Pneumoconiosis 0.166 0.414 0.520 1.181 (0.712–1.957) Diabetes mellitus 0.396 13.149 <0.001 1.486 (1.200–1.842) HIV/AIDS 0.718 3.139 0.076 2.051 (0.927–4.541) Other comorbidities −0.311 2.082 0.149 0.733 (0.481–1.118) No comorbidity (reference) − − − 1 Residence 573.868 <0.001 Changning City −1.942 154.705 <0.001 0.143 (0.106–0.195) Hengnan County −2.099 215.732 <0.001 0.123 (0.093–0.162) Hengshan County −0.767 30.878 <0.001 0.464 (0.354–0.609) Hengyang County −1.155 98.615 <0.001 0.315 (0.251–0.396) Leiyang City −1.092 110.288 <0.001 0.336 (0.274–0.411) Lengshuitan District 0.472 21.700 <0.001 1.603 (1.315–1.956) Liling City −0.520 19.885 <0.001 0.595 (0.473–0.747) Lingling District −0.377 8.518 0.004 0.686 (0.533–0.884) Qidong County −0.827 63.271 <0.001 0.438 (0.357–0.536) Qiyang City − − − 1 Diagnosis time (per year increase) −0.031 4.927 0.026 0.969 (0.943–0.996) Constant (Intercept) −3.662 503.824 <0.001 0.026 Note: “−” means the reference category (OR=1.000) in the logistic regression model. Reference categories: ≥65 years of age; no comorbidity; Qiyang City for residence.
Abbreviations: SE=standard error; aOR=adjusted odds ratio; CI=confidence interval.Table 1. Multivariable logistic regression analysis of factors associated with rifampicin resistance among pathogen-positive PTB patients in 10 districts and counties, Hunan Province, China, 2018–2025.
Overall drug resistance was defined as resistance to at least one first-line anti-tuberculosis drug (INH and/or RIF). Model was adjusted for the testing method (molecular vs. phenotypic).
Figure 1 illustrates the spatiotemporal distribution of RR-TB and MDR-TB across the 10 districts and counties from 2018 to 2025. Drug resistance exhibited geographically concentrated hotspots during 2018–2021, which diminished by 2025. RR-TB remained moderate throughout the study period, whereas that of MDR-TB persisted at a low level. Figure 1 Annual county-level resistance rates are expressed as percentages. The color scale represents the district-level resistance rate (%). Color scales were classified using equal interval grouping and kept consistent across years within each panel to ensure comparability.
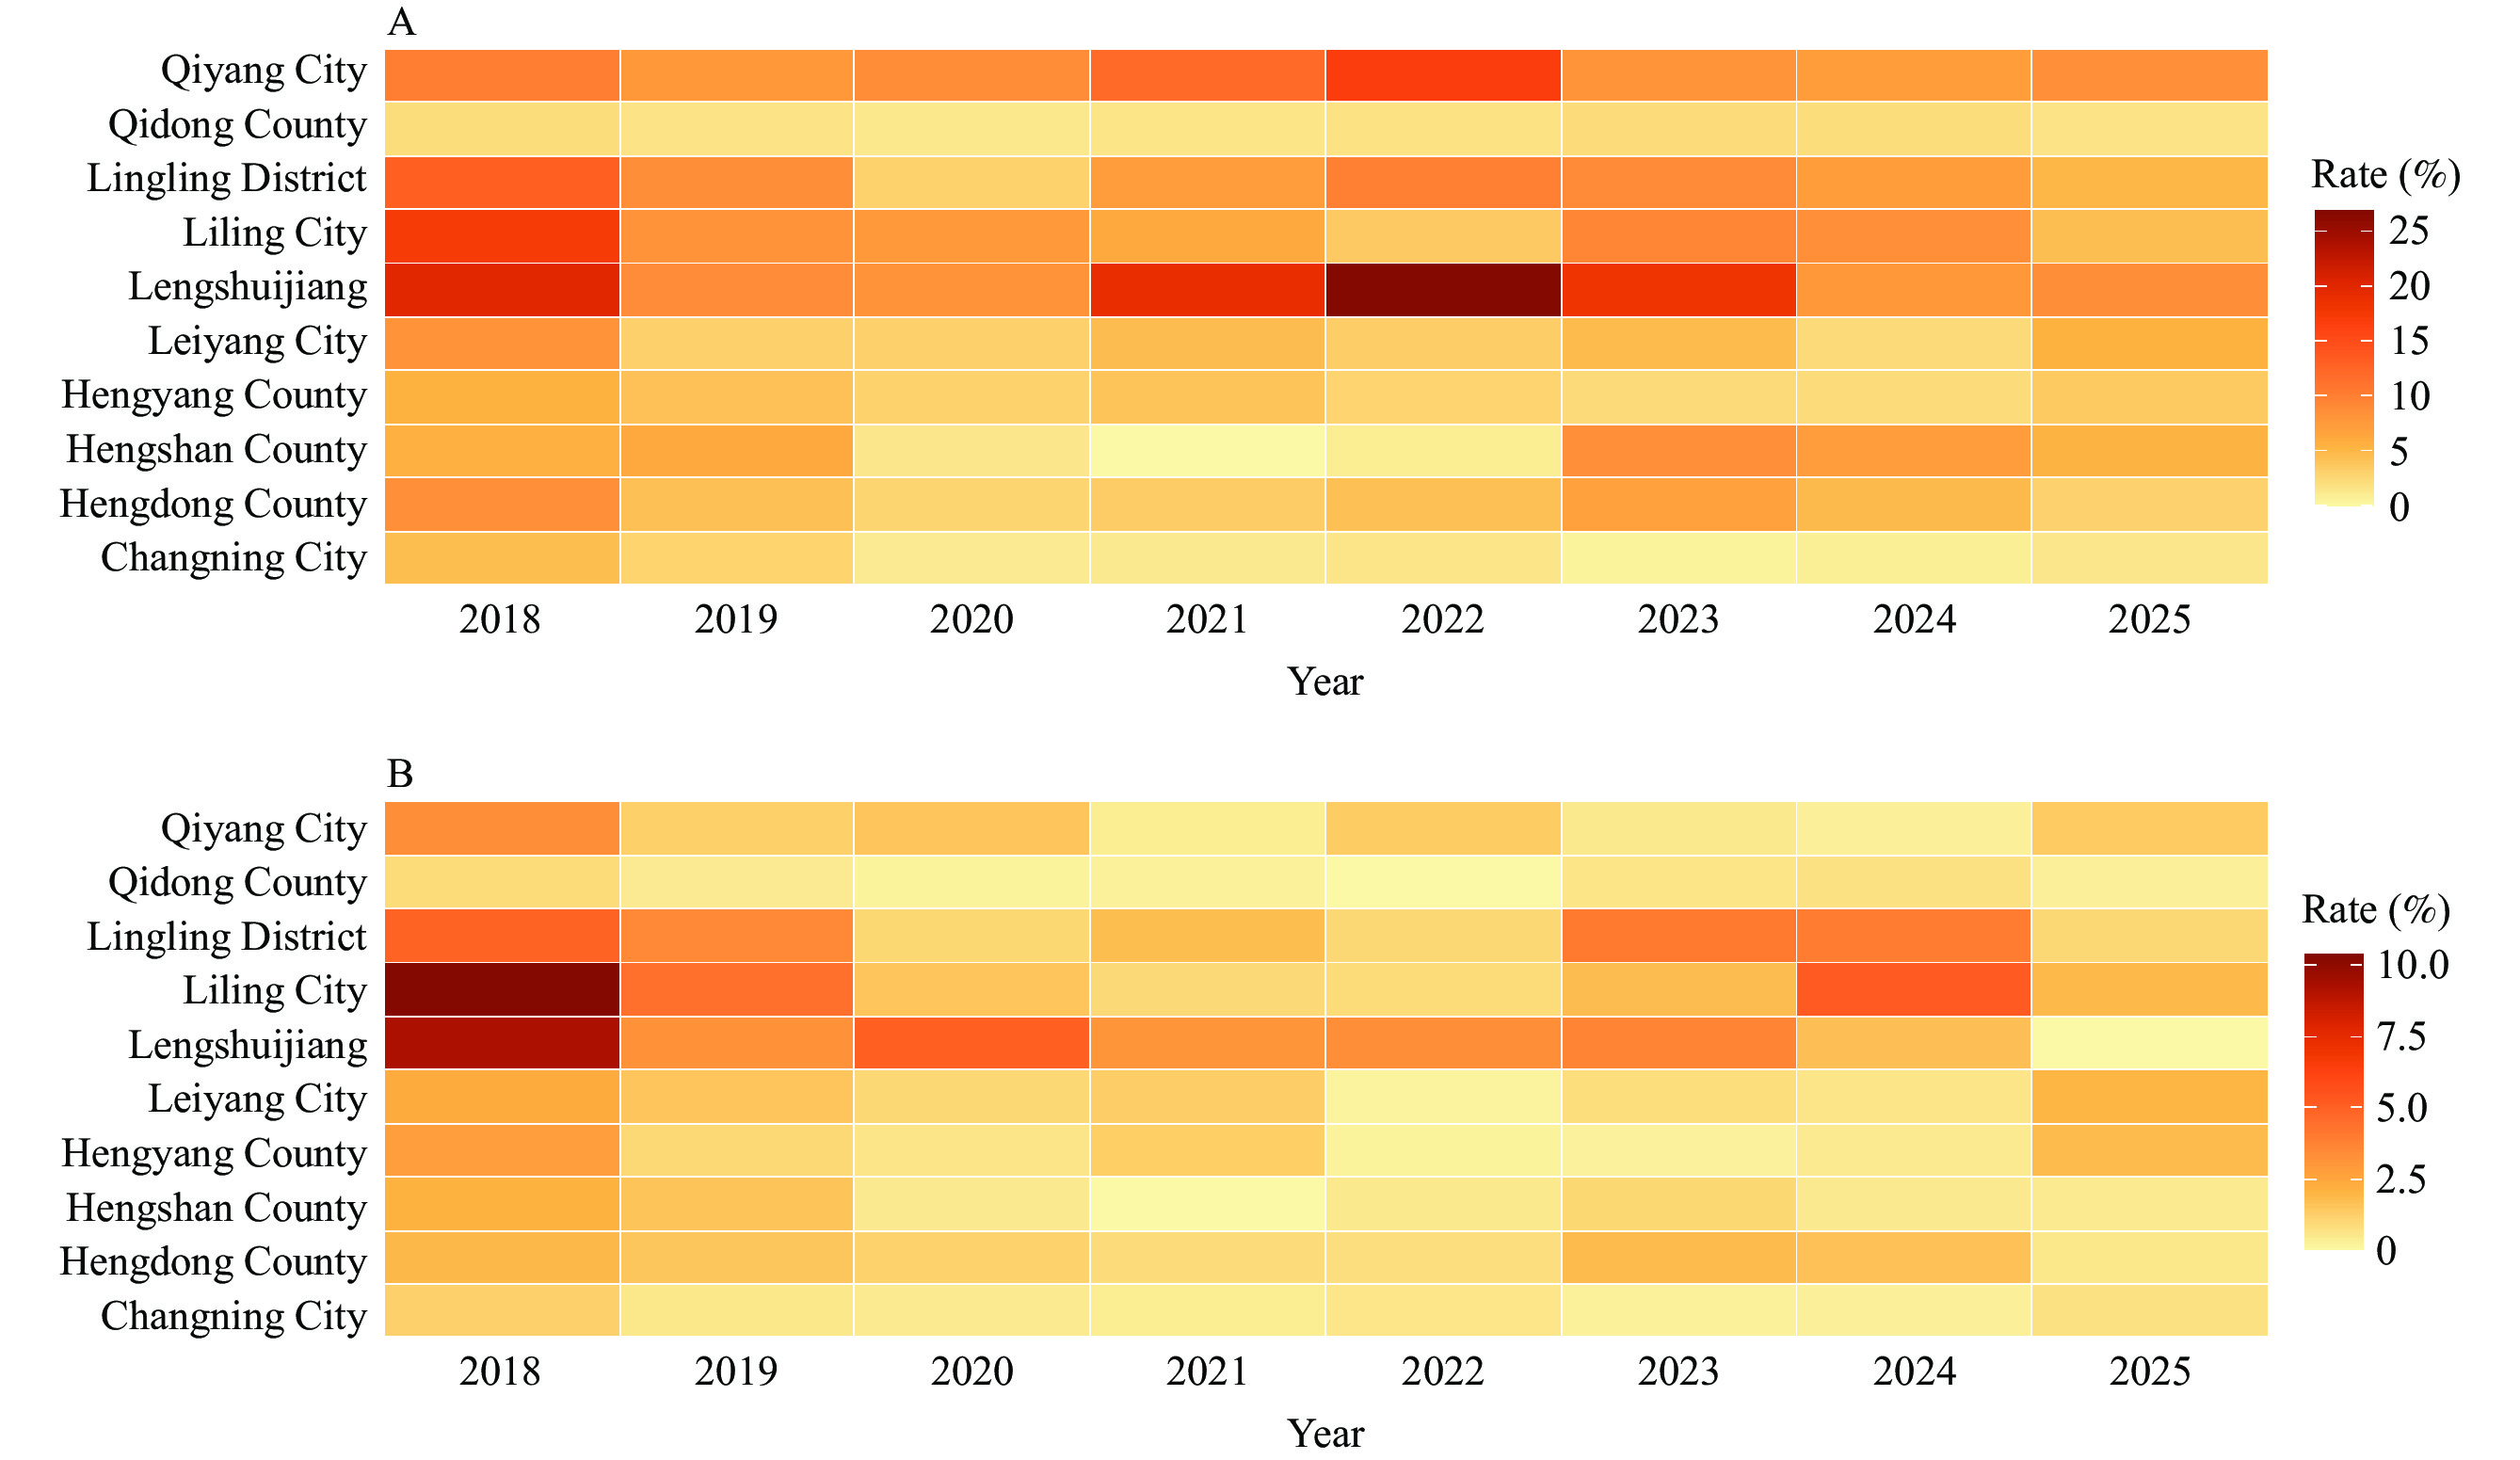 Figure 1.
Spatial distribution of county-level (A) rifampicin-resistant tuberculosis and (B) multidrug-resistant tuberculosis rates in Hunan Province, China, 2018–2025.
Abbreviation: RR-TB=rifampicin-resistant tuberculosis; MDR-TB=multidrug-resistant tuberculosis.We used a multilevel mixed-effects negative binomial regression model with a log link to analyze temporal trends in rifampicin-resistant tuberculosis (RR-TB) between 2018 and 2025, considering overdispersion and clustering at the county level.
If Yik denotes the number of RR-TB cases in the county during the year and nik denotes the corresponding number of tested cases, we assumed:
$$ \mathrm{Y}_{ \mathrm{ik}}\sim \mathrm{Negative\; Binomial(\mu}_{ \mathrm{ik}},\theta ) $$ (1) Where $\mu_{\mathrm{ik}} $ is the expected count and $\theta $ is the dispersion parameter.
The model was as follows:
$$ \log (\mu_{ik})=\beta_0 +\beta_{1} {Year_k+\beta_{2}Period_k}+b_i+\log(n_{ik}) $$ (2) Where:
$\beta_0 $ is the fixed intercept.
$\beta_1 $ represents the annual temporal trend.
$\beta_2 $ represents the diagnostic period effect (2018–2020 vs. 2021–2025).
$b_i $~N(0,$\sigma _b^2 $) denotes the county-level random intercept.
$\log (n_{ik}) $ was included as an offset term.
County-specific deviations were estimated as best linear unbiased predictors (BLUPs).
After adjusting for testing volume and diagnostic period (2018–2020 vs. 2021–2025) to account for potential diagnostic shift bias, the multilevel negative binomial regression model showed a modest, though insignificant, annual decline in RR-TB rates (incidence rate ratio per year=0.97; 95% CI: 0.863–1.089). The values predicted by the model closely paralleled the observed annual rates (Figure 2A), capturing the initial fluctuation followed by a gradual downward trend over time. The shaded areas represent the 95% CI of the model-predicted estimates. Although a general downward trend was observed across most counties, country-specific projected trajectories — estimated using a multilevel model — revealed persistent and statistically significant heterogeneity throughout the study period (Figure 2B).
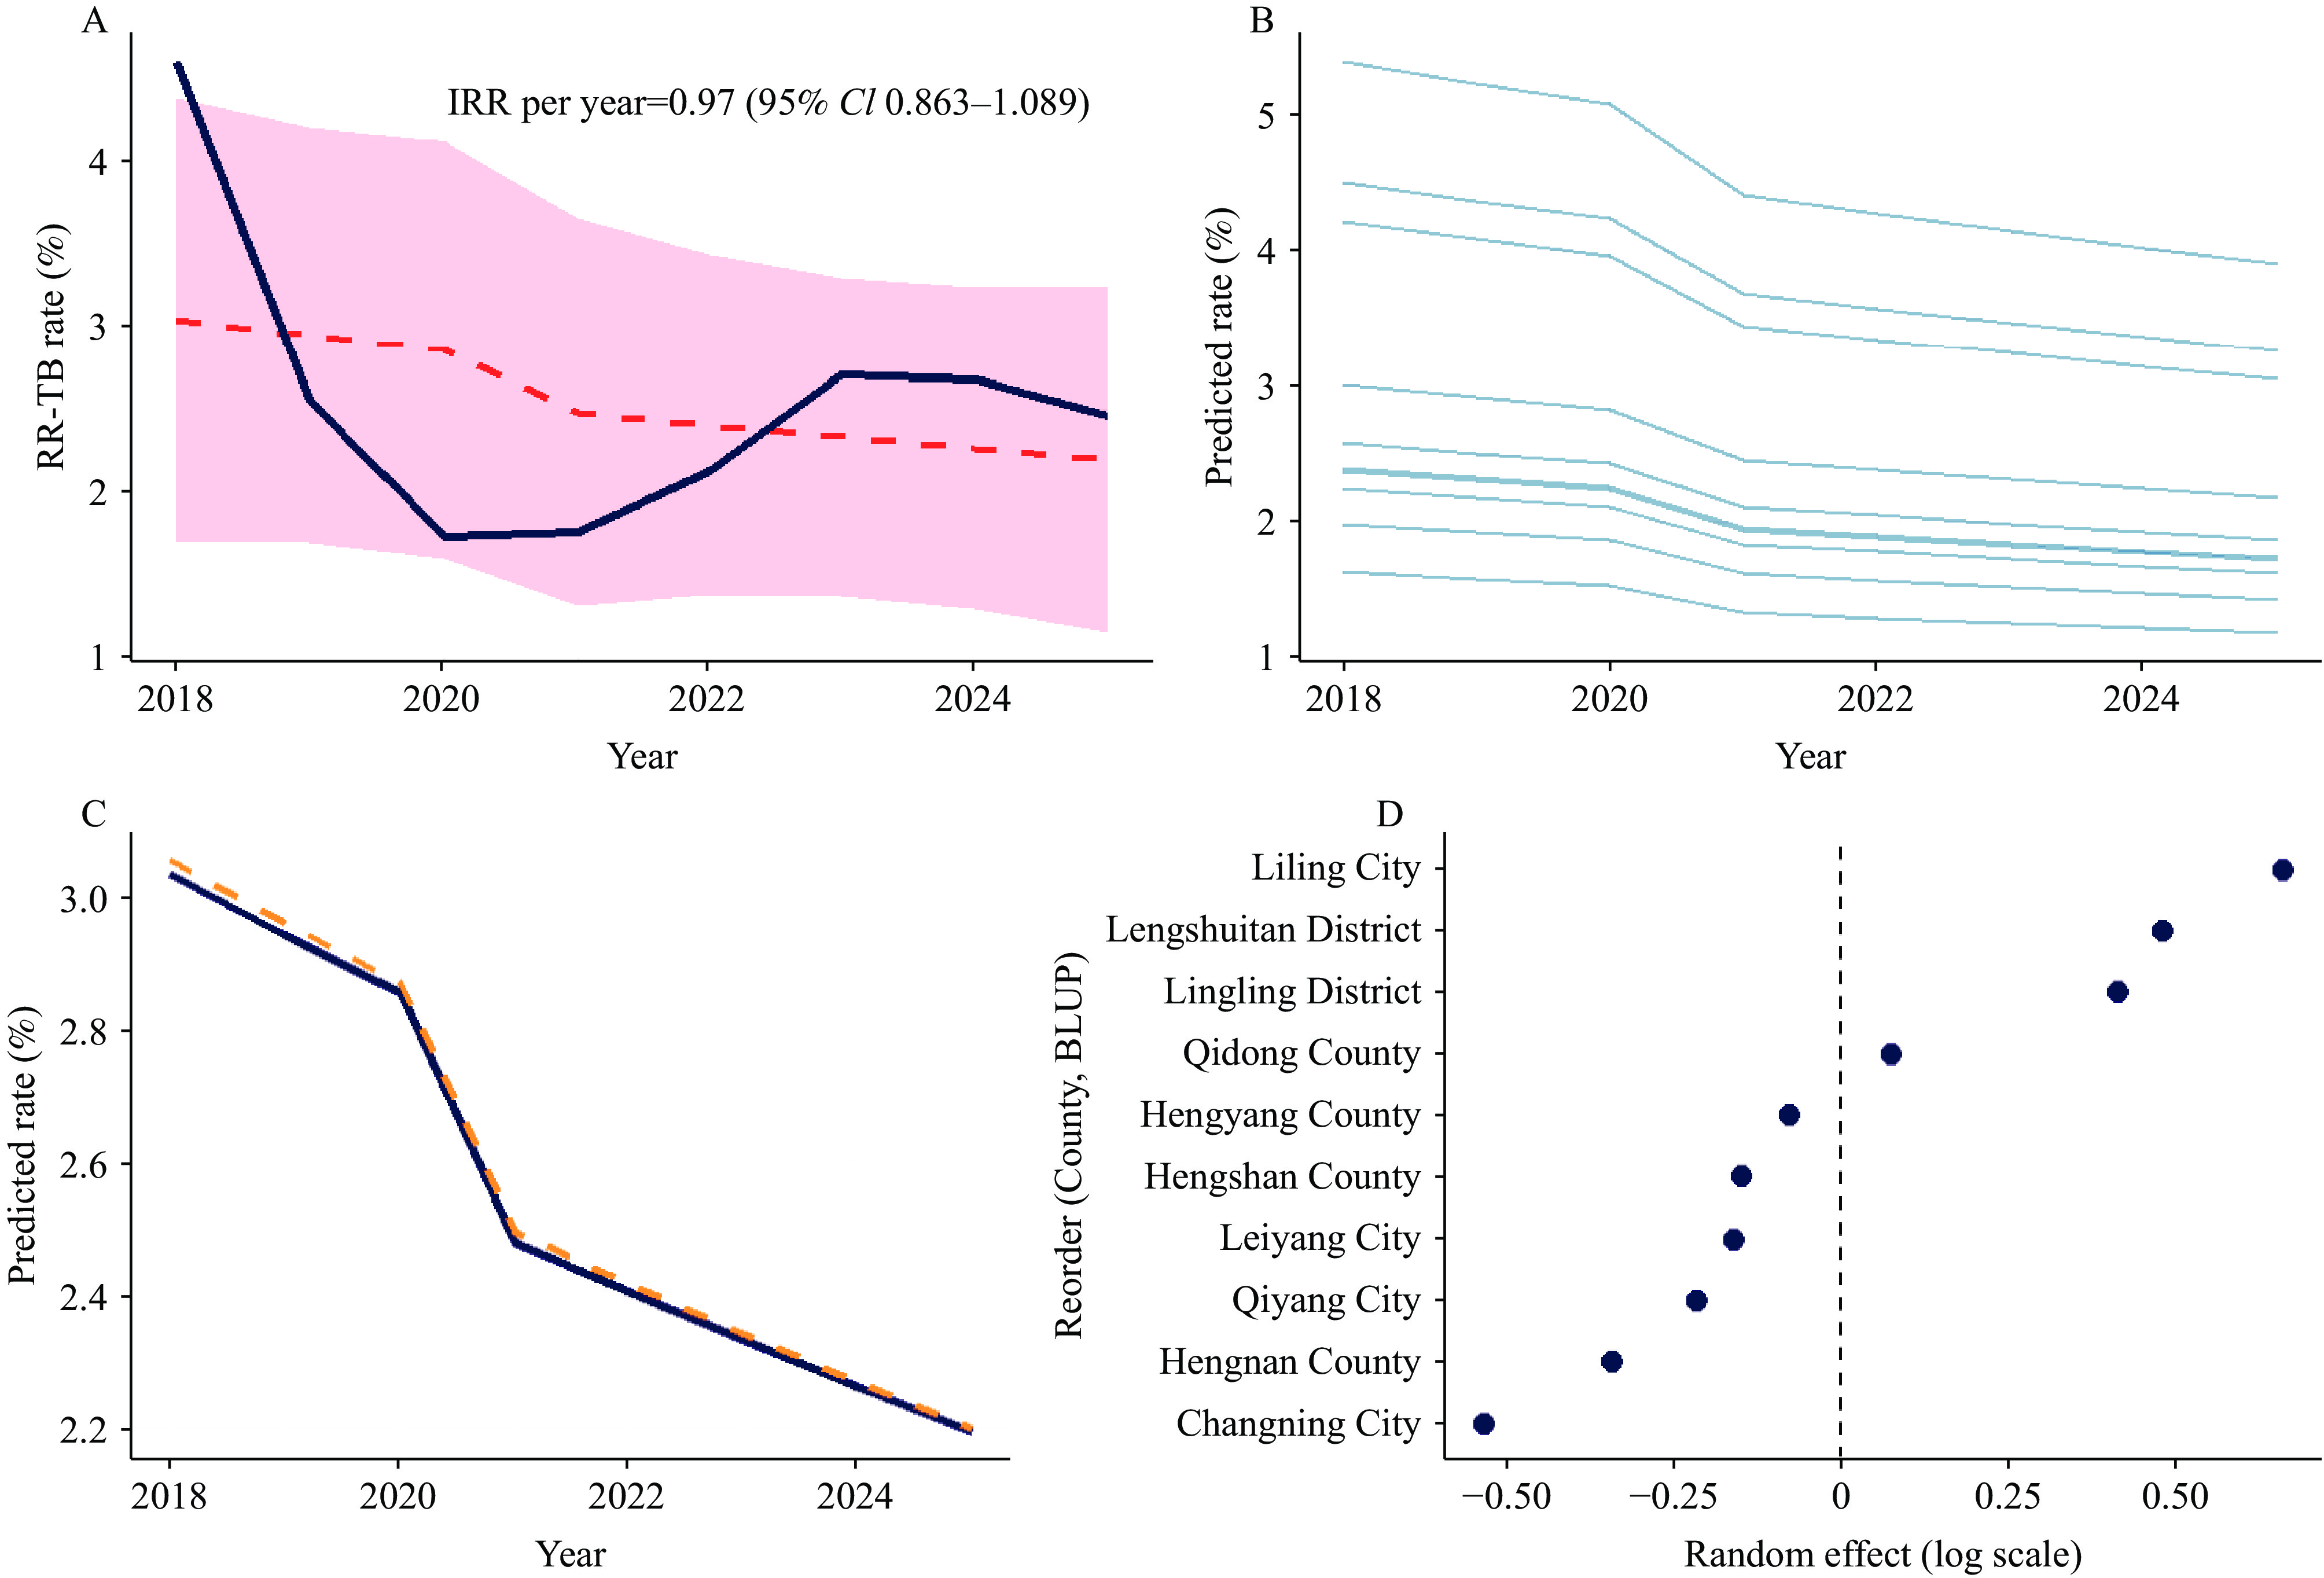 Figure 2.
Multilevel negative binomial regression analysis of temporal trends in RR-TB rates, adjusted for diagnostic period, Hunan Province, China, 2018–2025.
Abbreviation: RR-TB=rifampicin-resistant tuberculosis.Sensitivity analyses (Figure 2C) comparing the negative binomial and Poisson regression models yielded highly consistent temporal patterns, supporting the robustness of the findings. The intraclass correlation coefficient (ICC) indicated a measurable proportion of total variability attributable to differences between counties, reflecting geographic heterogeneity in RR-TB risk. County-level random effects, expressed as BLUPs, further demonstrate significant spatial variation, with several counties exhibiting model-adjusted risks that were either significantly higher or lower than the overall mean (Figure 2D).
-
The results showed that the prevalence of resistance to first-line anti-TB drugs was 5.08% and the RR-TB rate was 2.13%, which was lower than previously reported studies (4–5). The drug resistance rate in Hunan declined from 7.78% in 2018 to 3.48% in 2020. This is attributable to the restricted scope of molecular drug susceptibility tests (DSTs), the epidemiological impact of COVID-19, and associated provincial containment measures (6).
A modest rebound in anti-TB drug resistance was observed during the immediate post-pandemic period. This rate stabilized at 4.42% in 2024 and 4.60% in 2025. This trend coincided with the progressive implementation of intensified TB control interventions, including expanded comprehensive DSTs, standardized first- and second-line treatment regimens, enhanced surveillance among high-risk populations, and strengthened referral pathways, contributing to transmission reductions (7). Furthermore, molecular testing accounted for only 69.05% of DSTs during 2018–2020 but rose to 82.79% during 2021–2025 following a nationwide scale-up of rapid molecular assays, establishing it as the dominant DST modality. These findings indicate a deliberate, province-wide strategic transition toward rapid, molecular-based diagnostics to strengthen surveillance.
Univariate analysis identified that the independent risk factors significantly associated with drug resistance were retreatment status, middle age (25–64 years), diabetes mellitus, and geographic region, consistent with a previous study (8). Lengshuitan employed identical laboratory methodologies at all other study sites, including the same DST platform (proportional method combined with Xpert MTB/RIF), the same panel of first-line anti-TB drugs, and strictly standardized experimental procedures and interpretation criteria. These procedures were governed by a unified and centrally validated standard laboratory operating procedure. No methodological or procedural heterogeneity was found across the sites. The elevated resistance prevalence observed in Lengshuitan, despite methodological equivalence, suggests that non-laboratory factors may have caused this disparity, warranting detailed investigation. After adjusting for specimen testing volume, the annual incidence of drug resistance declined by 4.0%, with statistically consistent downward trends observed across all administrative regions. These results underscore the critical importance of adherence to standardized treatment regimens and implementing stratified, risk-informed clinical management, particularly for individuals with prior treatment histories, metabolic comorbidities, or residents in high-burden areas. Our results agree with recent provincial epidemiological studies linking intensified active surveillance, protocol-driven clinical decision-making, and systematic quality assurance of diagnostic and therapeutic practices to reduce TB drug resistance in Hunan (5,7). The model-predicted trends aligned closely with the observed temporal patterns and demonstrated consistent downward trajectories across all districts.
Our findings demonstrate marked spatiotemporal heterogeneity in TB drug resistance across Hunan. The drug resistance rate declined during COVID-19, followed by a modest and temporary rebound during the immediate post-pandemic period and a sustained downward trajectory, consistent with reported global epidemiological patterns (9). RR-TB and MDR-TB levels remained consistently low and stable throughout the study period, reflecting the effectiveness of early case identification and prompt therapeutic initiation. Substantial inter-county variation was quantified using an intraclass correlation of 0.11, highlighting the need for geographically tailored and precise public health interventions in high-burden subregions. Interventions should prioritize comprehensive DSTs, integrated referral systems, and data-driven resource allocation. Policymakers should consider regional disparities, age, sex-related vulnerabilities, and dynamic sociodemographic changes (10).
Model diagnostics confirmed the suitability of the negative binomial regression framework in yielding statistically robust and policy-relevant estimates to guide evidence-based TB control strategies at the provincial level.
Strengthening patient adherence, intensifying drug resistance screening in vulnerable populations, and strengthening tuberculosis control interventions in high-burden areas are epidemiologically feasible and operationally critical. These measures can be effectively integrated into the existing national tuberculosis control framework by leveraging established infrastructure, cost-effectiveness, and scalability. Implementing these strategies requires coordinated collaboration across all levels of healthcare. From a public health perspective, such interventions facilitate the early detection and standardized management of drug-resistant TB, thereby reducing transmission among susceptible groups and in high-prevalence regions, and contributing to tangible progress in curbing drug-resistant TB.
Our study had several limitations. First, for some patients with etiologically confirmed TB, only smear results were available, which precluded further analysis of drug resistance. Second, the demographic and diagnostic data were derived from routine surveillance systems; hence, the analytical outcomes may have been affected by data entry quality and availability. Third, since 2021, with the widespread adoption of molecular biology testing methods, the proportion of facilities using these techniques increased significantly. However, owing to methodological constraints, these tests only assessed RIF resistance and did not include INH resistance, potentially leading to an underestimation of drug resistance rates.
-
Approved by the Medical Ethics Committee of Hunan Institute for Tuberculosis Control (Hunan Chest Hospital). This study was approved in accordance with the 1975 Declaration of Helsinki and its later amendments, or comparable ethical standards. Written informed consent was obtained from all participants or their legal guardians.
-
LetPub (www.letpub.com.cn) for linguistic assistance during the preparation of this manuscript.
HTML
| Citation: |

|