
 Download:


-
The prevalence of metabolic diseases has risen steadily in recent years, driven by shifting lifestyle patterns and accelerating population aging (1). Projections indicate that by 2040, metabolic risk factors — including hypertension, elevated body mass index (BMI), and high fasting plasma glucose — will rank among the leading contributors to years of life lost worldwide (2). Currently, no consensus exists on a standardized definition of metabolic health (3). In clinical practice, metabolic health assessment largely follows the diagnostic criteria for metabolic syndrome, which rely on identifying specific abnormalities and satisfying a minimum threshold count (4). For the general population, however, systematic and quantifiable tools capable of comprehensive metabolic evaluation remain scarce, hampering early identification of at-risk individuals and timely intervention. To address this gap, the present study developed an evidence-based metabolic health assessment tool intended for public use — equipping individuals with the means to monitor their metabolic status, heighten health awareness, and take an active role in improving their own well-being through informed self-care.
HTML
-
To select the 11 metabolic risk factors, we searched PubMed, the Cochrane Library, and the China National Knowledge Infrastructure (CNKI) for studies on metabolic risk factors associated with prominent health burden, covering the period from January 2015 to June 2024. We selected candidate factors according to three primary criteria: 1) relevance to metabolic diseases with substantial global health burden, 2) accessibility through standard health examinations or general public awareness, and 3) modifiability at the individual level. Applying these criteria, we identified nine directly modifiable risk indicators as core candidates for the Delphi consultation: smoking, alcohol consumption, BMI, waist-to-height ratio (WHtR), fasting blood glucose (FBG), blood pressure, blood lipids, serum uric acid, and metabolic-associated fatty liver disease (MAFLD). To anchor the assessment within a personal risk context, we supplemented these nine indicators with two non-modifiable stratifiers: age and family history. Sex was excluded as a separate variable because the key metabolic differences attributable to sex — such as body fat distribution, lipid profiles, and hepatic steatosis—are more directly and actionably captured by specific indicators already included in our pool, namely WHtR, blood lipids, and MAFLD. In total, eleven indicators were carried forward into the Delphi consultation process.
We then invited nine experts with over 10 years of professional experience in medicine, nutrition, public health, and pharmacy to participate in a two-round Delphi survey to validate these indicators. The first round, conducted in June 2024, gathered data on expert demographics, self-rated authority, and opinions regarding the importance of each indicator. Experts rated the importance of each indicator on a 5-point Likert scale; any indicator that failed to reach sufficient consensus was re-evaluated in the second round to determine whether it should be retained. Enthusiasm was measured by the questionnaire response rate, while authority was quantified using the authority coefficient (Cr), calculated from the Coefficient of Familiarity (Cs) and the Coefficient of Judgment Basis (Ca). Agreement was evaluated using Kendall’s W. All indices ranged from 0 to 1, with higher values indicating greater reliability. We further characterized the concentration of expert opinions through the mean, standard deviation, and coefficient of variation (CV) of the importance scores; indicators with a mean score below 3.5 or a CV above 0.25 were subject to re-evaluation in the second round. Complete consensus was defined as 100% agreement among all experts on the final indicator selection (5).
The study drew data from the China Chronic Disease and Risk Factor Surveillance (CCDRFS) (6). The CCDRFS employed multistage stratified cluster sampling across 31 provinces to ensure that the sample was representative of the general Chinese population. Mortality outcomes were ascertained from the National Mortality Surveillance System (NMSS), and the two datasets were linked using the resident ID number as the individual identifier. To protect participant confidentiality, resident IDs were subsequently removed from the linked dataset and replaced with anonymized serial numbers. We selected the 2018 wave of the CCDRFS for analysis because it represents the most recent available data and predates the COVID-19 pandemic, thereby avoiding the confounding influence of the pandemic on mortality outcomes. The final analytic sample comprised 184,509 adults drawn from 298 national Disease Surveillance Points (DSPs).
A mortality event was recorded if death occurred between the date of recruitment and the end of follow-up (censoring date: December 31, 2022). Data for the 11 candidate indicators were collected through a two-step process. First, trained staff obtained information on age, smoking status, alcohol consumption, and family history through structured face-to-face interviews. Second, a standardized physical examination was conducted to measure height, weight, waist circumference, FBG, blood pressure, blood lipids, and serum uric acid; BMI and WHtR were subsequently calculated from these anthropometric measurements. MAFLD status was determined in accordance with the international expert consensus statement (7).
To calculate indicator weights, we fitted a multivariable Cox proportional hazards model estimating associations between the 11 indicators and all-cause mortality. To facilitate practical public health application, we derived relative contribution weights directly from non-standardized regression coefficients ($ \beta $) using the formula:
$$ {W}_{i}=\left(\frac{{\beta }_{i}}{\sum\nolimits_{j=1}^{11}{\beta }_{j}}\right)\times 100 $$ After generating the weights, we applied the following formula to estimate the Metabolic Health Index score (MHI score):
$$ MHI=\sum \limits_{i=1}^{11}\left({W}_{i}\times {S}_{i}\right) . $$ $ {W}_{i} $ denotes the weight assigned to each indicator, whereas $ {S}_{i} $ represents its corresponding scoring function, which maps raw values to a normalized score between 0 and 1. We defined scoring rules a priori for each indicator type. For binary variables (e.g., family history), the score is either 0 (risk present) or 1 (risk absent). For ordinal or continuous variables, the scoring function distinguishes three risk states: optimal (score=1), suboptimal (score between 0 and 1, calculated via linear interpolation based on deviation from the optimal threshold), and salient risk (score=0). We derived the specific thresholds defining each state from established clinical guidelines and consensus literature. The complete scoring algorithm is detailed in the
Supplementary Table S1 .To complement the single composite metric of the Metabolic Health Index (MHI) — which reflects overall metabolic status — we introduced the Metabolic Health Phenotype classification. We developed this framework on the basis of evidence that individuals with distinct metabolic profiles, such as metabolically healthy obesity or metabolically unhealthy normal weight, exhibit markedly different cardiometabolic risk levels (8). By capturing these phenotypic distinctions, the classification system provides actionable stratification for both public health practice and individual self-management.
The research applied this classification system, comprising 7 major categories and 13 specific subtypes, to all participants. We first dichotomized individuals as either “Metabolically Healthy” or “Metabolically At-Risk” based on core clinical indicators, then further subclassified those in the “At-Risk” group according to the specific patterns and severity of their risk factors (e.g., elevated fasting glucose and hypoglycemia) (
Supplementary Table S2 ). Finally, we computed MHI scores for the entire sample and characterized the distributions of both the MHI and the metabolic health phenotypes — overall and stratified by sex and age group.
-
In the first round of the Delphi consultation, the questionnaire response rate reached 100%, with an authority coefficient of 0.96 and a Kendall’s W of 0.906 (χ2=224.646, P<0.001), reflecting high levels of expert enthusiasm, authority, and consensus. In this round, alcohol consumption (mean=3.375), total cholesterol (CV=0.327), and smoking (CV=0.359) failed to meet the inclusion criteria and were therefore re-evaluated in the second round. Following the second round, consensus was reached on all three indicators, and they were subsequently retained, resulting in the inclusion of all candidate indicators in the final MHI model.
The relative contribution weights of the indicators were distributed as follows: age (4.08%), smoking (12.37%), alcohol consumption (9.49%), BMI (1.27%), WHtR (4.91%), FBG (35.38%), blood pressure (9.96%), blood lipids (0.81%), serum uric acid (6.83%), MAFLD (7.74%), and family history (7.17%) (Figure 1).
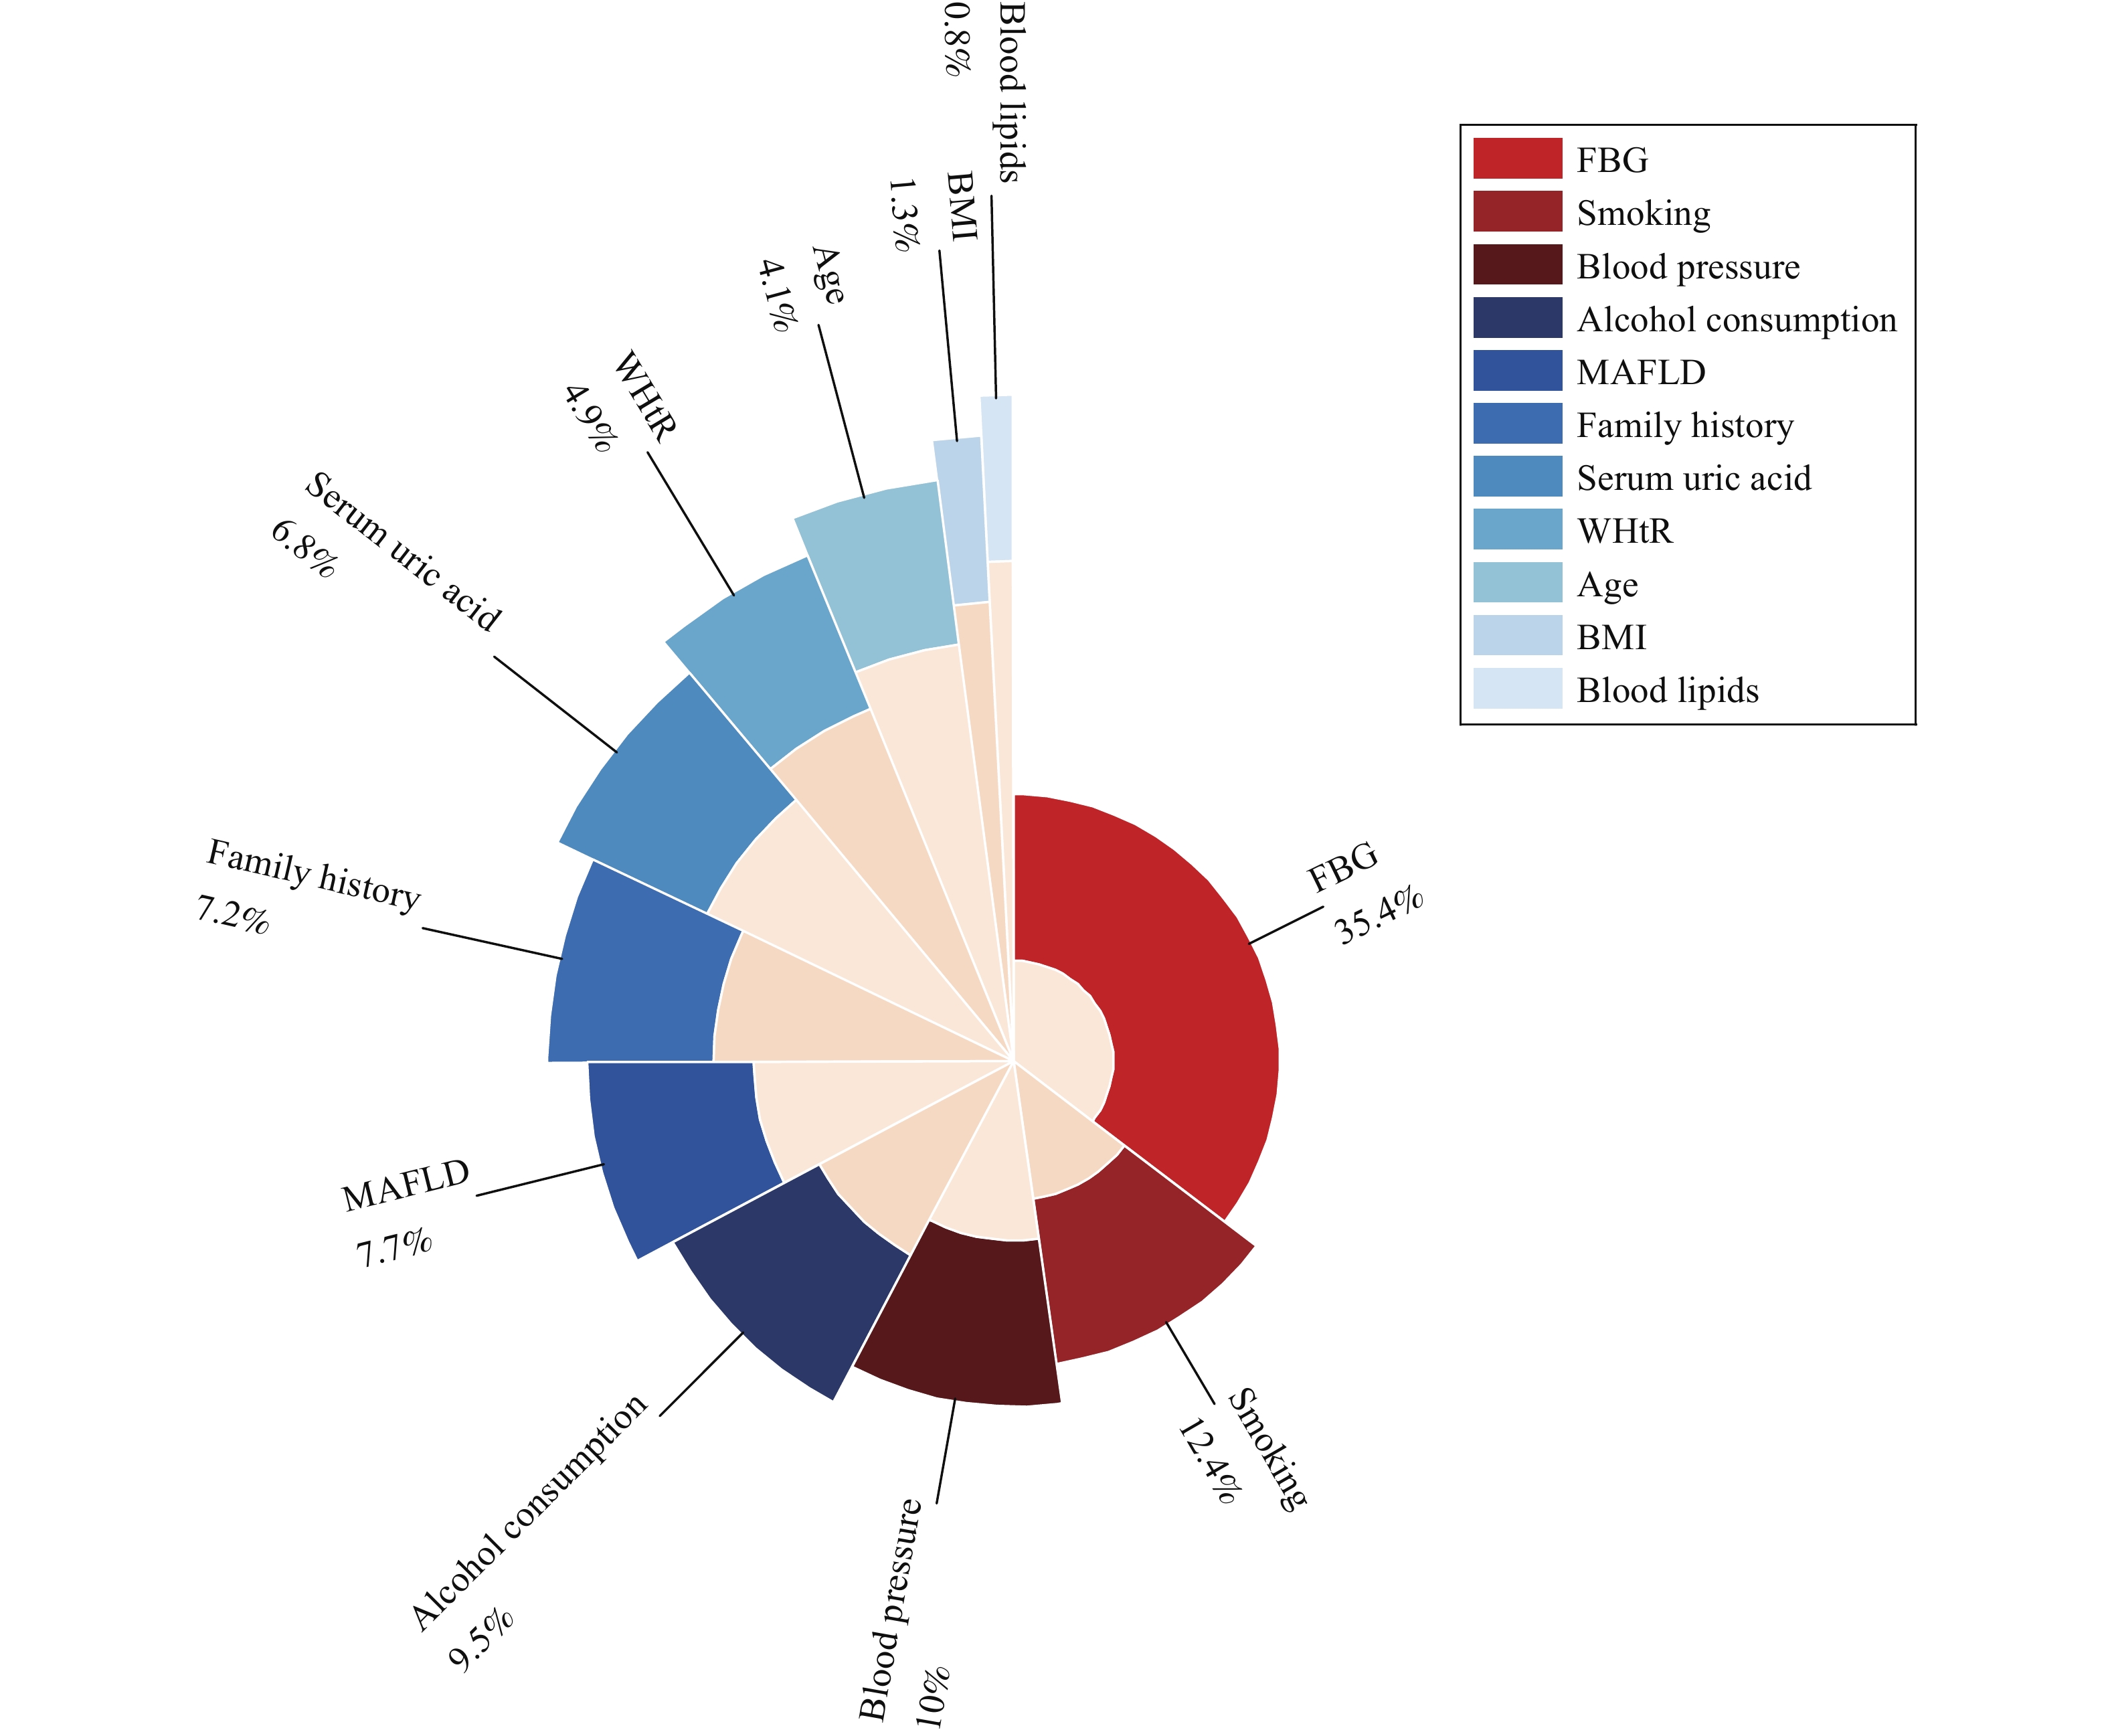 Figure 1.
Distribution of weights assigned to the 11 MHI indicators.
Abbreviation: BMI=body mass index; WHtR=waist-to-height ratio; FBG=fasting blood glucose; MAFLD=metabolic dysfunction-associated fatty liver disease.The general population demonstrated moderate to high metabolic health levels, with MHI scores spanning an interquartile range of 66.59 to 86.26. Females consistently outscored males across all age groups, while scores generally declined with advancing age — though in certain strata, participants aged ≥70 years achieved higher scores than those in the 60–69 years group (Figure 2).
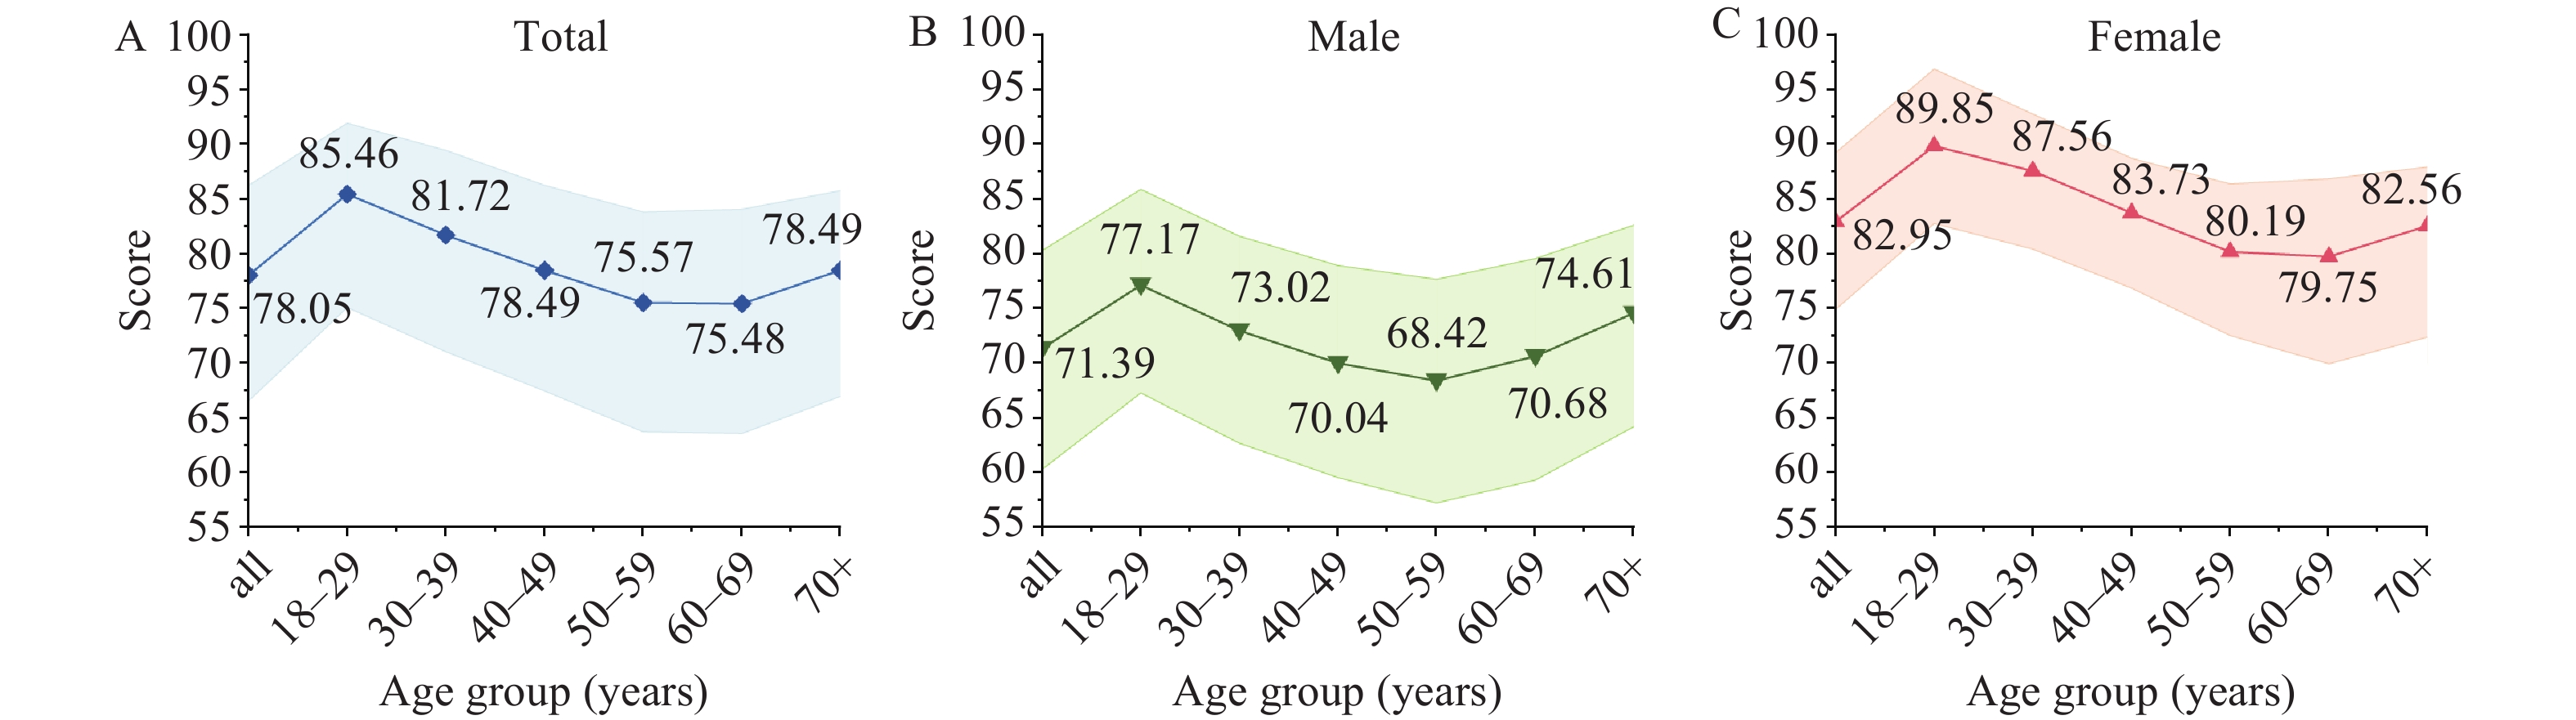 Figure 2.
Age-related trends in MHI scores across different population groups. (A) Trends in MHI scores by age in the overall population; (B) Trends in MHI scores by age in males; (C) Trends in MHI scores by age in females.
Note: The shaded areas are the interquartile range.
Abbreviation: MHI=metabolic health index.
Further stratification by educational attainment and place of residence revealed a notable divergence by sex: among young women, higher educational attainment was associated with slightly elevated MHI scores, whereas among men, lower educational attainment corresponded to higher scores across most age groups (
Supplementary Figure S1 ).When scores were categorized into 10-point intervals, more than half of all study participants (54.5%) fell within the 71–90 range, and the proportion occupying higher score ranges declined progressively with age (Table 1).
Score Age group (years), n (%) 18–29 30–39 40–49 50–59 60–69 70+ Total ≤10 1 (0.0) 3 (0.0) 17 (0.0) 23 (0.1) 28 (0.1) 8 (0.0) 80 (0.0) 11–20 12 (0.1) 54 (0.2) 177 (0.4) 271 (0.6) 232 (0.6) 45 (0.2) 791 (0.4) 21–30 67 (0.4) 145 (0.7) 465 (1.2) 796 (1.8) 742 (1.8) 244 (1.3) 2,459 (1.4) 31–40 159 (1.0) 326 (1.5) 952 (2.4) 1,639 (3.7) 1,853 (4.6) 722 (3.8) 5,651 (3.1) 41–50 321 (2.0) 660 (3.0) 1,732 (4.3) 2,541 (5.7) 2,465 (6.1) 1,236 (6.5) 8,955 (4.9) 51–60 746 (4.7) 1,424 (6.5) 2,935 (7.3) 3,716 (8.4) 3,094 (7.7) 1,268 (6.7) 13,183 (7.3) 61–70 1,553 (9.8) 2,458 (11.3) 5,412 (13.5) 6,851 (15.5) 6,122 (15.3) 2,143 (11.2) 24,539 (13.6) 71–80 2,750 (17.3) 4,586 (21.1) 10,296 (25.7) 12,238 (27.7) 10,757 (26.8) 4,656 (24.4) 45,283 (25.0) 81–89 4,907 (30.9) 7,153 (32.9) 12,620 (31.6) 11,795 (26.7) 10,382 (25.9) 6,510 (34.2) 53,367 (29.5) ≥90 5,356 (33.7) 4,951 (22.8) 5,389 (13.5) 4,348 (9.8) 4,445 (11.1) 2,219 (11.6) 26,708 (14.8) Total 15,872 (100.0) 21,760 (100.0) 39,995 (100.0) 44,218 (100.0) 40,120 (100.0) 19,051 (100.0) 181,016 (100.0) Abbreviation: MHI=Metabolic Health Index. Table 1. MHI score distribution and population composition by age group (years).
Across all age groups, the “mixed risk” subtype accounted for the largest share of metabolic health subtypes, and its prevalence increased steadily with age. Marked sex differences were also evident: women displayed an overall healthier metabolic profile, with a substantially greater proportion classified as the “healthy” subtype (3.356% of women vs. 0.520% of men). In contrast, men exhibited a considerably higher prevalence of hyperuricemia (1.063% of men vs. 0.214% of women), while women were more prone to obesity-related conditions (1.213% of women vs. 0.396% of men) (Table 2).
Subtype Male, n (%) Female, n (%) Total, n (%) High FBG A 92 (0.103) 96 (0.095) 188 (0.099) High FBG B 55 (0.062) 44 (0.044) 99 (0.052) Low FBG 128 (0.144) 230 (0.229) 358 (0.189) Low UA 3 (0.003) 24 (0.024) 27 (0.014) High UA 947 (1.063) 215 (0.214) 1,162 (0.613) Dyslipidemia 1,301 (1.461) 1,889 (1.879) 3,190 (1.682) Dyslipidemia–fatty liver risk 536 (0.602) 1,236 (1.229) 1,772 (0.935) Low BP 352 (0.395) 1,168 (1.162) 1,520 (0.802) High BP 7,463 (8.380) 7,004 (6.966) 14,467 (7.630) Overweight/obese 353 (0.396) 1,220 (1.213) 1,573 (0.830) Underweight 398 (0.447) 955 (0.950) 1,353 (0.714) Healthy 463 (0.520) 3,374 (3.356) 3,837 (2.024) Healthy–latent risk 2,343 (2.631) 3,164 (3.147) 5,507 (2.904) Mixed metabolic risks 74,628 (83.793) 79,924 (79.492) 154,552 (81.513) Abbreviation: FBG=fasting blood glucose; UA=uric acid; BP=blood pressure. Table 2. Distribution of metabolic health subtypes in the population.
-
In this study, we developed the MHI by integrating expert consensus with representative population data. Unlike conventional indicators that rely on a single biomarker or a binary diagnosis, this framework provides a comprehensive and continuous assessment of metabolic status. Specifically, the continuous MHI score overcomes the limitations of existing definitions by quantifying gradations of risk, thereby more faithfully reflecting the metabolic health landscape of the general Chinese population. Compared with existing metabolic assessment systems, the MHI offers a compelling combination of simplicity, practicality, and comprehensiveness. Its clearly defined and readily accessible indicators substantially lower application barriers and monitoring costs, providing an efficient solution for large-scale population screening. Moreover, the MHI more accurately captures the distributional characteristics of metabolic risk, enabling precise risk stratification and facilitating the early identification of sub-healthy individuals.
All-cause mortality serves as the endpoint for constructing the MHI, with data drawn from the NMSS. This approach yields reliable results that are less susceptible to information gaps and diagnostic variation. Given the absence of uniform standards for defining metabolic abnormalities, selecting specific metabolic outcomes risks confounding by missing data or interdependent indicators; using all-cause mortality therefore frees the MHI from dependence on any single metric or disease category. Further supporting this choice, the China National Mortality Surveillance Data Report (2021) shows that cardiovascular disease (CVD), cancer, and metabolic diseases collectively account for over 70% of all deaths (48.47%, 23.02%, and 3.12%, respectively). As the leading cause of death, CVD has a pathological basis largely rooted in metabolic dysfunction (9). With respect to cancer, recent evidence demonstrates that the global burden of metabolism-related tumors is rising, driven by elevated BMI and hyperglycemia (10). Together, these data indicate that all-cause mortality broadly captures the mortality risk attributable to metabolic abnormalities. Reinforcing this conclusion, a sensitivity analysis using metabolism-related mortality and metabolic health as alternative outcomes produced results highly consistent with those for all-cause mortality, further validating all-cause mortality as a robust and representative surrogate indicator of metabolic health.
In the MHI model constructed using nationally representative data from the CCDRFS, FBG contributed the highest relative scores to the overall metabolic health assessment. This finding aligns with prior studies demonstrating that hyperglycemia is a key risk factor for disability and death, and that global fasting glucose levels and their associated disease burden continue to rise (11). Beyond glycemic status, the relative score distributions of the remaining indicators underscore the multidimensional nature of metabolic health (12), highlighting that effective population-level interventions must address multiple modifiable risk factors in concert rather than targeting any single variable in isolation.
To characterize population metabolic profiles comprehensively, we developed a dedicated classification system. By applying optimized threshold criteria, this system identifies individuals in a potential subclinical risk state, enabling targeted early intervention before metabolic dysfunction progresses to irreversible pathological changes.
MHI results revealed relatively high average scores across the study population. Paradoxically, however, subtype analysis identified mixed metabolic risk as the most prevalent metabolic phenotype, whereas the proportions of metabolically healthy individuals and other subtypes remained comparatively small. This discrepancy between elevated MHI scores and the high prevalence of mixed metabolic risk likely reflects the rigorous criteria applied to define optimal metabolic health. Accordingly, the MHI score and subtype classification capture complementary dimensions of metabolic status: the former quantifies the overall degree of health impairment, while the latter delineates specific patterns of risk. By doing so, this dual framework enhances the early detection of individuals with mild metabolic abnormalities, thereby supporting a strategic shift toward earlier and more targeted preventive interventions.
Notably, the age-related decline in MHI scores was evident across all sociodemographic strata, and males consistently exhibited lower MHI scores than females regardless of residential setting or educational attainment. This persistent sex difference likely reflects underlying biological predispositions (13) and a higher prevalence of adverse lifestyle behaviors among males (14). Educational attainment further revealed an inverse gradient in metabolic health among males, whereby lower educational levels corresponded to higher MHI scores. This seemingly paradoxical pattern may be partly explained by greater participation in high-intensity occupational physical activity among lower-educated manual workers, whereas more highly educated males tend to hold positions characterized by prolonged sedentary work (15).
Similarly, individuals aged ≥70 years exhibited higher mean MHI scores than those in the 60–69 age group. Although survivorship bias may partly account for this elevation in the oldest cohort, sensitivity analyses employing standardized coefficients further corroborated the primary findings. Together, these results indicate that the observed age-related trajectory is a robust phenomenon, independent of the specific scoring methodology applied.
Subtype distribution analysis further revealed clear age-dependent transitions: the prevalence of metabolically healthy individuals declined progressively with age, accompanied by a concomitant rise in mixed metabolic risk patterns. These shifts most likely stem from age-related physiological deterioration and the cumulative burden of metabolic risk factors over time (16).
Because it relies exclusively on routine, low-cost indicators, the index enables rapid risk stratification across diverse settings. Beyond its immediate utility in screening, the MHI serves as a robust instrument for evidence-based policy development and intervention planning. Its greatest potential for future implementation lies in integration within digital health infrastructures, where it can support dynamic surveillance and the long-term evaluation of chronic disease prevention programs.
Nevertheless, several limitations merit acknowledgment. The weights were derived to facilitate practical application, and their magnitudes are therefore influenced by measurement units; they should be interpreted primarily as contributions to the composite index rather than as absolute effect sizes. Although the data used in this study demonstrate reasonable representativeness, additional external validation is needed to confirm the model’s generalizability across broader populations.
In summary, by integrating quantitative scoring with clinical characterization, the MHI provides a scalable, multidimensional framework for population-level health management. Future research should expand the model’s applicability through continuous optimization across diverse regions, ultimately strengthening its utility for metabolic health assessment.
-
All staff members who contributed to data collection and participated in this study.
-
Approved by the Institutional Review Board of the National Center for Chronic and Non-Communicable Disease Control and Prevention, Chinese Center for Disease Control and Prevention (Approval No. 202458).
| Citation: |

|