
 Download:


-
Introduction: Metabolic multimorbidity is rising sharply in China and is closely linked to modifiable lifestyle behaviors; however, the dynamic transitions between metabolic disease states and the stage-specific effects of lifestyle factors on those transitions remain poorly understood.
Methods: We enrolled 9,673 participants from the Health Omics Preventive Examination Program (April 2019 – December 2024), each with at least two follow-up visits (median follow-up: 3.07 years; interquartile range: 1.09 years). A Markov multi-state model was used to evaluate the effects of eight lifestyle factors — smoking, alcohol consumption, physical activity, sleep duration, dietary oil intake, taste preference, and two dietary pattern scores — on transitions between disease states.
Results: At baseline, multimorbidity prevalence was 24.14%, with a substantially higher rate in males (40.92%) than in females (9.70%; P<0.05). Among single-disease conditions, hepatic steatosis conferred the greatest risk of progressing to multimorbidity. Lifestyle effects were markedly stage-specific: smoking [hazard ratio (HR)=2.44, 95% confidence interval (CI): 1.63, 3.65] and a high-salt diet (HR=2.28, 95% CI: 1.46, 3.55) significantly accelerated multimorbidity progression, whereas regular physical activity (HR=0.58, 95% CI: 0.40, 0.84) substantially reduced the risk of transitioning from single-disease to multimorbidity. These associations varied meaningfully by age and sex.
Conclusion: Lifestyle behaviors exhibit stage-specific associations with metabolic disease transitions, with the magnitude and direction of these effects differing by sex and age. These findings underscore the critical importance of implementing early, targeted, stage-specific lifestyle interventions to curb the growing burden of metabolic multimorbidity in China.
-
Metabolic diseases (MD) — including type 2 diabetes (T2D) and hypertension — share common pathophysiological mechanisms (1). In China, the prevalence of MD has risen steadily and frequently progresses to metabolic multimorbidity (MM; the coexistence of two or more metabolic diseases) (2), a condition associated with substantially higher risks of impaired physical function, cardiovascular events, and all-cause mortality (3).
Because metabolic diseases are largely preventable, a substantial body of research has examined associations between modifiable lifestyle factors and disease incidence (4). Traditional analytical frameworks, however, have concentrated on the onset of individual diseases, overlooking the dynamic “healthy–single disease–multimorbidity” trajectory and failing to distinguish the stage-specific effects of lifestyle factors across different phases of disease progression (5–6).
To address this gap, the present study applied a Markov multi-state model (MSM) to evaluate associations between eight lifestyle factors — smoking, alcohol consumption, physical activity, sleep duration, dietary oil intake, taste preference, and two dietary pattern scores — and both the incidence of five single metabolic diseases (SMD; hypertension, T2D, dyslipidemia, hepatic steatosis, and hyperuricemia) and the subsequent development of MM among Chinese adults. Obesity was excluded from the SMD framework because it frequently co-occurs with hepatic steatosis, which more accurately reflects central or visceral adiposity (7). By capturing the full disease progression continuum, this analysis aims to provide a comprehensive understanding of how lifestyle behaviors drive SMD onset and accelerate progression to MM, thereby informing chronic disease prevention strategies in the Chinese population.
This study drew on data from the Health Omics Preventive Examination (HOPE) Program (
Supplementary Material ), which enrolled 71,010 participants between April 2019 and December 2024 and collected baseline questionnaires alongside biospecimen data. Of these, 14,423 individuals had complete baseline disease data and at least two follow-up assessments. After further excluding those with missing data on more than 2 of the eight lifestyle factors, 9,673 participants remained in the final analytic sample.Lifestyle factors were assessed via baseline self-reported questionnaires. The five metabolic diseases were identified using a combination of clinical indicators, symptoms, self-reports, and medication use (
Supplementary Material ). MM was defined as the concurrent presence of two or more of these metabolic diseases. The follow-up period extended from the baseline examination to either the first diagnosis of metabolic multimorbidity or censoring on December 31, 2024. MSM was then applied to evaluate the effects of each lifestyle factor on transitions between metabolic disease states. All statistical analyses were two-sided and conducted using R software (version 4.3.1, R Core Team, Vienna, Austria).At baseline, the prevalence of T2D, hypertension, dyslipidemia, hyperuricemia, and hepatic steatosis stood at 2.23%, 13.45%, 22.85%, 21.00%, and 26.66%, respectively (
Supplementary Figure S1 ). Males demonstrated significantly higher prevalence across all five metabolic conditions compared with females (P<0.05). Hepatic steatosis was the most prevalent condition among males (43.46%), whereas dyslipidemia predominated among females (13.87%). Age-stratified analyses revealed distinct distributional patterns: hyperuricemia was most frequent among participants under 35 years of age (22.73%), while hypertension was most common among those over 55 years (52.74%). The prevalence of all metabolic conditions rose progressively with advancing age (P<0.05). Overall multimorbidity (MM) prevalence at baseline was 24.14%, markedly higher in males (40.92%) than in females (9.70%; P<0.05). Hepatic steatosis–related combinations represented the most common MM patterns both overall and within sex-specific strata (Supplementary Figure S1 ).Table 1 summarizes the baseline sociodemographic, lifestyle, and clinical characteristics of the study population, stratified by baseline disease status. The three groups differed significantly in age, sex, education level, and lifestyle behaviors (P<0.05). Both median age and the proportion of male participants increased progressively from the MD-free group through the SMD group to the MM group. Unhealthy lifestyle behaviors — including smoking, alcohol consumption, physical inactivity, high dietary oil intake, and a high-salt diet — followed the same ascending pattern across these groups.
Baseline characteristics Total
N=9,673No diseases
N=5,009Single disease
N=2,329Comorbidity
N=2,335P Sociodemographic factors Age (years) 35.43 (30.43, 42.02) 34.14 (29.63, 39.73) 36.20 (30.68, 43.63) 38.35 (32.17, 49.00) <0.05 Sex, n (%) <0.05 Male 4,475 (46.26) 1,326 (26.47) 1,318 (56.59) 1,831 (78.42) Female 5,198 (53.74) 3,683 (73.53) 1,011 (43.41) 504 (21.58) Educational level, n (%) <0.05 Below college 338 (3.49) 79 (1.58) 99 (4.25) 160 (6.86) College or above 9,333 (96.51) 4,929 (98.42) 2,230 (95.75) 2,174 (93.14) Lifestyle behavior factors Smoking status, n (%) <0.05 Never smoking 8,346 (86.50) 4,712 (94.24) 1,959 (84.37) 1,675 (72.01) <20 pack-years 1,089 (11.29) 260 (5.20) 329 (14.17) 500 (21.50) ≥20 pack-years 213 (2.21) 28 (0.56) 34 (1.46) 151 (6.49) Alcohol consumption, n (%) <0.05 Never drinking 8,339 (86.37) 4,610 (92.22) 1,952 (84.03) 1,777 (76.17) Moderate drinking
(men <60 g/day, women <50 g/day)1,289 (13.35) 385 (7.70) 365 (15.71) 539 (23.10) Heavy drinking
(men ≥60 g/day, women ≥50 g/day)27 (0.28) 4 (0.08) 6 (0.26) 17 (0.73) Regular physical activity, n (%) <0.05 No 6,155 (63.68) 3,329 (66.54) 1,372 (58.93) 1,454 (62.30) Yes 3,510 (36.32) 1,674 (33.46) 956 (41.07) 880 (37.70) Sleep duration, Median (IQR) 7.00 (7.00,8.00) 7.00 (7.00,8.00) 7.00 (6.50,8.00) 7.00 (6.50,8.00) <0.05 Cooking oil consumption, n (%) <0.05 Low 2,382 (24.63) 1,298 (25.92) 625 (26.84) 459 (19.66) Moderate 6,326 (65.41) 3,275 (65.40) 1,469 (63.07) 1,582 (67.75) High 964 (9.96) 435 (8.68) 235 (10.09) 294 (12.59) Dietary taste preference, n (%) <0.05 Light 2,701 (27.93) 1,489 (29.73) 681 (29.25) 531 (22.74) Moderate 5,885 (60.85) 3,057 (61.04) 1,404 (60.31) 1,424 (60.99) Salty 1,085 (11.22) 462 (9.23) 243 (10.44) 380 (16.27) Healthy dietary pattern score,
Median (IQR)0.06 (−0.57, 0.63) 0.10 (−0.5, 0.65) 0.08 (−0.55, 0.69) −0.05 (−0.74, 0.51) <0.05 High-calorie dietary pattern score,
Median (IQR)−0.16 (−0.78, 0.60) −0.15 (−0.77, 0.58) −0.22 (−0.81, 0.61) −0.12 (−0.75, 0.64) 0.15 Clinical measurements SBP (mmHg), Median (IQR) 118.00
(109.00, 129.00)113.00
(106.00, 122.00)121.00
(112.00, 131.00)130.00
(119.00, 140.00)<0.05 DBP (mmHg), Median (IQR) 74.00
(67.00, 81.00)70.00
(65.00, 76.00)75.00
(68.00, 82.00)81.00
(74.00, 88.00)<0.05 FPG (mmol/L), Median (IQR) 4.96 (4.67, 5.27) 4.87 (4.61, 5.15) 4.98 (4.69, 5.28) 5.18 (4.86, 5.64) <0.05 HbAc1 (%), Median (IQR) 5.30 (5.10, 5.50) 5.21 (5.07, 5.40) 5.30 (5.10, 5.50) 5.44 (5.21, 5.70) <0.05 TC (mmol/L), Median (IQR) 4.86 (4.29, 5.48) 4.69 (4.18, 5.21) 5.02 (4.38, 5.74) 5.14 (4.48, 5.93) <0.05 TG (mmol/L), Median (IQR) 1.09 (0.79, 1.58) 0.88 (0.70, 1.15) 1.20 (0.89, 1.61) 1.89 (1.33, 2.65) <0.05 HDL-C (mmol/L), Median (IQR) 1.34 (1.15, 1.56) 1.45 (1.28, 1.65) 1.30 (1.13, 1.53) 1.13 (0.99, 1.31) <0.05 LDL-C (mmol/L), Median (IQR) 2.93 (2.51, 3.39) 2.76 (2.40, 3.14) 3.10 (2.63, 3.61) 3.22 (2.76, 3.76) <0.05 SUA (μmol/L), Median (IQR) 322.00
(267.00, 394.00)283.00
(244.00, 326.00)355.00
(295.30, 406.00)424.00
(364.00, 473.00)<0.05 Prevalence of hepatic steatosis, n (%) 2,577 (26.64) − 671 (28.81) 1,906 (81.63) <0.05 Note: Continuous variables are presented as median (IQR), and categorical variables as number (percentage). Differences among groups were assessed using the Kruskal–Wallis test for continuous variables and the chi-square (χ2) test for categorical variables.
Abbreviation: SBP=systolic blood pressure; DBP=diastolic blood pressure; FPG=fasting plasma glucose; HbA1c=glycated hemoglobin; TC=total cholesterol; TG=triglycerides; HDL-C=high-density lipoprotein cholesterol; LDL-C=low-density lipoprotein cholesterol; SUA=serum uric acid; IQR=interquartile range.Table 1. Baseline characteristics of participants by metabolic disease status.
Over a median follow-up of 3.49 years [interquartile range (IQR): 2.25–5.12 years], 1,244 incident MM cases emerged, representing 16.95% of the study population. Males accounted for a disproportionate share, with 832 cases (31.47%) compared with 412 among females (8.78%; P<0.05), and incidence rose steadily with advancing age. Figure 1 illustrates the predominant patterns of incident MM, revealing that hepatic steatosis-related MM combinations ranked consistently as the most common, irrespective of participants’ baseline disease status — whether MD-free or presenting with SMD. Among those with baseline hepatic steatosis, the MM incidence reached 47.99%, significantly exceeding rates associated with hypertension, dyslipidemia, or hyperuricemia (P<0.05). Although type 2 diabetes appeared to carry an even higher incidence, that estimate rested on a small sample and lacked statistical stability. Taken together, these findings position hepatic steatosis as a potentially pivotal driver in the development of MM.
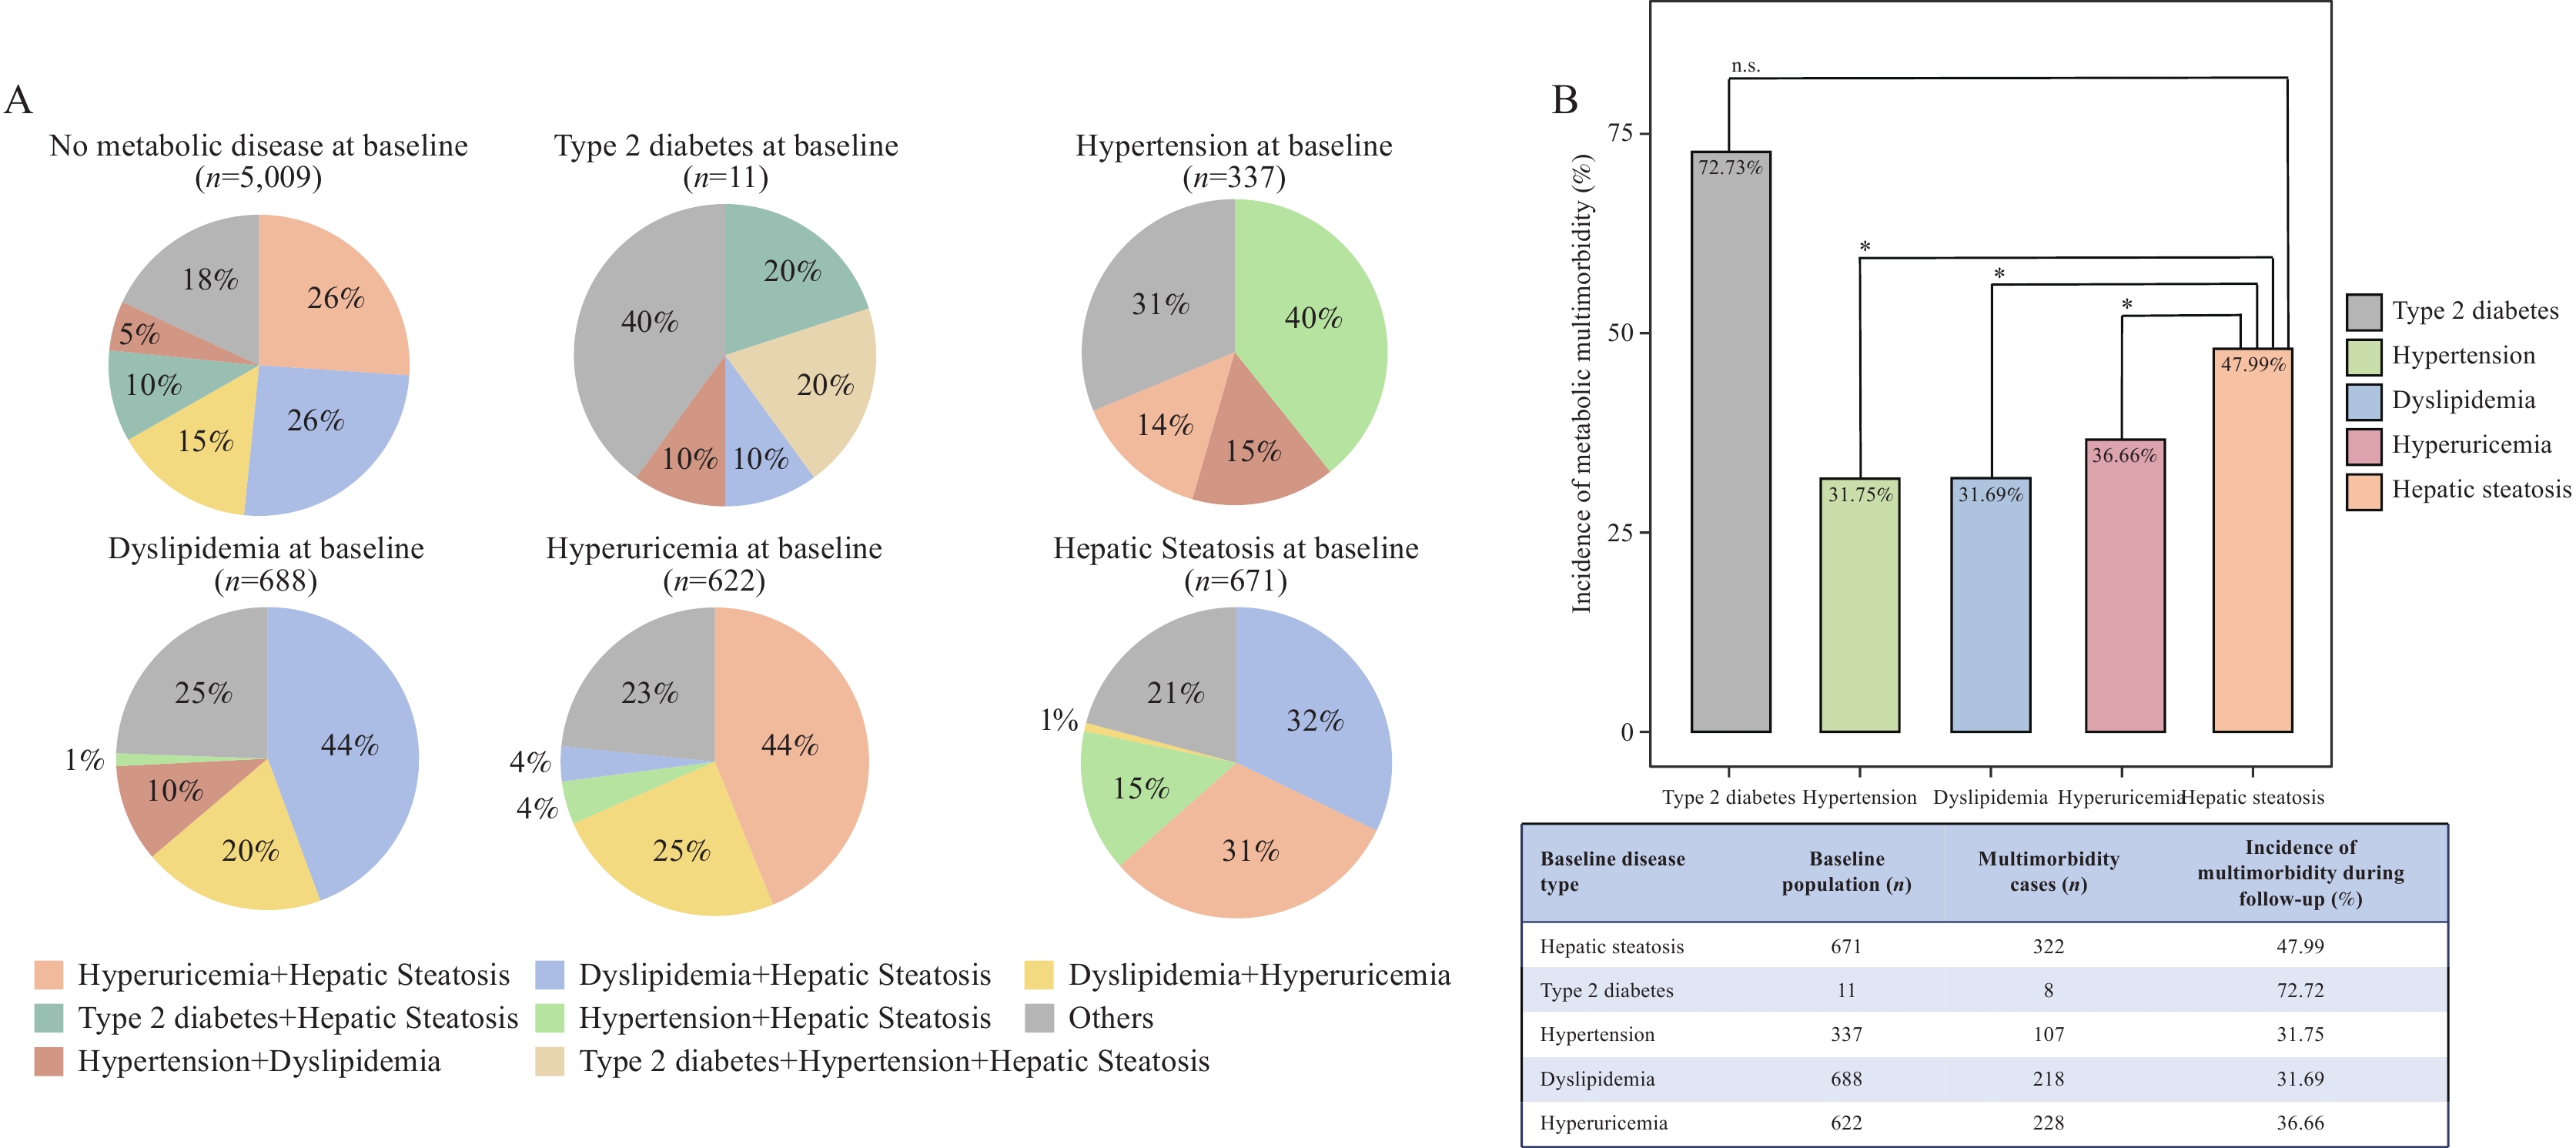 Figure 1.
Patterns and comparisons of metabolic multimorbidity during follow-up. (A) Key metabolic multimorbidity patterns during follow-up by baseline metabolic disease status. (B) Incidence of metabolic multimorbidity by baseline single metabolic disease type.
Note: In panel A, comorbidity combinations were first identified within each baseline disease group, and the most frequent patterns were consolidated into a unified set of seven combinations displayed across all pie charts. Less frequent combinations are grouped as “Others”.To characterize disease progression, transitions across three states — MD-free, SMD, and MM — were tracked in 7,338 participants who were free of MM at baseline. The incidence rates for the MD-free–to–SMD and SMD-to–MM transitions were 97.27 and 137.03 per 1,000 person-years, respectively (
Supplementary Figure S2 ). Recognizing well-established sex- and age-related differences in lifestyle behaviors and metabolic multimorbidity, we conducted sex- and age-stratified multi-state models (Figure 2 andSupplementary Table S1 ). In males, both smoking [hazard ratio (HR)=2.44, 95% confidence interval (CI): 1.63, 3.65] and a high-salt diet (HR=2.28, 95% CI: 1.46, 3.55) significantly elevated the risk of progressing directly from MD-free to MM. Among females, a high-oil diet showed a nominally significant association with increased MM risk (HR=1.76, 95% CI: 1.05, 2.96); conversely, regular physical activity (HR=0.58, 95% CI: 0.40, 0.84) and healthy dietary patterns (HR=0.83, 95% CI: 0.71, 0.98) were each nominally associated with a reduced risk of progression from SMD to MM. Age-stratified analyses revealed that among participants younger than 40 years, smoking (HR=2.04, 95% CI: 1.27, 3.30) and a high-salt diet (HR=1.74, 95% CI: 1.08, 2.80) accelerated the MD-free–to–MM transition, while regular physical activity offered nominal protection against SMD-to-MM progression (HR=0.77, 95% CI: 0.61, 0.97). In participants aged 40 years or older, the hazard estimates for both smoking (HR=3.16, 95% CI: 1.52, 6.55) and a high-salt diet (HR=2.27, 95% CI: 1.18, 4.36) were markedly stronger than those observed in the younger stratum. Additionally, alcohol consumption (HR=1.89, 95% CI: 1.29, 2.78) independently heightened the risk of SMD onset in this older group, and a high-oil diet (HR=1.78, 95% CI: 1.14, 2.77) further increased the likelihood of advancing from SMD to MM.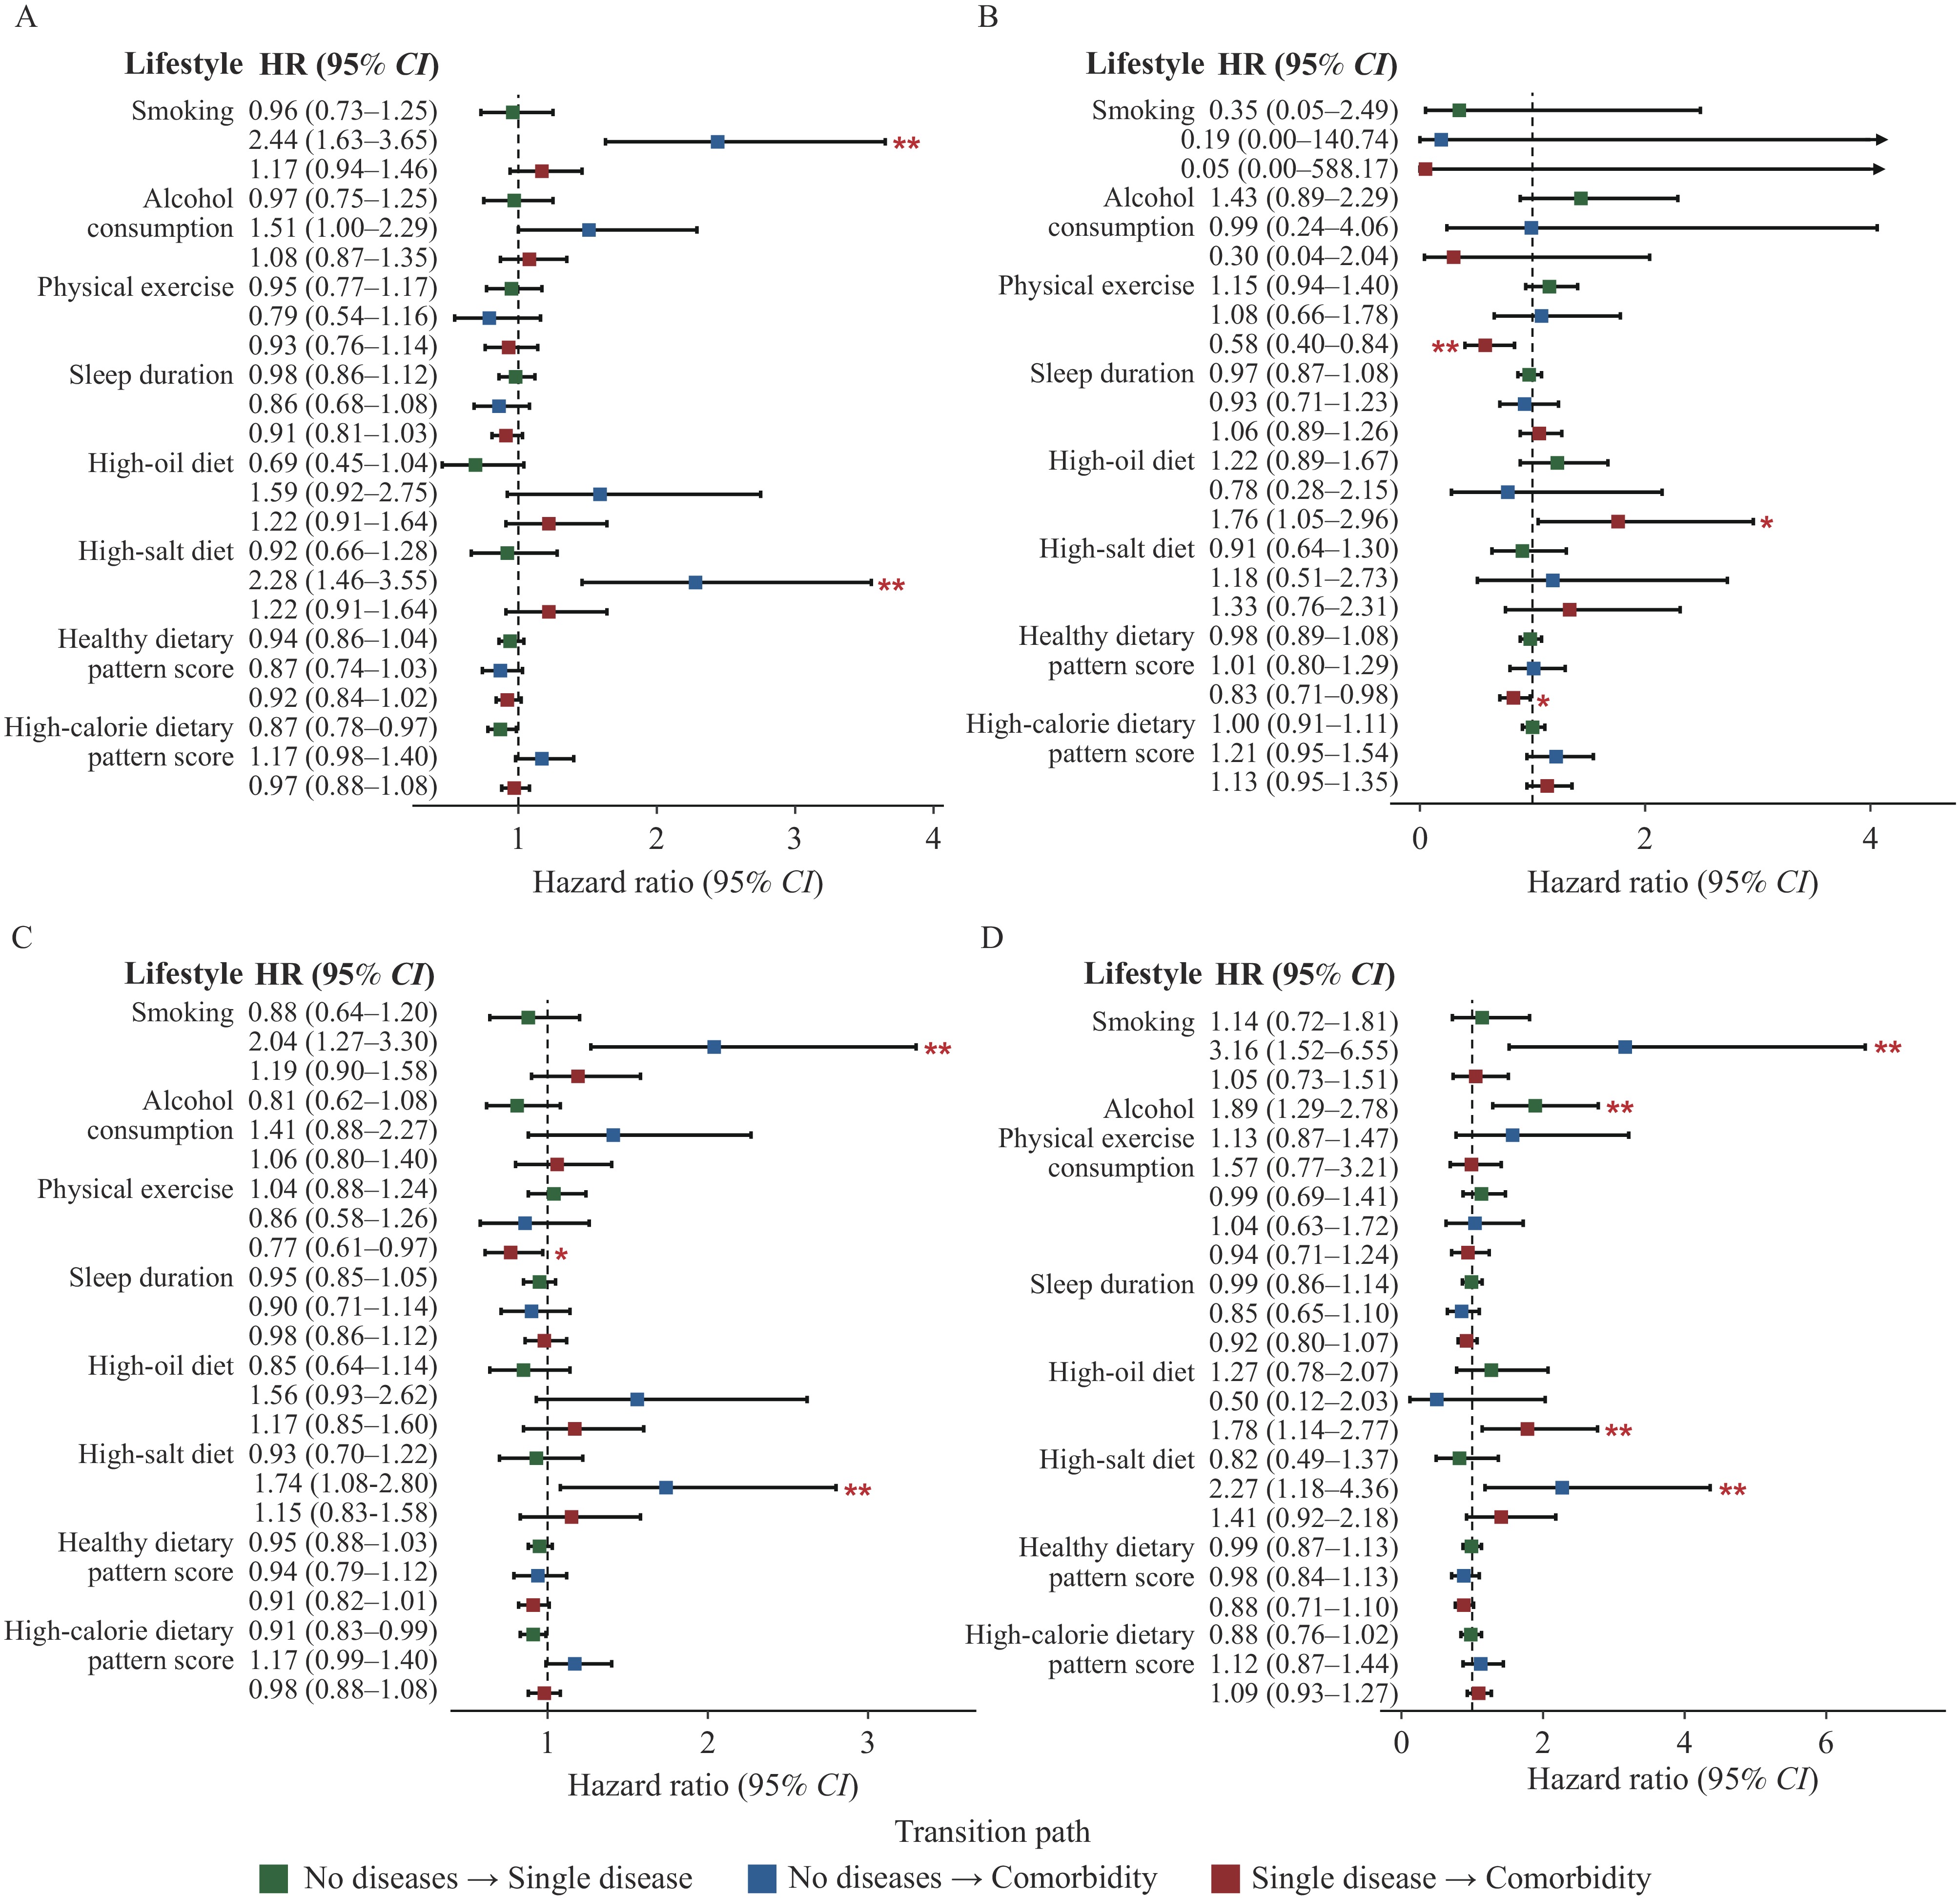 Figure 2.
Effects of lifestyle factors on different disease transition pathways. (A) Males; (B) Females; (C) Age<40 years; (D) Age≥40 years.
Note: Forest plots present hazard ratios (HRs) and 95% confidence intervals (CIs) derived from multistate model analyses. Models were adjusted for education level and physical examination center.
Abbreviations: HR=hazard ratio; CI=confidence interval; No diseases=no metabolic diseases; Single disease=single metabolic disease; Comorbidity=metabolic multimorbidity.
* indicates P<0.05; ** indicates P_FDR<0.05.
-
Drawing on data from the HOPE cohort, this study characterized metabolic comorbidity patterns in Chinese adults, mapped disease transitions across three states, and evaluated the influence of lifestyle behaviors on those transitions. At baseline, the prevalence of five MDs and MM was higher in males than in females, and the prevalence of each MD rose with age (P<0.05). Hepatic steatosis-related comorbidity patterns were the most prevalent in the study population. Notably, individuals with hepatic steatosis faced a substantially elevated risk of developing metabolic comorbidity — a finding consistent with prior evidence underscoring the central role of hepatic metabolic dysfunction in driving insulin resistance (8), which itself has been identified as a key pathological mechanism of metabolic syndrome (9). Taken together, these observations suggest that hepatic steatosis may serve as an early sentinel of metabolic disease progression and could help clinicians identify populations at heightened risk of metabolic multimorbidity before it fully develops.
Sex-specific differences in the associations between lifestyle factors and metabolic multimorbidity progression likely reflect, at least in part, genuine differences in lifestyle behaviors between men and women. Among the present findings, smoking was strongly associated with a higher risk of progression from SMD to MM in males, yet no comparable association emerged in females — an asymmetry almost certainly attributable to the stark disparity in smoking prevalence between the two groups (24.32% in males versus 0.51% in females).
Prior research has demonstrated that lifestyle interventions combining healthy dietary patterns with regular moderate-intensity physical activity can reduce the prevalence of metabolic syndrome (10). Those studies, however, focused on the onset of individual metabolic diseases and did not account for dynamic disease progression. To address this gap, the present study employed a multi-state model to examine disease transitions over time, revealing that progression was not strictly unidirectional and, importantly, that stage-specific intervention opportunities exist. Regular physical activity and healthier dietary patterns were both associated with a lower risk of progression from SMD to MM among females, suggesting that interventions targeting these behaviors may be especially effective for women. Furthermore, a preference for high-salt diets was associated with an increased risk of progression from SMD to MM among males, and this association held consistently across both younger (<40 years) and older (≥40 years) age groups.
This study has several limitations that warrant acknowledgment. First, all lifestyle data were self-reported, introducing the potential for reporting bias. Second, restricting the analysis to participants with at least two follow-up visits may have introduced selection bias, although key baseline characteristics remained similar to those of the overall cohort. Residual confounding from unmeasured cardiometabolic family history cannot be fully excluded. Finally, the relatively short follow-up period may have constrained the observation of long-term disease trajectories and could have preferentially captured more rapid patterns of disease progression.
In sum, adopting healthier lifestyle behaviors holds meaningful potential for preventing or delaying the progression of metabolic multimorbidity. Individuals with hepatic steatosis, in particular, warrant prioritization for targeted lifestyle interventions — a finding that provides practical evidence for stage-specific prevention strategies in the broader effort to control metabolic disease.
-
The study protocol of the HOPE program was approved by the Institutional Review Board of Nanjing Medical University (Ref: 2023-278).
-
All participants and staff of The Health Omics Preventive Examination Program for their contributions to this study.
HTML
| Citation: |

|