
 Download:


-
Introduction: Sleep quality among older adults is an important determinant of overall health, yet research on this topic in China remains limited. This study presents the 2025 survey findings on sleep quality across various subgroups of older adults in China.
Methods: This study used data from the 2025 follow-up of the Healthy Aging and Elderly Longevity Survey (HAELS), covering six provincial-level administrative divisions (PLADs) in China. Subgroup differences were compared using chi-square tests, and multivariable logistic regression analysis was performed to identify factors associated with poor sleep quality.
Results: A total of 4,631 participants were included in the analysis. The overall prevalence of poor sleep quality was 48.39% [95% confidence interval (CI): 46.95%, 49.83%]. Independent risk factors included female sex [odds ratio (OR)=1.45, 95% CI: 1.26, 1.68], rural residence (OR=1.33, 95% CI: 1.16, 1.52), hypertension (OR=1.24, 95% CI: 1.10, 1.40), chronic digestive system diseases (OR=1.85, 95% CI: 1.55, 2.20), chronic urinary system diseases (OR=1.44, 95% CI: 1.19, 1.74), and depressive symptoms (OR=2.35, 95% CI: 2.03, 2.72) (all P<0.001). Among the multidimensional sleep problems, total sleep duration had the highest detection rate (41.44%, 95% CI: 40.01%, 42.87%), followed by sleep onset latency (35.95%, 95% CI: 34.57%, 37.35%) and sleep efficiency (30.79%, 95% CI: 29.46%, 32.14%).
Conclusion: Poor sleep quality is highly prevalent among older adults in China, with significant disparities across demographic and health subgroups. Strengthening sleep quality screening and intervention is essential, particularly for high-risk groups such as women, rural residents, and older adults with depression or chronic diseases.
-
Sleep quality, particularly among older adults, is a critical determinant of health and is associated with elevated risks of mortality, physical illness, and mental disorders (1). Given the rapid growth of the aging population, this issue poses a major public health challenge. A recent meta-analysis estimated the overall pooled prevalence of poor sleep quality among older adults at 50% [95% confidence interval (CI): 45%, 55%] (2). In recent years, research on sleep quality among older adults in China has been limited, focusing primarily on localized regions or clinical samples. This study presents the 2025 follow-up findings of the Healthy Aging and Elderly Longevity Survey (HAELS) on sleep quality across different subgroups of older adults in six provincial-level administrative divisions (PLADs) in China.
This study used data from the third round of the HAELS, which was initiated in 2019 across 6 PLADs (Beijing, Shandong, Jilin, Jiangxi, Ningxia, and Guangxi) to evaluate trends in healthy aging among community-dwelling older adults aged 65 years and above (3). These 6 PLADs were selected based on their level of economic development. From each province or municipality, two counties or urban districts were randomly chosen. Within each county or urban district, two towns or subdistricts were selected using a multistage stratified probability-proportional-to-size (PPS) sampling approach. Two villages or communities were then chosen from each town or subdistrict, again employing PPS sampling. In the final stage, 100 participants were randomly drawn from residents aged 65 and above within each selected village or community. Overall, the HAELS recruited 4,800 participants, yielding a final sample of 4,690 in 2019 (3). Two rounds of follow-up were conducted in 2022 and 2025. In the 2025 round, to account for mortality, loss to follow-up, and shifts in age structure, additional subjects were recruited alongside continued tracking of the original cohort. This ensured that at least 100 surviving participants were surveyed in each village or community and that adults aged 65–70 years constituted at least 50% of the newly added subjects. In total, 4,775 eligible participants were enrolled, including 1,805 newly added subjects (37.8%), and 4,769 completed the survey. After excluding cases with missing sleep data, the final analytic sample comprised 4,631 participants (97.0%).
Sleep quality was assessed using the Pittsburgh Sleep Quality Index (PSQI), a validated self-report instrument (4). The questionnaire comprises 19 items grouped into seven domains: subjective sleep quality, sleep onset latency, total sleep duration, sleep efficiency, sleep disturbances, use of sleep medication, and daytime dysfunction. Each domain is scored from 0 to 3, yielding a global PSQI score ranging from 0 to 21, with higher scores reflecting poorer sleep quality and greater severity of sleep-related problems. In this study, a score of ≥2 on any PSQI dimension was considered indicative of a problem in that dimension, and a total PSQI score >5 was classified as poor sleep quality. At this cutoff, the diagnostic sensitivity was 89.6% and the specificity was 86.5% (4). Demographic and health-related variables included age, sex, household registration, education level, hypertension, diabetes, chronic obstructive pulmonary disease (COPD), chronic digestive system diseases, chronic urinary system diseases, current smoking, alcohol consumption, physical activity, and depressive symptoms. Depression was assessed using the 15-item Geriatric Depression Scale (GDS-15), with scores ≥5 indicating depression.
Continuous variables were reported as means standard deviation (SD), and categorical variables as percentages with 95% CIs. The prevalence of overall PSQI scores and individual dimensions among older adults was presented as point estimates with 95% CIs. Subgroup differences were assessed using χ2 tests, and multivariable logistic regression analysis was performed to identify factors associated with poor sleep quality. Radar charts were used to illustrate the multidimensional characteristics of sleep quality across age,sex, urban–rural residence, and depression status. All statistical analyses were conducted using R software (version 3.62, R Project for Statistical Computing, Vienna, Austria). Tests were two-tailed, with statistical significance defined as P<0.05.
Among the 4,631 older adults included in the analysis, the mean age was 74.3 years, with males accounting for 42.13% and urban residents for 33.56%. Table 1 presents the characteristics of participants stratified by sleep quality. The overall prevalence of poor sleep quality was 48.39% (95% CI: 46.95%, 49.83%), with higher rates observed among participants who were older, female, residing in rural areas, had lower educational attainment, had comorbid chronic diseases (hypertension, COPD, chronic digestive system diseases, and chronic urinary system diseases), or had depressive symptoms (P<0.05). Notably, among older adults with chronic digestive system diseases and those with depressive symptoms, the prevalence of poor sleep quality reached 64.49% (95% CI: 60.86%, 67.97%) and 65.90% (95% CI: 63.10%, 68.60%), respectively. Multivariable logistic regression analysis (Table 2) revealed that female sex (OR=1.45, 95% CI: 1.26, 1.68), rural residence (OR=1.33, 95% CI: 1.16, 1.52), hypertension (OR=1.24, 95% CI: 1.10, 1.40), chronic digestive system diseases (OR=1.85, 95% CI: 1.55, 2.20), chronic urinary system diseases (OR=1.44, 95% CI: 1.19, 1.74), and depressive symptoms (OR=2.35, 95% CI: 2.03, 2.72) were independent risk factors for poor sleep quality (all P<0.001). Conversely, middle school education (vs. primary school or below) and low physical activity (<150 min/week) were associated with better sleep quality.
Subgroup N Poor sleep quality % (95% CI) χ2 P Age, years 7.609 0.022 65–74 2,628 46.88 (44.98, 48.79) 75–84 1,754 49.77 (47.44, 52.11) ≥85 249 54.62 (48.41, 60.69) Sex 55.071 <0.001 Male 1,951 41.98 (39.78, 44.21) Female 2,680 53.06 (51.15, 54.96) Residence 43.985 <0.001 Urban 1,554 41.51 (39.05, 44.01) Rural 3,077 51.87 (50.09, 53.65) Education level* 53.395 <0.001 Primary school or below 2,950 52.44 (50.62, 54.26) Middle school 1,105 41.45 (38.53, 44.42) High school or above 576 40.97 (36.94, 45.12) Hypertension 21.308 <0.001 Yes 2,447 51.61 (49.61, 53.61) No 2,184 44.78 (42.68, 46.9) Diabetes 0.445 0.505 Yes 859 49.48 (46.08, 52.87) No 3,772 48.14 (46.54, 49.75) COPD 12.15 0.001 Yes 342 57.60 (52.16, 62.87) No 4,289 47.66 (46.15, 49.16) Chronic digestive system diseases 87.898 <0.001 Yes 721 64.49 (60.86, 67.97) No 3,910 45.42 (43.85, 47.00) Chronic urinary system diseases 33.201 <0.001 Yes 595 59.50 (55.42, 63.45) No 4,036 46.75 (45.21, 48.31) Current smoking 23.692 <0.001 Yes 749 40.19 (36.67, 43.81) No 3,882 49.97 (48.39, 51.56) Drinking 18.081 <0.001 Yes 557 39.86 (35.79, 44.07) No 4,074 49.56 (48.01, 51.11) Physical activity per week* 2.521 0.284 <150 min 1,666 46.94 (44.52, 49.37) 150–600 min 1,525 49.70 (47.17, 52.24) ≥600 min 1,439 48.71 (46.10, 51.33) Depression symptom* 191.919 <0.001 No 3,423 42.42 (40.76, 44.10) Yes 1,173 65.90 (63.10, 68.60) Total 4,631 48.39 (46.95, 49.83) Abbreviation: PLADs=provincial-level administrative divisions; CI=confidence interval; COPD=chronic obstructive pulmonary disease.
* 1 case of physical activity information is missing, and 35 cases of depression information are missing.Table 1. Characteristics of participants and prevalence of poor sleep quality among older adults from 6 PLADs of China, 2025.
Subgroup OR (95% CI) P Age, years 65–74 1 75–84 1.04 (0.91, 1.18) 0.573 ≥85 1.19 (0.90, 1.58) 0.214 Sex Male 1 Female 1.45 (1.26, 1.68) <0.001 Residence Urban 1 Rural 1.33 (1.16, 1.52) <0.001 Education level* Primary school or below 1 Middle school 0.83 (0.71, 0.96) 0.015 High school or above 0.87 (0.71, 1.07) 0.181 Hypertension No 1 Yes 1.24 (1.10, 1.40) <0.001 Diabetes No 1 Yes 0.98 (0.83, 1.15) 0.783 COPD No 1 Yes 1.33 (1.05, 1.69) 0.020 Chronic digestive system diseases No 1 Yes 1.85(1.55, 2.20) <0.001 Chronic urinary system diseases No 1 Yes 1.44 (1.19, 1.74) <0.001 Current smoking Yes 1 No 1.14 (0.95, 1.38) 0.159 Drinking Yes 1 No 1.02 (0.83, 1.25) 0.880 Physical activity per week 150–600 min 1 <150 min 0.79 (0.68, 0.92) 0.002 ≥600 min 0.94 (0.81, 1.09) 0.407 Depression symptom* No 1 Yes 2.35 (2.03, 2.72) <0.001 Abbreviation: PLADs=provincial-level administrative divisions; OR=odds ratio; CI=confidence interval; COPD=chronic obstructive pulmonary disease.
* 1 case of physical activity information is missing, and 35 cases of depression information are missing.Table 2. Multivariable logistic regression analysis of poor sleep quality in older adults from 6 PLADs of China, 2025.
Table 3 presents the detection rates of sleep problems across different PSQI dimensions among older adults. The highest detection rate was observed for total sleep duration at 41.44% (95% CI: 40.01%, 42.87%), followed by sleep onset latency at 35.95% (95% CI: 34.57%, 37.35%) and sleep efficiency at 30.79% (95% CI: 29.46%, 32.14%). The lowest detection rate was for use of sleep medication at 3.89% (95% CI: 3.35%, 4.48%).
Dimension Mean score (SD) Sleep problem % (95% CI) Subjective sleep quality 1.03 (0.76) 23.62 (22.41, 24.87) Sleep onset latency 1.29 (1.03) 35.95 (34.57, 37.35) Total sleep duration 1.15 (0.96) 41.44 (40.01, 42.87) Sleep efficiency 0.85 (1.14) 30.79 (29.46, 32.14) Sleep disturbances 1.06 (0.53) 15.78 (14.75, 16.87) Use of sleep medication 0.12 (0.54) 3.89 (3.35, 4.48) Daytime dysfunction 0.73 (0.90) 18.57 (17.46, 19.72) Note: A score of ≥2 in any PSQI dimension indicates a problem in that dimension.
Abbreviation: PLADs=provincial-level administrative divisions; CI=confidence interval. SD=standard deviation.Table 3. Prevalence of multidimensions problem of the PSQI among older adults from 6 PLADs of China, 2025.
Figure 1 displays the detection rates of sleep problems across various dimensions by subgroup. Across age, sex, urban–rural residence, and depression status, detection rates for each sleep dimension were consistently higher among females than males, higher in rural than urban areas, and higher among individuals with depressive symptoms than those without. With the exception of total sleep duration, detection rates for all other sleep problems were higher among adults aged 80 years and above compared with those aged 65–79 years.
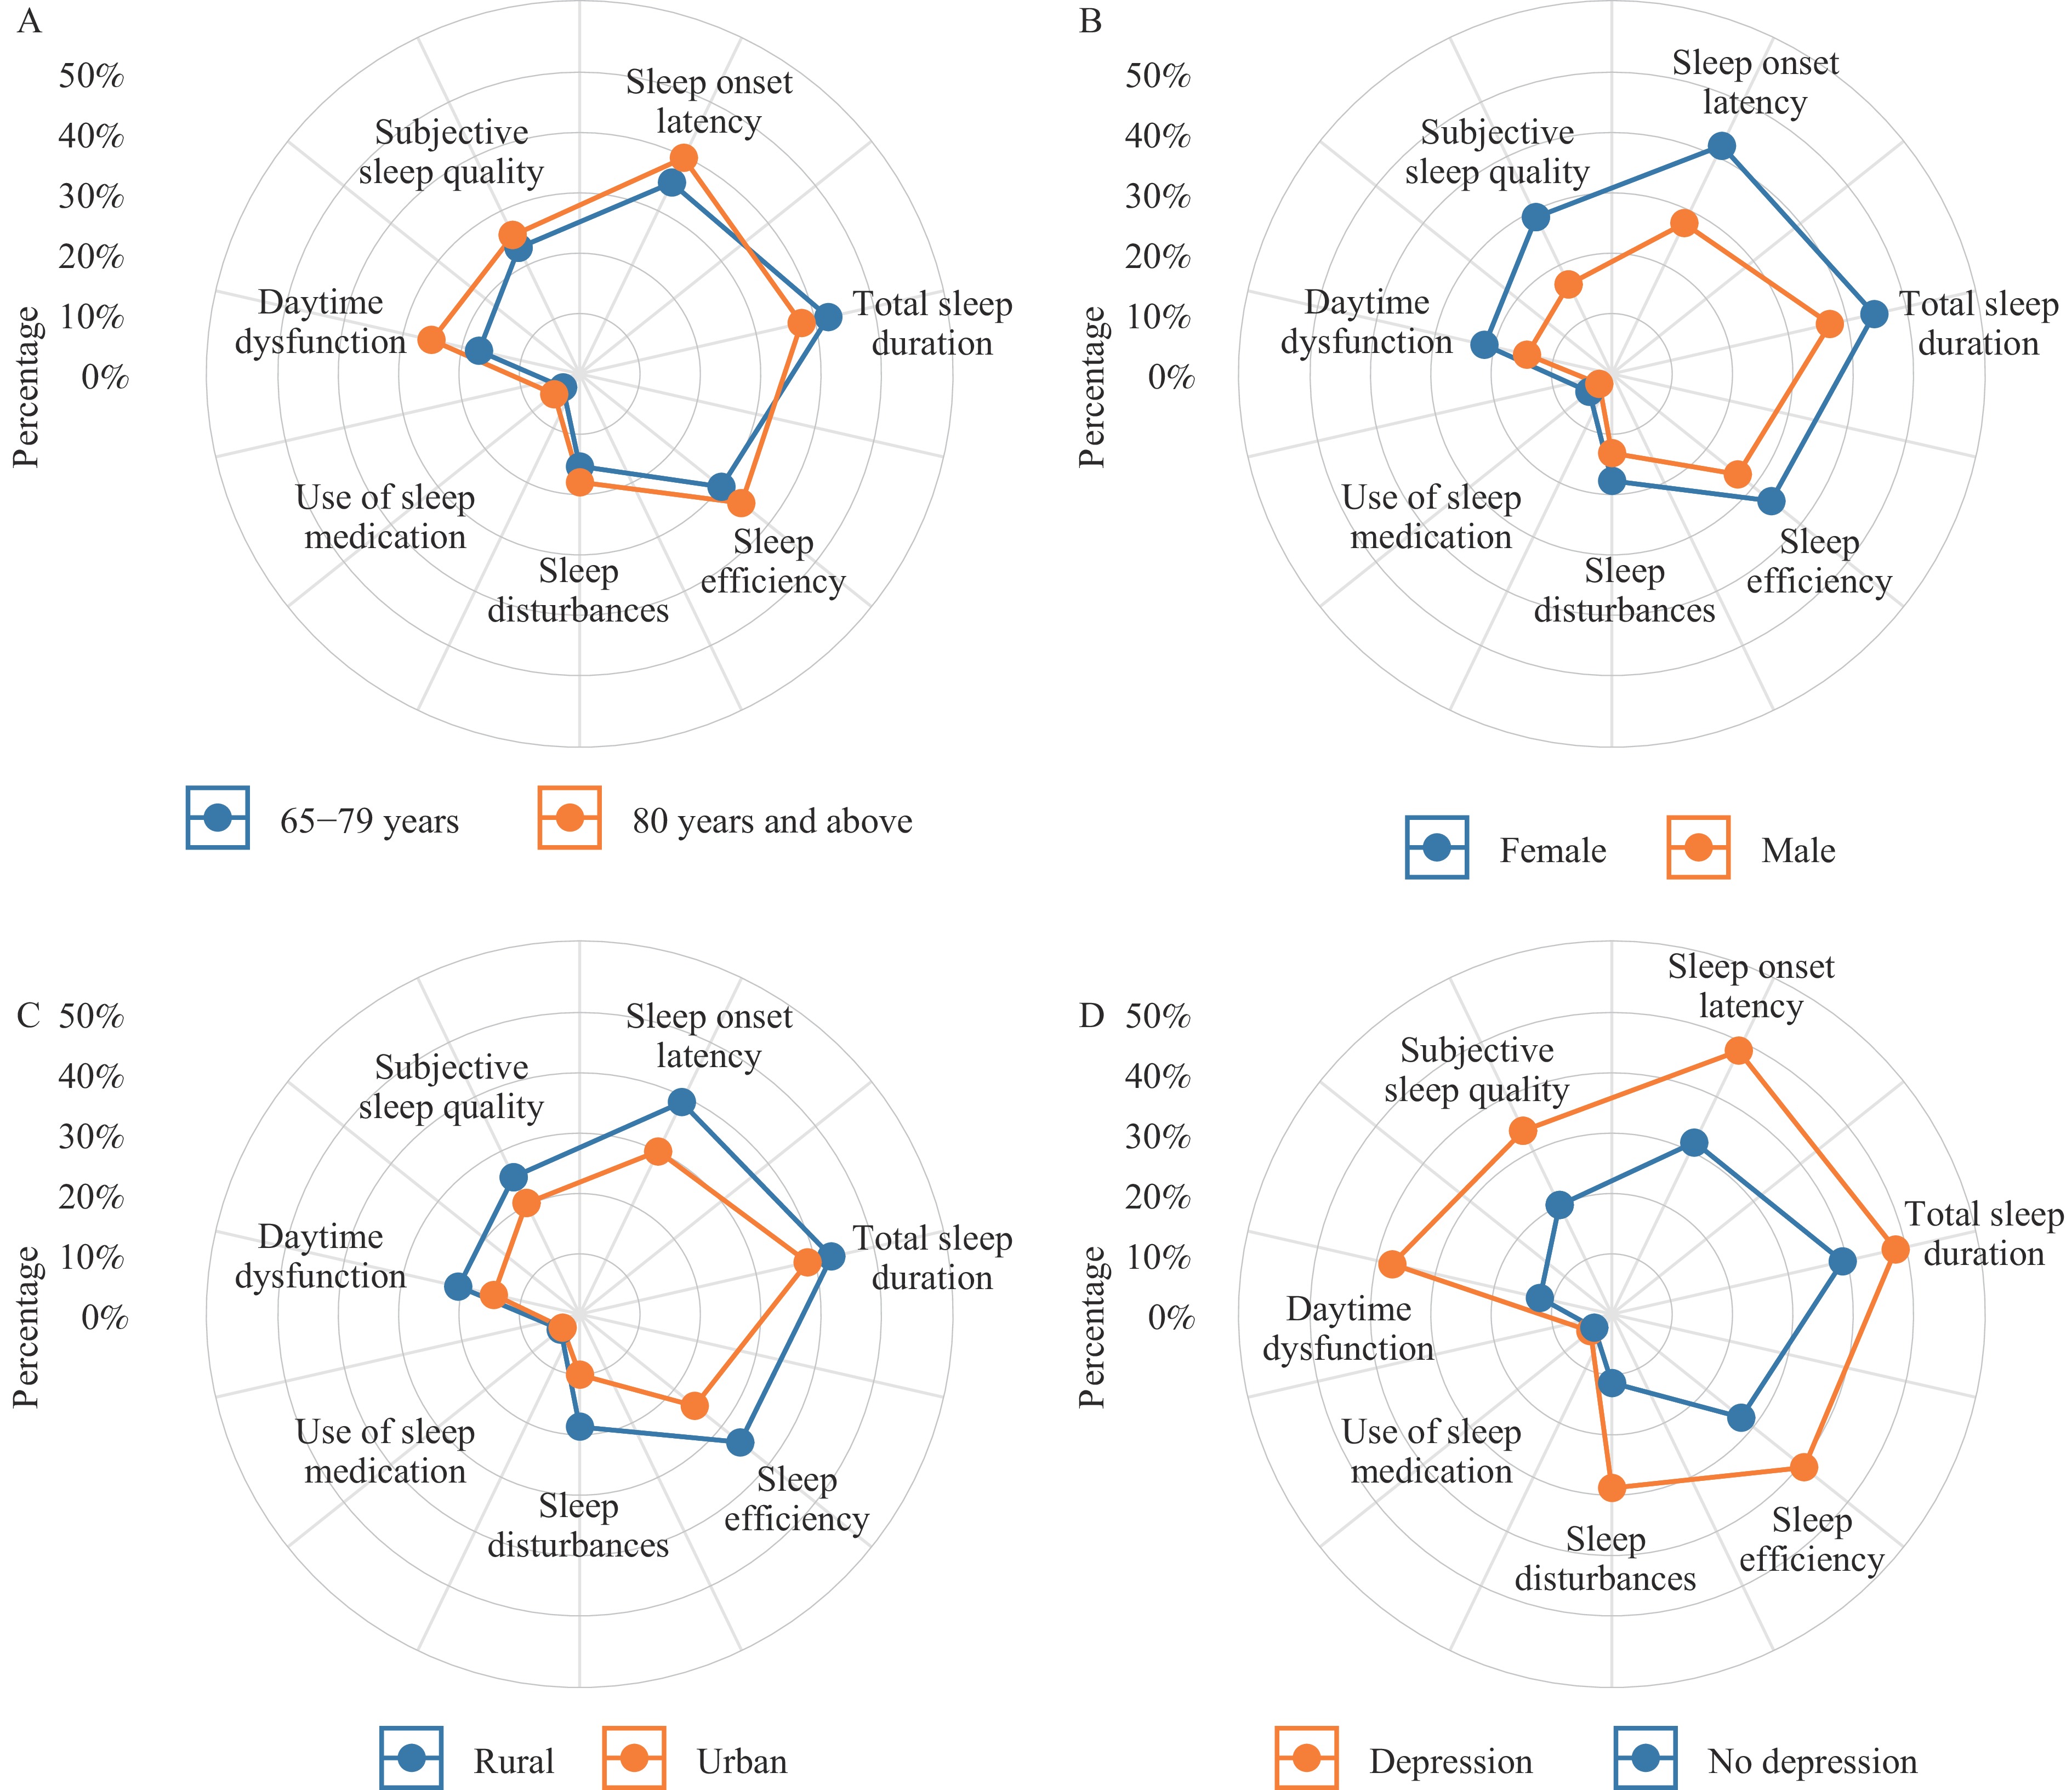 Figure 1.
Radar chart of multidimensional PSQI assessment. (A) by age; (B) by sex; (C) by residence; (D) by depression status.
Abbreviation: PSQI=Pittsburgh Sleep Quality Index. -
Sleep disturbances represent a prevalent and multifaceted health concern among older adults, profoundly affecting their overall well-being and daily functioning. Against this backdrop, the present study offers a comprehensive analysis of sleep quality among older adults using validated multidimensional assessments, describing the prevalence and distribution of sleep impairments across subpopulations defined by demographic and health-related characteristics. Our findings revealed that the prevalence of poor sleep quality among older adults was 48.39% (95% CI: 46.95%, 49.83%), consistent with the estimated global prevalence of 50.0% (2) and substantially higher than the rate of 28.2% reported in younger Chinese populations (5). These results underscore the need to integrate sleep problem screening and assessment into national basic public health services and the comprehensive geriatric evaluations conducted by medical institutions, thereby enabling earlier identification and more effective health management.
This study observed marked disparities in sleep quality among subgroups, with particularly poorer outcomes among the oldest-old adults, rural residents, and those with lower educational attainment. These populations may have lower health literacy, fewer adaptive coping strategies, and more limited access to healthcare resources, thereby perpetuating maladaptive sleep hygiene practices and dysfunctional beliefs about sleep (6). Female sex was identified as an independent risk factor for poor sleep quality (OR=1.45, 95% CI: 1.26, 1.68), a finding consistent with survey data from Shanghai (7). Sleep problems in women may be influenced by both biological and psychosocial factors (8). This study also found that chronic comorbidities — including hypertension, COPD, digestive disorders, and urinary diseases — as well as depressive symptoms adversely affected sleep quality. When developing sleep health promotion plans, particular attention should be directed toward women, rural residents, and populations at high risk for depression. Efforts should focus on disseminating sleep hygiene knowledge, expanding screening programs, improving healthcare accessibility, providing psychosocial support, and actively preventing and managing chronic diseases to improve sleep quality and overall health. Physical activity is widely recognized as an effective strategy for promoting sleep. However, this study found no evidence that engaging in ≥150 minutes of moderate-to-vigorous physical activity per week conferred better sleep quality compared with being insufficiently active. A meta-analysis demonstrated that moderate-intensity physical activity positively affected sleep quality, whereas high-intensity activity had no significant effect (9). Further research is needed to clarify the types and parameters of exercise that benefit sleep among older adults, including duration, intensity, optimal timing, and other relevant factors.
Analysis of individual sleep dimensions revealed that the most common problems involved total sleep duration, sleep onset latency, and sleep efficiency. These patterns were consistent across subgroups, with more pronounced impairments among women, rural residents, and individuals with depression. Additionally, adults aged 80 years and above and those with depressive symptoms experienced greater daytime dysfunction. A study conducted in Shandong found that poor subjective sleep quality, prolonged sleep onset latency, reduced sleep efficiency, sleep disturbances, daytime dysfunction, and the use of hypnotic medications were all associated with depressive symptoms in older adults (10). These findings highlight the multidimensional and population-specific nature of sleep problems, which may share a close bidirectional relationship with mental health — particularly depression. Future research should further explore the mechanisms linking various sleep dimensions to physiological and psychological outcomes, thereby providing evidence for the development of targeted intervention strategies.
This study has several limitations. First, the cross-sectional design precludes causal inference regarding the relationship between sleep quality and other factors. Second, the questionnaire-based approach may be subject to recall bias and influenced by subjective reporting. Third, this study did not incorporate objective sleep monitoring measures or additional biological data. Finally, the generalizability of the findings is constrained by the recruitment of participants from only 6 PLADs in China.
In summary, this study highlights the widespread problem of poor sleep quality among older adults and identifies significant associated risk factors, underscoring the need for individualized intervention strategies. These findings provide valuable insights for enhancing quality of life and health management in the aging population. Going forward, strengthening sleep screening, evaluation, and targeted intervention for relevant risk factors will be essential to improving the effectiveness of comprehensive geriatric health management.
-
The dedicated contributions of the Centers for Disease Control and Prevention in Beijing, Shandong, Jilin, Jiangxi, Ningxia, and Guangxi. Their rigorous efforts in data collection, field coordination, and logistical support were essential to this study. We sincerely appreciate all participants and institutions for their commitment to advancing public health research.
HTML
| Citation: |

|