Advanced Search

Preplanned Studies: Shifting Patterns of Anemia Prevalence and Severity Among Urban Women — China, 2019–2024

View author affiliations
  • Summary

    What is already known about this topic?

    The Sustainable Development Goals target a 50% reduction in anemia among women of reproductive age by 2025 and the elimination of all forms of malnutrition by 2030. However, robust evidence documenting temporal changes in anemia prevalence remains scarce.

    What is added by this report?

    Drawing on large-scale national health examination data, this report demonstrates overall progress in reducing anemia among urban women in China between 2019 and 2024. However, it also reveals increasing prevalence in several provinces and a growing burden of moderate-to-severe anemia specifically among women aged 40–49 years.

    What are the implications for public health practice?

    Risk-stratified and targeted anemia prevention and control strategies are urgently needed. Priority should be given to women aged 40–49 years, women of reproductive age residing in high-burden provinces, and geographic areas where anemia prevalence either exceeds 20% or demonstrates an upward trend.

  • loading...
  • Conflicts of interest: No conflicts of interest.
  • Funding: Supported by the National Health Commission of the People’s Republic of China (The Evaluation of the Development Process and Policy Adaptation for the Vision of Building a Healthy China by 2035) and the Chinese Academy of Engineering (Project 2023-JB-11)
  • [1] World Health Organization. WHO global anaemia estimates: key findings, 2025. Geneva: WHO; 2025. https://www.who.int/publications/i/item/9789240113930.
    [2] Bao HL, Huang YY, Sun Y, Chen YL, Luo Y, Yan LP, et al. Prevalence of anemia of varying severity, geographic variations, and association with metabolic factors among women of reproductive age in China: a nationwide, population-based study. Front Med 2024;18(5):850 − 61. https://doi.org/10.1007/s11684-024-1070-x.
    [3] Liu XX, Wang B, Man SLM, Bao HL, Huang YY, Yu CQ, et al. Variations in the prevalence of anemia of varying severity among urban non-pregnant women—China, 2021. China CDC Wkly 2024;6(10):175 − 80. https://doi.org/10.46234/ccdcw2024.036.
    [4] Hu YC, Li M, Wu JH, Wang R, Mao DQ, Chen J, et al. Prevalence and risk factors for anemia in non-pregnant childbearing women from the Chinese fifth national health and nutrition survey. Int J Environ Res Public Health 2019;16(7):1290. https://doi.org/10.3390/ijerph16071290.
    [5] Cao DM, Zhang HQ, Zhuoma GZ, Gan Q. Prevalence of anemia among high-altitude pregnant women in Shannan, China, and evaluation of altitude-adjustment methods: a cross-sectional study. Int J Gynaecol Obstet 2025;00:1-7. http://dx.doi.org/10.1002/ijgo.70766.
    [6] Man SLM, Deng YH, Ma Y, Fu JZ, Bao HL, Yu CQ, et al. Prevalence of liver steatosis and fibrosis in the general population and various high-risk populations: a nationwide study with 5. 7 million adults in China. Gastroenterology 2023;165(4):1025 − 40. https://doi.org/10.1053/j.gastro.2023.05.053.
    [7] World Health Organization. Nutritional anaemias: tools for effective prevention and control. Geneva: WHO; 2017. https://www.who.int/publications/i/item/9789241513067.
    [8] Health China Initiative Promotion Committee. Healthy China initiative (2019-2030). 2019. https://www.nhc.gov.cn/guihuaxxs/c100133/201907/2a6ed52f1c264203b5351bdbbadd2da8.shtml. (In Chinese). [2026-1-5]
    [9] General Office of the State Council. National nutrition plan (2017-2030). 2017. http://www.gov.cn/zhengce/content/2017-07/13/content_5210134.htm. (In Chinese). [2026-1-5]
    [10] Dreisler E, Frandsen CS, Ulrich L. Perimenopausal abnormal uterine bleeding. Maturitas 2024;184:107944. https://doi.org/10.1016/j.maturitas.2024.107944.
    [11] Wilson LF, Moss KM, Doust J, Farquhar CM, Mishra GD. First Australian estimates of incidence and prevalence of uterine fibroids: a data linkage cohort study 2000-2022. Hum Reprod 2024;39(9):2134 − 43. https://doi.org/10.1093/humrep/deae162.
    [12] Wilson L, Copp T, Hickey M, Jenkinson B, Jordan SJ, Thompson R, et al. Women who experience heavy menstrual bleeding: prevalence and characteristics from young adulthood to midlife, Australia, 2000-2021: a longitudinal cohort survey study. Med J Aust 2025;222(4):191 − 7. https://doi.org/10.5694/mja2.52596.
    [13] Park JY, Lee SW. A history of repetitive cesarean section is a risk factor of anemia in healthy perimenopausal women: The Korea National Health and Nutrition Examination Survey 2010-2012. PLoS One 2017;12(11):e0188903. https://doi.org/10.1371/journal.pone.0188903.
    [14] Hassen AE, Agegnehu AF, Admass BA, Temesgen MM. Preoperative anemia and associated factors in women undergoing cesarean section at a comprehensive specialized referral hospital in Ethiopia. Front Med 2023;10:1056001. https://doi.org/10.3389/fmed.2023.1056001.
  • FIGURE 1.  Regional disparities in the prevalence of anemia among urban women in China, standardized by age, 2019 versus 2024. (A) Anemia among all urban women; (B) Anemia among urban women aged 18–49 years; (C) Anemia among urban women aged 50 years and over.

    TABLE 1.  Prevalence of anemia by severity among urban women in China, 2019 versus 2024.

    Variable 2019 2024 Prevalence difference for anemia
    (%, 95% CI)
    Prevalence difference2
    for moderate-severe anemia
    (%, 95% CI)
    Number (%) Anemia
    (%, 95% CI)
    Moderate-severe anemia
    (%, 95% CI)
    Number (%) Anemia
    (%, 95% CI)
    Moderate-severe anemia
    (%, 95% CI)
    Overall 7,822,489
    (100.0)
    13.7
    (13.0, 14.4)
    5.1
    (4.8, 5.4)
    8,878,224
    (100.0)
    13.2
    (12.7, 13.8)
    5.0
    (4.8, 5.3)
    −0.49
    (−1.03, 0.06)
    −0.06
    (−0.23, 0.11)
    Age group (years)
    18–29 1,577,832
    (20.2)
    11.9
    (11.1, 12.6)
    3.9
    (3.6, 4.2)
    1,521,094
    (17.1)
    11.8
    (11.2, 12.4)
    4.1
    (3.9, 4.3)
    −0.08
    (−0.75, 0.60)
    0.18
    (−0.02, 0.38)
    30–39 2,132,587
    (27.3)
    16.8
    (16.0, 17.6)
    6.6
    (6.3, 7.0)
    2,634,552
    (29.7)
    15.9
    (15.3, 16.6)
    6.5
    (6.2, 6.8)
    −0.84
    (−1.47, −0.20)*
    −0.15
    (−0.39, 0.08)
    40–49 1,732,054
    (22.1)
    19.5
    (18.7, 20.3)
    9.3
    (8.9, 9.8)
    1,932,893
    (21.8)
    19.6
    (18.9, 20.4)
    9.7
    (9.2, 10.1)
    0.15
    (−0.41, 0.71)
    0.32
    (0.06, 0.57)*
    50–59 1,497,049
    (19.1)
    9.5
    (8.9, 10.0)
    3.1
    (2.9, 3.3)
    1,657,106
    (18.7)
    8.9
    (8.5, 9.4)
    2.8
    (2.7, 3.0)
    −0.56
    (−0.99, −0.14)*
    −0.25
    (−0.36, −0.13)*
    60–69 677,413
    (8.7)
    8.4
    (7.7, 9.1)
    1.6
    (1.4, 1.7)
    837,762
    (9.4)
    7.6
    (7.1, 8.2)
    1.4
    (1.2, 1.6)
    −0.76
    (−1.35, −0.17)*
    −0.17
    (−0.32, −0.02)*
    70+ 205,554
    (2.6)
    14.3
    (13.3, 15.3)**
    3.8
    (3.4, 4.2)**
    294,817
    (3.3)
    13.4
    (12.4, 14.4)**
    3.5
    (3.0, 4.0)**
    −0.94
    (−2.12, 0.25)
    −0.31
    (−0.87, 0.25)
    Age group 2 (years)
    18–49 5,442,473
    (69.6)
    17.0
    (16.3, 17.8)
    7.2
    (6.9, 7.6)
    6,088,539
    (68.6)
    16.7
    (16.1, 17.3)
    7.3
    (7.0, 7.7)
    −0.31
    (−0.89, 0.26)
    0.09
    (−0.12, 0.30)
    50+ 2,380,016
    (30.4)
    10.0
    (9.4, 10.7)**
    2.7
    (2.5, 2.9)**
    2,789,685
    (31.4)
    9.3
    (8.8, 9.9)**
    2.5
    (2.3, 2.7)**
    −0.70
    (−1.29, −0.10)*
    −0.23
    (−0.41, −0.05)*
    BMI
    Underweight 439,078
    (5.6)
    16.6
    (15.7, 17.5)
    5.5
    (5.1, 5.8)
    433,134
    (4.9)
    17.0
    (16.2, 17.7)
    5.7
    (5.5, 6.0)
    0.34
    (−0.40, 1.09)
    0.27
    (0.03, 0.52)*
    Normal 4,535,052
    (58.0)
    15.5
    (14.7, 16.3)
    5.7
    (5.4, 6.0)
    4,970,298
    (56.0)
    14.9
    (14.3, 15.5)
    5.6
    (5.3, 5.9)
    −0.60
    (−1.20, 0.00)
    −0.11
    (−0.30, 0.08)
    Overweight 2,168,776
    (27.7)
    11.7
    (11.1, 12.2)
    4.4
    (4.2, 4.7)
    2,582,885
    (29.1)
    11.3
    (10.8, 11.8)
    4.4
    (4.2, 4.6)
    −0.36
    (−0.85, 0.12)
    −0.03
    (−0.19, 0.13)
    Obesity 679,583
    (8.7)
    9.6
    (9.2, 10.1)**
    3.8
    (3.6, 4.0)**
    891,907
    (10.0)
    9.9
    (9.5, 10.3)**
    4.1
    (3.9, 4.3)**
    0.25
    (−0.21, 0.70)
    0.27
    (0.10, 0.44)*
    History of cesarean delivery
    Yes 321,881
    (4.1)
    17.0
    (15.8, 18.3)
    7.2
    (6.6, 7.8)
    1,116,428
    (12.6)
    16.3
    (15.5, 17.0)
    7.3
    (6.9, 7.7)
    −0.78
    (−1.96, 0.41)
    0.11
    (−0.40, 0.63)
    No 7,500,608
    (95.9)
    13.6
    (12.9, 14.2)**
    5.0
    (4.8, 5.3)**
    7,761,796
    (87.4)
    12.9
    (12.3, 13.4)**
    4.8
    (4.5, 5.0)**
    −0.73
    (−1.25, −0.20)*
    −0.25
    (−0.41, −0.09)*
    Per capita GDP
    Lowest 2,010,724
    (25.7)
    14.0
    (13.2, 14.9)
    5.3
    (5.0, 5.6)
    2,021,530
    (22.8)
    13.7
    (12.9, 14.5)
    5.4
    (5.0, 5.7)
    −0.32
    (−1.16, 0.52)
    0.08
    (−0.22, 0.38)
    Up to median 2,156,418
    (27.6)
    13.0
    (11.7, 14.2)
    4.9
    (4.4, 5.4)
    2,025,231
    (22.8)
    12.7
    (11.7, 13.7)
    5.0
    (4.5, 5.4)
    −0.30
    (−1.19, 0.59)
    0.08
    (−0.20, 0.36)
    Above median 1,805,148
    (23.1)
    14.2
    (12.6, 15.9)
    5.2
    (4.5, 5.9)
    2,068,072
    (23.3)
    12.7
    (11.7, 13.8)
    4.8
    (4.3, 5.3)
    −1.51
    (−3.04, 0.02)
    −0.40
    (−0.83, 0.02)
    Highest 1,850,199
    (23.7)
    13.9
    (12.5, 15.4)
    5.1
    (4.5, 5.6)
    2,763,391
    (31.1)
    13.9
    (12.5, 15.3)
    5.0
    (4.5, 5.5)
    −0.04
    (−1.03, 0.94)
    −0.12
    (−0.44, 0.20)
    Engel coefficient
    Highest 2,341,106
    (29.9)
    13.8
    (12.7, 14.9)
    4.9
    (4.5, 5.3)
    2,504,518
    (28.2)
    13.5
    (12.4, 14.5)
    4.9
    (4.5, 5.4)
    −0.35
    (−1.24, 0.54)
    0.06
    (−0.25, 0.36)
    Above median 1,608,892
    (20.6)
    13.8
    (12.0, 15.6)
    5.0
    (4.2, 5.8)
    1,843,720
    (20.8)
    13.2
    (12.0, 14.3)
    4.9
    (4.3, 5.4)
    −0.60
    (−1.69, 0.49)
    −0.16
    (−0.50, 0.18)
    Up to median 2,026,962
    (25.9)
    13.9
    (12.7, 15.2)
    5.3
    (4.9, 5.7)
    2,292,146
    (25.8)
    13.3
    (12.4, 14.2)
    5.2
    (4.8, 5.6)
    −0.65
    (−1.62, 0.31)
    −0.08
    (−0.36, 0.21)
    Lowest 1,845,529
    (23.6)
    13.2
    (12.1, 14.3)
    5.3
    (4.9, 5.8)
    2,237,840
    (25.2)
    12.8
    (11.7, 13.9)
    5.3
    (4.7, 5.8)
    −0.42
    (−1.97, 1.12)
    −0.08
    (−0.55, 0.39)
    Geographic region
    North 857,401
    (11.0)
    11.9
    (10.8, 13.0)
    5.1
    (4.7, 5.5)
    1,474,737
    (16.6)
    12.7
    (11.4, 14.0)
    5.3
    (4.7, 6.0)
    0.81
    (−0.65, 2.28)
    0.26
    (−0.26, 0.77)
    East 2,748,022
    (35.1)
    13.7
    (12.7, 14.7)
    5.1
    (4.8, 5.5)
    3,133,161
    (35.3)
    13.7
    (13.0, 14.4)
    5.1
    (4.8, 5.4)
    −0.02
    (−0.86, 0.82)
    0.03
    (−0.21, 0.26)
    Central 2,031,347
    (26.0)
    16.1
    (14.8, 17.4)
    5.8
    (5.3, 6.3)
    2,254,437
    (25.4)
    15.0
    (14.1, 15.9)
    5.6
    (5.2, 5.9)
    −1.11
    (−2.39, 0.18)
    −0.23
    (−0.65, 0.18)
    Southwest 1,001,486
    (12.8)
    11.3
    (10.1, 12.5)
    3.8
    (3.4, 4.2)
    794,601
    (9.0)
    10.6
    (9.5, 11.6)
    3.7
    (3.3, 4.0)
    −0.75
    (−1.71, 0.20)
    −0.13
    (−0.38, 0.12)
    Northwest 443,920
    (5.7)
    14.1
    (12.0, 16.2)
    6.0
    (5.3, 6.6)
    448,662
    (5.1)
    12.9
    (11.7, 14.0)
    5.8
    (5.4, 6.2)
    −1.23
    (−3.01, 0.55)
    −0.16
    (−0.77, 0.45)
    Northeast 740,313
    (9.5)
    11.7
    (11.0, 12.4)**
    4.1
    (3.7, 4.4)**
    772,626
    (8.7)
    10.4
    (9.7, 11.2)**
    4.0
    (3.8, 4.2)**
    −1.23
    (−2.35, −0.12)*
    −0.07
    (−0.54, 0.37)
    Note: The prevalence difference and P represent comparisons for the overall anemia rate.
    Abbreviation: CI=confidence interval; GDP=gross domestic product; BMI=body mass index.
    * P<0.05;
    ** P<0.01.
    Download: CSV

    TABLE 2.  Multilevel logistic regression analysis of factors associated with anemia among urban women in China: Overall effects and interactions with year (2019 versus 2024).

    Variable Anemia Moderate-severe anemia
    Overall OR
    (95% CI)
    Interaction OR
    (95% CI)
    P for interaction Overall OR
    (95% CI)
    Interaction OR
    (95% CI)
    P for interaction
    Year
    2019 Reference Reference
    2024 0.98
    (0.93, 1.02)
    1.01
    (0.97, 1.05)
    Age group (years)
    18–29 Reference Reference Reference Reference
    30–39 1.52
    (1.48, 1.56)**
    0.987
    (0.980, 0.995)
    <0.001 1.71
    (1.66, 1.76)**
    0.984
    (0.978, 0.991)
    <0.001
    40–49 2.16
    (2.11, 2.22)**
    0.999
    (0.991, 1.008)
    0.908 2.88
    (2.79, 2.97)**
    0.994
    (0.987, 1.002)
    0.159
    50–59 1.09
    (1.04, 1.14)**
    0.982
    (0.973, 0.990)
    <0.001 1.01
    (0.97, 1.06)
    0.969
    (0.961, 0.977)
    <0.001
    60–69 1.01
    (0.94, 1.09)
    0.923
    (0.961, 0.985)
    <0.001 0.53
    (0.47, 0.59)**
    0.961
    (0.943, 0.980)
    <0.001
    70+ 1.76
    (1.64, 1.88)**
    0.979
    (0.962, 0.995)
    0.013 1.15
    (1.02, 1.30)*
    0.969
    (0.940, 0.998)
    0.038
    BMI
    Underweight 1.12
    (1.10, 1.15)**
    1.015
    (1.010, 1.020)
    <0.001 1.02
    (0.99, 1.04)
    1.013
    (1.006, 1.021)
    <0.001
    Normal Reference Reference Reference Reference
    Overweight 0.86
    (0.85, 0.87)**
    0.998
    (0.995, 1.001)
    0.205 0.97
    (0.96, 0.99)**
    0.998
    (0.994, 1.001)
    0.156
    Obesity 0.80
    (0.78, 0.82)**
    1.009
    (1.004, 1.014)
    <0.001 0.98
    (0.96, 1.01)
    1.007
    (1.002, 1.013)
    0.010
    History of cesarean delivery
    Yes 1.07
    (1.04, 1.10)**
    1.006
    (0.993, 1.020)
    0.349 1.10
    (1.07, 1.14)**
    1.015
    (1.003, 1.027)
    0.015
    No Reference Reference Reference Reference
    Per capita GDP
    Lowest 1.15
    (1.03, 1.28)*
    0.998
    (0.976, 1.020)
    0.856 1.20
    (1.08, 1.34)**
    1.011
    (0.991, 1.030)
    0.284
    Up to median 1.05
    (0.95, 1.17)
    0.995
    (0.972, 1.018)
    0.680 1.10
    (1.00, 1.22)*
    1.007
    (0.988, 1.026)
    0.468
    Above median 1.08
    (0.95, 1.22)
    0.976
    (0.947, 1.006)
    0.121 1.13
    (1.00, 1.27)*
    0.987
    (0.966, 1.009)
    0.258
    Highest Reference Reference Reference Reference
    Engel coefficient
    Highest 1.08
    (0.99, 1.17)
    1.005
    (0.974, 1.037)
    0.755 0.97
    (0.89, 1.06)
    1.011
    (0.988, 1.035)
    0.350
    Above median 1.05
    (0.94, 1.17)
    0.999
    (0.966, 1.033)
    0.968 0.95
    (0.86, 1.05)
    0.999
    (0.976, 1.024)
    0.958
    Up to median 1.07
    (0.97, 1.19)
    1.004
    (0.972, 1.037)
    0.828 0.99
    (0.90, 1.09)
    1.009
    (0.987, 1.032)
    0.432
    Lowest Reference Reference Reference Reference
    Geographic region
    North 1.13
    (1.01, 1.27)*
    1.035
    (0.999, 1.072)
    0.056 1.21
    (1.09, 1.35)**
    1.007
    (0.973, 1.042)
    0.696
    East 1.25
    (1.15, 1.35)**
    1.024
    (0.998, 1.050)
    0.075 1.23
    (1.15, 1.31)**
    1.001
    (0.974, 1.029)
    0.934
    Central 1.41
    (1.29, 1.55)**
    1.005
    (0.976, 1.036)
    0.728 1.35
    (1.24, 1.46)**
    0.991
    (0.960, 1.022)
    0.563
    Southwest 0.90
    (0.81, 1.01)
    1.007
    (0.978, 1.036)
    0.654 0.83
    (0.76, 0.91)**
    0.990
    (0.961, 1.020)
    0.506
    Northwest 1.10
    (0.95, 1.28)
    0.998
    (0.962, 1.035)
    0.914 1.26
    (1.13, 1.40)**
    0.991
    (0.958, 1.025)
    0.585
    Northeast Reference Reference Reference Reference
    Note: “—” means not applicable.
    Abbreviation: OR=odds ratio; CI=confidence interval; GDP=gross domestic product; BMI=body mass index.
    * P<0.05;
    ** P<0.01.
    Download: CSV

Citation:

通讯作者: 陈斌, bchen63@163.com
  • 1. 

    沈阳化工大学材料科学与工程学院 沈阳 110142

  1. 本站搜索
  2. 百度学术搜索
  3. 万方数据库搜索
  4. CNKI搜索
Turn off MathJax
Article Contents

Article Metrics

Article views(390) PDF downloads(1) Cited by()

Share

Related

Shifting Patterns of Anemia Prevalence and Severity Among Urban Women — China, 2019–2024

View author affiliations

Summary

What is already known about this topic?

The Sustainable Development Goals target a 50% reduction in anemia among women of reproductive age by 2025 and the elimination of all forms of malnutrition by 2030. However, robust evidence documenting temporal changes in anemia prevalence remains scarce.

What is added by this report?

Drawing on large-scale national health examination data, this report demonstrates overall progress in reducing anemia among urban women in China between 2019 and 2024. However, it also reveals increasing prevalence in several provinces and a growing burden of moderate-to-severe anemia specifically among women aged 40–49 years.

What are the implications for public health practice?

Risk-stratified and targeted anemia prevention and control strategies are urgently needed. Priority should be given to women aged 40–49 years, women of reproductive age residing in high-burden provinces, and geographic areas where anemia prevalence either exceeds 20% or demonstrates an upward trend.

  • 1. Institute of Medical Information, Chinese Academy of Medical Sciences & Peking Union Medical College, Beijing, China
  • 2. Peking Union Medical College, Beijing, China
  • 3. Meinian Institute of Health, Beijing, China
  • 4. Meinian Public Health Institute, Health Science Center, Peking University, Beijing, China
  • 5. Department of Epidemiology and Biostatistics, School of Public Health, Peking University, Beijing, China
  • 6. Key Laboratory of Epidemiology of Major Diseases (Peking University), Ministry of Education, Beijing, China
  • 7. Peking University Center for Public Health and Epidemic Preparedness & Response, Beijing, China
  • 8. National Center for Chronic and Non-communicable Disease Control and Prevention, Chinese Center for Disease Control and Prevention & Chinese Academy of Preventive Medicine, Beijing, China
  • Corresponding authors:

    Hui Liu, liuhui@pumc.edu.cn

    Liming Li, lmlee@bjmu.edu.cn

    Bo Wang, paul@meinianresearch.com

  • Funding: Supported by the National Health Commission of the People’s Republic of China (The Evaluation of the Development Process and Policy Adaptation for the Vision of Building a Healthy China by 2035) and the Chinese Academy of Engineering (Project 2023-JB-11)
  • Online Date: March 06 2026
    Issue Date: March 06 2026
    doi: 10.46234/ccdcw2026.046
    • Introduction: Anemia represents a major health burden among women globally and poses a critical challenge to achieving international targets for reducing anemia prevalence in women of reproductive age and eliminating malnutrition by 2030. Despite its public health significance, temporal trends in anemia prevalence among Chinese women remain inadequately characterized.

      Methods: This study analyzed health examination data from 231 prefecture-level cities across all 31 provincial-level administrative divisions in China, encompassing 16,700,713 women examined in 2019 (n=7,822,489) and 2024 (n=8,878,224). Standardized prevalence estimates with 95% confidence intervals (CIs) were calculated by adjusting for provincial population structures. Temporal changes were quantified using prevalence differences with corresponding 95% CIs. Multivariable logistic regression models incorporating time-by-covariate interaction terms were employed to identify factors associated with anemia and moderate-to-severe anemia and to assess time-varying associations.

      Results: Between 2019 and 2024, the overall prevalence of anemia among urban women and women of reproductive age in China declined from 13.7% (95% CI: 13.0, 14.4) and 17.0% (95% CI: 16.3, 17.8) to 13.2% (95% CI: 12.7, 13.8) and 16.7% (95% CI: 16.1, 17.3), respectively, while moderate-to-severe anemia prevalence remained essentially unchanged. Among women aged 40–49 years, anemia prevalence increased modestly, with a statistically significant rise in moderate-to-severe anemia of 0.32 percentage points (95% CI: 0.06, 0.57). Substantial regional disparities persisted: anemia prevalence decreased in 18 provincial units but increased in the remaining 13 units. Among women of reproductive age, anemia prevalence rose in 14 provincial units, with three provinces reaching or exceeding the 20% threshold indicative of moderate public health burden.

      Conclusion: Although China has achieved modest progress in reducing anemia among women, the overall disease burden remains substantial, with persistently elevated or increasing prevalence observed in specific subpopulations. These findings underscore the urgent need for targeted, risk-stratified public health interventions that prioritize women aged 40–49 years and provinces where anemia prevalence has increased or exceeds 20%.

    • Anemia poses a widespread threat to the health of women and their offspring while also diminishing productivity and imposing substantial economic and social burdens (1). Recognizing this critical public health challenge, the United Nations Sustainable Development Goals (SDGs) have prioritized the reduction of maternal anemia. China has actively embraced this initiative by incorporating maternal anemia prevention and control into its national strategic planning. Continuous monitoring of anemia prevalence and its associated risk factors is essential for policymakers to develop and refine targeted intervention strategies. However, existing studies have predominantly examined anemia prevalence among Chinese women or pregnant women within specific years or geographic regions, leaving significant gaps in our understanding of temporal trends across the broader female population (25). To address this knowledge gap, the present study compares anemia prevalence and associated factors among urban women in China between 2019 and 2024, thereby characterizing temporal patterns and informing evidence-based public health responses.

      Data for this study were obtained from Meinian Healthcare Group, China's largest health examination chain, with service networks spanning 231 prefecture-level cities across all 31 provincial-level administrative divisions (PLADs) (6). We extracted records from non-pregnant women aged 18 years or older who underwent physical examinations during two distinct periods: January 1 to December 31, 2019, and January 1 to December 31, 2024. The final dataset comprised 16,700,713 participants, including 7,822,489 examined in 2019 and 8,878,224 in 2024. Study participants were predominantly urban residents, including employed individuals and other city dwellers.

      Demographic information, physical measurements, and laboratory tests were collected using standardized protocols and calibrated instruments across all examination centers. Following World Health Organization (WHO) criteria, anemia was defined as hemoglobin concentration <120.0 g/L (7). Anemia severity was further categorized as mild (110.0–119.0 g/L), moderate (80.0–109.0 g/L), or severe (<80.0 g/L). Hemoglobin concentrations were measured using automated hematology analyzers, with altitude-adjusted thresholds applied to specific prefecture-level cities according to WHO recommendations. For analytical purposes, the study population was stratified into six geographic regions: North (Beijing, Tianjin, Hebei, Shanxi, Inner Mongolia), East (Anhui, Jiangxi, Shanghai, Jiangsu, Zhejiang, Fujian, Shandong), Central (Henan, Hubei, Hunan, Guangxi, Guangdong, Hainan), Southwest (Chongqing, Sichuan, Guizhou, Yunnan, Tibet), Northwest (Shaanxi, Gansu, Qinghai, Ningxia, Xinjiang), and Northeast China (Liaoning, Jilin, Heilongjiang).

      To account for demographic structure and enable valid temporal comparisons, prevalence estimates and 95% confidence intervals (CIs) were standardized to the population distribution reported in China's Seventh National Population Census (2020), which represents the most recent comprehensive demographic benchmark. Differences in categorical variables were assessed using the χ2 test with Rao-Scott correction for complex survey design. Temporal changes were quantified using prevalence differences with corresponding 95% CIs for both overall anemia and moderate-to-severe anemia. We employed multivariable logistic regression models to identify risk factors associated with anemia and moderate-to-severe anemia, adjusting for age, body mass index (BMI), history of cesarean delivery, geographic region, per capita gross domestic product (GDP), Engel coefficient, hypertension, total cholesterol, triglycerides, hyperuricemia, diabetes, and impaired kidney function. To address the hierarchical data structure, models incorporated random intercepts at the city-level to account for within-city correlation. Furthermore, we constructed pooled models combining data from both years and included “Year×Covariate” interaction terms to investigate temporal changes in risk factor associations. A statistically significant interaction (P for interaction < 0.05) indicated that the strength of association for a given risk factor differed between 2019 and 2024. All statistical analyses were performed using SAS software (version 9.4, SAS Institute Inc., Cary, NC, USA), with a two-sided P<0.05 threshold for statistical significance.

      Table 1 presents the prevalence of anemia and moderate-to-severe anemia among urban women in China during 2019–2024. Overall anemia prevalence among urban women declined from 13.7% in 2019 to 13.2% in 2024, while moderate-to-severe anemia decreased slightly from 5.1% to 5.0%. Among women of reproductive age, anemia prevalence fell from 17.0% to 16.7%. However, none of these reductions achieved statistical significance.

      Variable 2019 2024 Prevalence difference for anemia
      (%, 95% CI)
      Prevalence difference2
      for moderate-severe anemia
      (%, 95% CI)
      Number (%) Anemia
      (%, 95% CI)
      Moderate-severe anemia
      (%, 95% CI)
      Number (%) Anemia
      (%, 95% CI)
      Moderate-severe anemia
      (%, 95% CI)
      Overall 7,822,489
      (100.0)
      13.7
      (13.0, 14.4)
      5.1
      (4.8, 5.4)
      8,878,224
      (100.0)
      13.2
      (12.7, 13.8)
      5.0
      (4.8, 5.3)
      −0.49
      (−1.03, 0.06)
      −0.06
      (−0.23, 0.11)
      Age group (years)
      18–29 1,577,832
      (20.2)
      11.9
      (11.1, 12.6)
      3.9
      (3.6, 4.2)
      1,521,094
      (17.1)
      11.8
      (11.2, 12.4)
      4.1
      (3.9, 4.3)
      −0.08
      (−0.75, 0.60)
      0.18
      (−0.02, 0.38)
      30–39 2,132,587
      (27.3)
      16.8
      (16.0, 17.6)
      6.6
      (6.3, 7.0)
      2,634,552
      (29.7)
      15.9
      (15.3, 16.6)
      6.5
      (6.2, 6.8)
      −0.84
      (−1.47, −0.20)*
      −0.15
      (−0.39, 0.08)
      40–49 1,732,054
      (22.1)
      19.5
      (18.7, 20.3)
      9.3
      (8.9, 9.8)
      1,932,893
      (21.8)
      19.6
      (18.9, 20.4)
      9.7
      (9.2, 10.1)
      0.15
      (−0.41, 0.71)
      0.32
      (0.06, 0.57)*
      50–59 1,497,049
      (19.1)
      9.5
      (8.9, 10.0)
      3.1
      (2.9, 3.3)
      1,657,106
      (18.7)
      8.9
      (8.5, 9.4)
      2.8
      (2.7, 3.0)
      −0.56
      (−0.99, −0.14)*
      −0.25
      (−0.36, −0.13)*
      60–69 677,413
      (8.7)
      8.4
      (7.7, 9.1)
      1.6
      (1.4, 1.7)
      837,762
      (9.4)
      7.6
      (7.1, 8.2)
      1.4
      (1.2, 1.6)
      −0.76
      (−1.35, −0.17)*
      −0.17
      (−0.32, −0.02)*
      70+ 205,554
      (2.6)
      14.3
      (13.3, 15.3)**
      3.8
      (3.4, 4.2)**
      294,817
      (3.3)
      13.4
      (12.4, 14.4)**
      3.5
      (3.0, 4.0)**
      −0.94
      (−2.12, 0.25)
      −0.31
      (−0.87, 0.25)
      Age group 2 (years)
      18–49 5,442,473
      (69.6)
      17.0
      (16.3, 17.8)
      7.2
      (6.9, 7.6)
      6,088,539
      (68.6)
      16.7
      (16.1, 17.3)
      7.3
      (7.0, 7.7)
      −0.31
      (−0.89, 0.26)
      0.09
      (−0.12, 0.30)
      50+ 2,380,016
      (30.4)
      10.0
      (9.4, 10.7)**
      2.7
      (2.5, 2.9)**
      2,789,685
      (31.4)
      9.3
      (8.8, 9.9)**
      2.5
      (2.3, 2.7)**
      −0.70
      (−1.29, −0.10)*
      −0.23
      (−0.41, −0.05)*
      BMI
      Underweight 439,078
      (5.6)
      16.6
      (15.7, 17.5)
      5.5
      (5.1, 5.8)
      433,134
      (4.9)
      17.0
      (16.2, 17.7)
      5.7
      (5.5, 6.0)
      0.34
      (−0.40, 1.09)
      0.27
      (0.03, 0.52)*
      Normal 4,535,052
      (58.0)
      15.5
      (14.7, 16.3)
      5.7
      (5.4, 6.0)
      4,970,298
      (56.0)
      14.9
      (14.3, 15.5)
      5.6
      (5.3, 5.9)
      −0.60
      (−1.20, 0.00)
      −0.11
      (−0.30, 0.08)
      Overweight 2,168,776
      (27.7)
      11.7
      (11.1, 12.2)
      4.4
      (4.2, 4.7)
      2,582,885
      (29.1)
      11.3
      (10.8, 11.8)
      4.4
      (4.2, 4.6)
      −0.36
      (−0.85, 0.12)
      −0.03
      (−0.19, 0.13)
      Obesity 679,583
      (8.7)
      9.6
      (9.2, 10.1)**
      3.8
      (3.6, 4.0)**
      891,907
      (10.0)
      9.9
      (9.5, 10.3)**
      4.1
      (3.9, 4.3)**
      0.25
      (−0.21, 0.70)
      0.27
      (0.10, 0.44)*
      History of cesarean delivery
      Yes 321,881
      (4.1)
      17.0
      (15.8, 18.3)
      7.2
      (6.6, 7.8)
      1,116,428
      (12.6)
      16.3
      (15.5, 17.0)
      7.3
      (6.9, 7.7)
      −0.78
      (−1.96, 0.41)
      0.11
      (−0.40, 0.63)
      No 7,500,608
      (95.9)
      13.6
      (12.9, 14.2)**
      5.0
      (4.8, 5.3)**
      7,761,796
      (87.4)
      12.9
      (12.3, 13.4)**
      4.8
      (4.5, 5.0)**
      −0.73
      (−1.25, −0.20)*
      −0.25
      (−0.41, −0.09)*
      Per capita GDP
      Lowest 2,010,724
      (25.7)
      14.0
      (13.2, 14.9)
      5.3
      (5.0, 5.6)
      2,021,530
      (22.8)
      13.7
      (12.9, 14.5)
      5.4
      (5.0, 5.7)
      −0.32
      (−1.16, 0.52)
      0.08
      (−0.22, 0.38)
      Up to median 2,156,418
      (27.6)
      13.0
      (11.7, 14.2)
      4.9
      (4.4, 5.4)
      2,025,231
      (22.8)
      12.7
      (11.7, 13.7)
      5.0
      (4.5, 5.4)
      −0.30
      (−1.19, 0.59)
      0.08
      (−0.20, 0.36)
      Above median 1,805,148
      (23.1)
      14.2
      (12.6, 15.9)
      5.2
      (4.5, 5.9)
      2,068,072
      (23.3)
      12.7
      (11.7, 13.8)
      4.8
      (4.3, 5.3)
      −1.51
      (−3.04, 0.02)
      −0.40
      (−0.83, 0.02)
      Highest 1,850,199
      (23.7)
      13.9
      (12.5, 15.4)
      5.1
      (4.5, 5.6)
      2,763,391
      (31.1)
      13.9
      (12.5, 15.3)
      5.0
      (4.5, 5.5)
      −0.04
      (−1.03, 0.94)
      −0.12
      (−0.44, 0.20)
      Engel coefficient
      Highest 2,341,106
      (29.9)
      13.8
      (12.7, 14.9)
      4.9
      (4.5, 5.3)
      2,504,518
      (28.2)
      13.5
      (12.4, 14.5)
      4.9
      (4.5, 5.4)
      −0.35
      (−1.24, 0.54)
      0.06
      (−0.25, 0.36)
      Above median 1,608,892
      (20.6)
      13.8
      (12.0, 15.6)
      5.0
      (4.2, 5.8)
      1,843,720
      (20.8)
      13.2
      (12.0, 14.3)
      4.9
      (4.3, 5.4)
      −0.60
      (−1.69, 0.49)
      −0.16
      (−0.50, 0.18)
      Up to median 2,026,962
      (25.9)
      13.9
      (12.7, 15.2)
      5.3
      (4.9, 5.7)
      2,292,146
      (25.8)
      13.3
      (12.4, 14.2)
      5.2
      (4.8, 5.6)
      −0.65
      (−1.62, 0.31)
      −0.08
      (−0.36, 0.21)
      Lowest 1,845,529
      (23.6)
      13.2
      (12.1, 14.3)
      5.3
      (4.9, 5.8)
      2,237,840
      (25.2)
      12.8
      (11.7, 13.9)
      5.3
      (4.7, 5.8)
      −0.42
      (−1.97, 1.12)
      −0.08
      (−0.55, 0.39)
      Geographic region
      North 857,401
      (11.0)
      11.9
      (10.8, 13.0)
      5.1
      (4.7, 5.5)
      1,474,737
      (16.6)
      12.7
      (11.4, 14.0)
      5.3
      (4.7, 6.0)
      0.81
      (−0.65, 2.28)
      0.26
      (−0.26, 0.77)
      East 2,748,022
      (35.1)
      13.7
      (12.7, 14.7)
      5.1
      (4.8, 5.5)
      3,133,161
      (35.3)
      13.7
      (13.0, 14.4)
      5.1
      (4.8, 5.4)
      −0.02
      (−0.86, 0.82)
      0.03
      (−0.21, 0.26)
      Central 2,031,347
      (26.0)
      16.1
      (14.8, 17.4)
      5.8
      (5.3, 6.3)
      2,254,437
      (25.4)
      15.0
      (14.1, 15.9)
      5.6
      (5.2, 5.9)
      −1.11
      (−2.39, 0.18)
      −0.23
      (−0.65, 0.18)
      Southwest 1,001,486
      (12.8)
      11.3
      (10.1, 12.5)
      3.8
      (3.4, 4.2)
      794,601
      (9.0)
      10.6
      (9.5, 11.6)
      3.7
      (3.3, 4.0)
      −0.75
      (−1.71, 0.20)
      −0.13
      (−0.38, 0.12)
      Northwest 443,920
      (5.7)
      14.1
      (12.0, 16.2)
      6.0
      (5.3, 6.6)
      448,662
      (5.1)
      12.9
      (11.7, 14.0)
      5.8
      (5.4, 6.2)
      −1.23
      (−3.01, 0.55)
      −0.16
      (−0.77, 0.45)
      Northeast 740,313
      (9.5)
      11.7
      (11.0, 12.4)**
      4.1
      (3.7, 4.4)**
      772,626
      (8.7)
      10.4
      (9.7, 11.2)**
      4.0
      (3.8, 4.2)**
      −1.23
      (−2.35, −0.12)*
      −0.07
      (−0.54, 0.37)
      Note: The prevalence difference and P represent comparisons for the overall anemia rate.
      Abbreviation: CI=confidence interval; GDP=gross domestic product; BMI=body mass index.
      * P<0.05;
      ** P<0.01.

      Table 1.  Prevalence of anemia by severity among urban women in China, 2019 versus 2024.

      Age-stratified analysis revealed significant disparities in anemia prevalence and severity across age groups. Between 2019 and 2024, anemia prevalence decreased in all age groups except women aged 40–49 years, who experienced a slight increase. The reductions were particularly pronounced and statistically significant in the 30–39 and 50–69 age groups. For moderate-to-severe anemia, prevalence among women aged 40–49 years increased significantly over the five-year period [odds ratio (OR)=0.32, 95% CI: 0.06, 0.57], whereas prevalence among women aged 50–59 and 60–69 years decreased significantly (OR=−0.25, 95% CI: −0.36, −0.13; OR=−0.17, 95% CI: −0.32, −0.02).

      Regional analysis revealed statistically significant differences in both overall anemia and moderate-to-severe anemia prevalence among Chinese urban women in both 2019 and 2024. Notably, only women in Northeast China demonstrated a significant decline in anemia prevalence during this period. Figure 1 provides detailed provincial-level data. Among all age groups, anemia prevalence decreased in 18 provincial-level administrative divisions (PLADs) while increasing in 13 PLADs, including Hebei, Guizhou, and Tibet. Among women of reproductive age specifically, 17 PLADs experienced declining prevalence whereas 14 PLADs showed increases, with Tibet, Shandong, and Hebei reaching the 20% threshold.
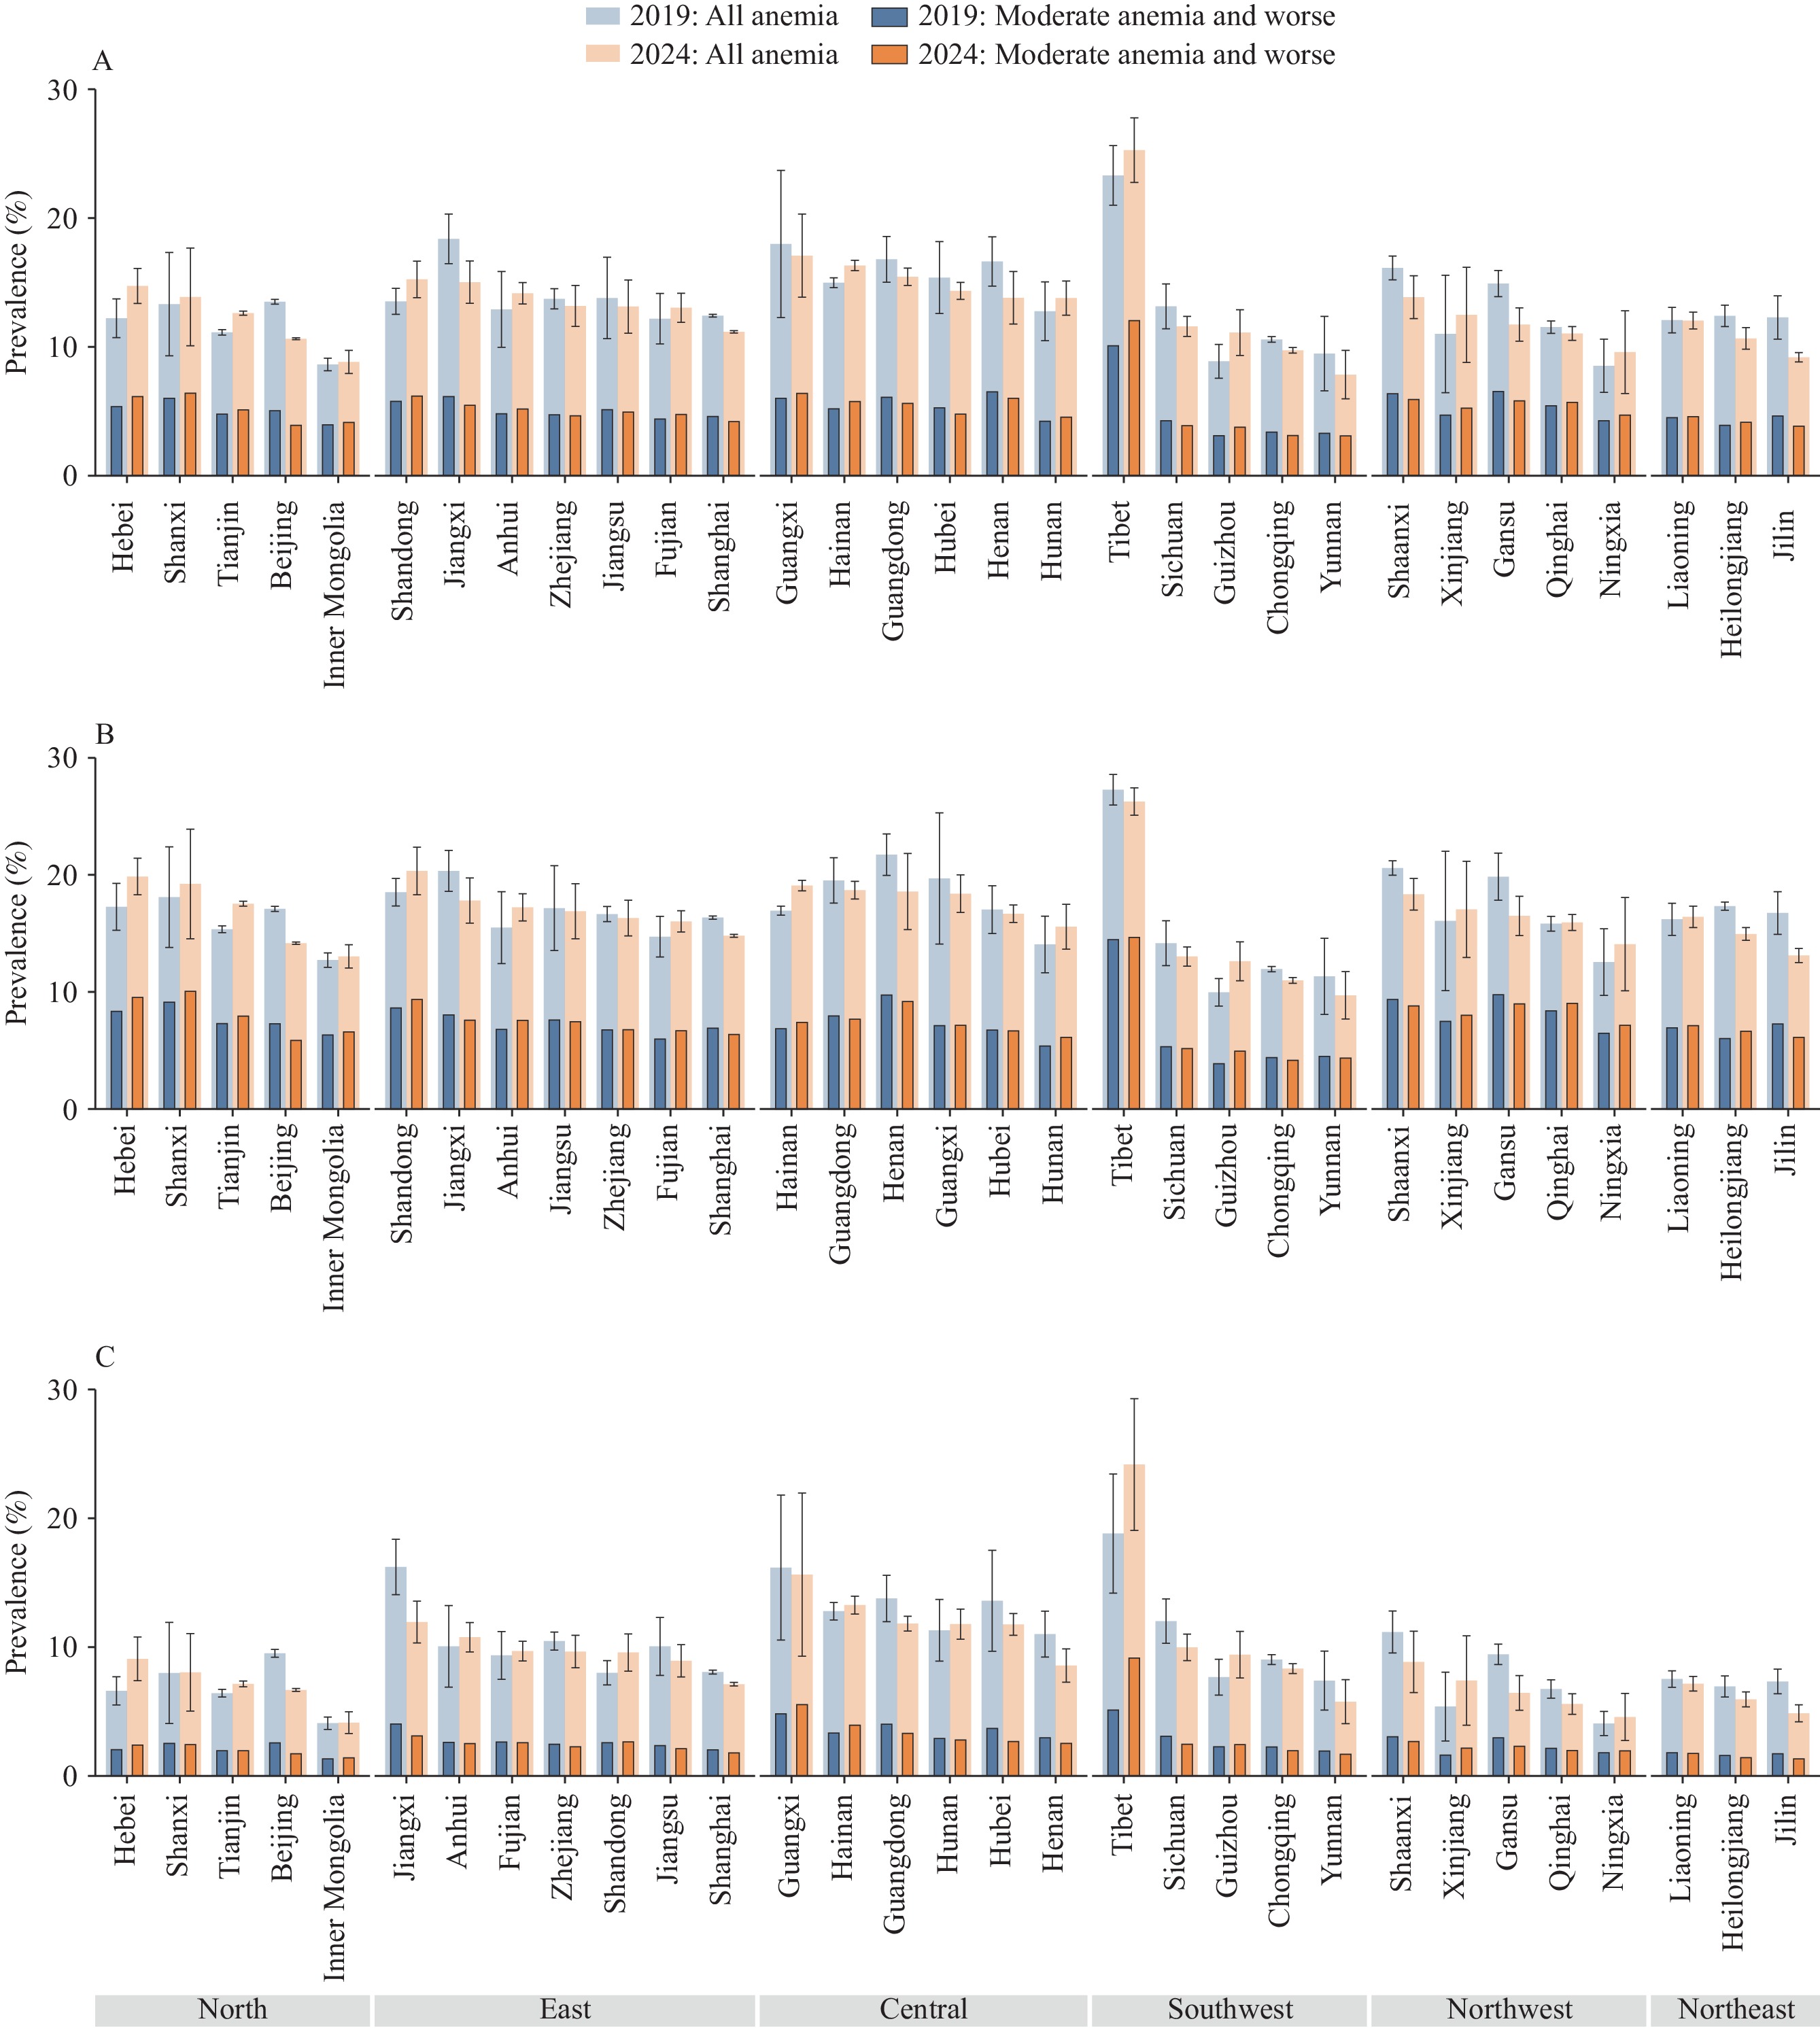
      Figure 1. 

      Regional disparities in the prevalence of anemia among urban women in China, standardized by age, 2019 versus 2024. (A) Anemia among all urban women; (B) Anemia among urban women aged 18–49 years; (C) Anemia among urban women aged 50 years and over.

      Multivariate analysis identified several factors significantly associated with anemia and moderate-to-severe anemia risk among Chinese urban women (Table 2). Relative to women aged 18–29 years, all other age groups except those aged 60–69 years demonstrated significantly elevated anemia risk. Age-year interaction analysis, however, revealed a significant temporal decline in anemia and moderate-to-severe anemia risk across all age groups except women aged 40–49 years (interaction OR=0.99, 95% CI: 0.99, 1.01). Underweight women exhibited significantly increased anemia risk that intensified over time, whereas obese women showed significantly reduced risk (OR=0.80, 95% CI: 0.78, 0.82), with this protective effect strengthening over time (OR=1.01, 95% CI: 1.00, 1.01). A history of cesarean section was associated with elevated anemia risk (OR=1.07, 95% CI: 1.04, 1.10), and this association with moderate-to-severe anemia strengthened over time (OR=1.02, 95% CI: 1.00, 1.03). Women residing in areas with the lowest per capita GDP demonstrated significantly higher anemia risk compared to those in the highest GDP areas (OR=1.15, 95% CI: 1.03, 1.28), though this association remained stable over time.

      Variable Anemia Moderate-severe anemia
      Overall OR
      (95% CI)
      Interaction OR
      (95% CI)
      P for interaction Overall OR
      (95% CI)
      Interaction OR
      (95% CI)
      P for interaction
      Year
      2019 Reference Reference
      2024 0.98
      (0.93, 1.02)
      1.01
      (0.97, 1.05)
      Age group (years)
      18–29 Reference Reference Reference Reference
      30–39 1.52
      (1.48, 1.56)**
      0.987
      (0.980, 0.995)
      <0.001 1.71
      (1.66, 1.76)**
      0.984
      (0.978, 0.991)
      <0.001
      40–49 2.16
      (2.11, 2.22)**
      0.999
      (0.991, 1.008)
      0.908 2.88
      (2.79, 2.97)**
      0.994
      (0.987, 1.002)
      0.159
      50–59 1.09
      (1.04, 1.14)**
      0.982
      (0.973, 0.990)
      <0.001 1.01
      (0.97, 1.06)
      0.969
      (0.961, 0.977)
      <0.001
      60–69 1.01
      (0.94, 1.09)
      0.923
      (0.961, 0.985)
      <0.001 0.53
      (0.47, 0.59)**
      0.961
      (0.943, 0.980)
      <0.001
      70+ 1.76
      (1.64, 1.88)**
      0.979
      (0.962, 0.995)
      0.013 1.15
      (1.02, 1.30)*
      0.969
      (0.940, 0.998)
      0.038
      BMI
      Underweight 1.12
      (1.10, 1.15)**
      1.015
      (1.010, 1.020)
      <0.001 1.02
      (0.99, 1.04)
      1.013
      (1.006, 1.021)
      <0.001
      Normal Reference Reference Reference Reference
      Overweight 0.86
      (0.85, 0.87)**
      0.998
      (0.995, 1.001)
      0.205 0.97
      (0.96, 0.99)**
      0.998
      (0.994, 1.001)
      0.156
      Obesity 0.80
      (0.78, 0.82)**
      1.009
      (1.004, 1.014)
      <0.001 0.98
      (0.96, 1.01)
      1.007
      (1.002, 1.013)
      0.010
      History of cesarean delivery
      Yes 1.07
      (1.04, 1.10)**
      1.006
      (0.993, 1.020)
      0.349 1.10
      (1.07, 1.14)**
      1.015
      (1.003, 1.027)
      0.015
      No Reference Reference Reference Reference
      Per capita GDP
      Lowest 1.15
      (1.03, 1.28)*
      0.998
      (0.976, 1.020)
      0.856 1.20
      (1.08, 1.34)**
      1.011
      (0.991, 1.030)
      0.284
      Up to median 1.05
      (0.95, 1.17)
      0.995
      (0.972, 1.018)
      0.680 1.10
      (1.00, 1.22)*
      1.007
      (0.988, 1.026)
      0.468
      Above median 1.08
      (0.95, 1.22)
      0.976
      (0.947, 1.006)
      0.121 1.13
      (1.00, 1.27)*
      0.987
      (0.966, 1.009)
      0.258
      Highest Reference Reference Reference Reference
      Engel coefficient
      Highest 1.08
      (0.99, 1.17)
      1.005
      (0.974, 1.037)
      0.755 0.97
      (0.89, 1.06)
      1.011
      (0.988, 1.035)
      0.350
      Above median 1.05
      (0.94, 1.17)
      0.999
      (0.966, 1.033)
      0.968 0.95
      (0.86, 1.05)
      0.999
      (0.976, 1.024)
      0.958
      Up to median 1.07
      (0.97, 1.19)
      1.004
      (0.972, 1.037)
      0.828 0.99
      (0.90, 1.09)
      1.009
      (0.987, 1.032)
      0.432
      Lowest Reference Reference Reference Reference
      Geographic region
      North 1.13
      (1.01, 1.27)*
      1.035
      (0.999, 1.072)
      0.056 1.21
      (1.09, 1.35)**
      1.007
      (0.973, 1.042)
      0.696
      East 1.25
      (1.15, 1.35)**
      1.024
      (0.998, 1.050)
      0.075 1.23
      (1.15, 1.31)**
      1.001
      (0.974, 1.029)
      0.934
      Central 1.41
      (1.29, 1.55)**
      1.005
      (0.976, 1.036)
      0.728 1.35
      (1.24, 1.46)**
      0.991
      (0.960, 1.022)
      0.563
      Southwest 0.90
      (0.81, 1.01)
      1.007
      (0.978, 1.036)
      0.654 0.83
      (0.76, 0.91)**
      0.990
      (0.961, 1.020)
      0.506
      Northwest 1.10
      (0.95, 1.28)
      0.998
      (0.962, 1.035)
      0.914 1.26
      (1.13, 1.40)**
      0.991
      (0.958, 1.025)
      0.585
      Northeast Reference Reference Reference Reference
      Note: “—” means not applicable.
      Abbreviation: OR=odds ratio; CI=confidence interval; GDP=gross domestic product; BMI=body mass index.
      * P<0.05;
      ** P<0.01.

      Table 2.  Multilevel logistic regression analysis of factors associated with anemia among urban women in China: Overall effects and interactions with year (2019 versus 2024).

    • Although anemia among women remains a major public health concern, comprehensive data on the prevalence, severity, and temporal trends of anemia among Chinese women have been limited. To address this gap, the present study leveraged national-level health examination data to characterize recent changes in anemia prevalence and its associated risk factors. Our findings provide a detailed portrait of anemia burden among urban women at both provincial and national levels, revealing substantial temporal, demographic, and regional heterogeneity. These results offer robust scientific evidence to inform the identification of high-risk subpopulations and the development of targeted, stratified anemia prevention and control strategies.

      The WHO classifies anemia prevalence below 20% as a mild public health burden, 20%–40% as moderate, and above 40% as severe (7). By this criterion, the overall anemia burden among Chinese urban women remains mild. While the latest WHO global anemia assessment report indicates a stagnation in progress toward reducing anemia among women of reproductive age worldwide, anemia prevalence among urban Chinese women of reproductive age declined from 2019 to 2024, with decreases observed in most PLADs. This trend demonstrates that China has achieved measurable progress in maternal anemia prevention and control, likely attributable to the implementation of national nutrition and health policies. These include the Healthy China Initiative (2019–2030), which explicitly outlines targeted actions for rational dietary practices, and the National Nutrition Plan (2017–2030), which establishes specific goals for reducing population anemia prevalence (89). Nevertheless, anemia prevalence among urban women has risen over the past five years in several provinces, with prevalence reaching or exceeding the 20% threshold in Tibet, Shandong, and Hebei—indicating a moderate disease burden in these regions that warrants heightened public health attention.

      This study confirmed age as an independent risk factor for anemia, consistent with previous findings. Although overall anemia prevalence did not differ significantly between 2019 and 2024, age-year interaction effects revealed substantial heterogeneity in temporal risk patterns across age groups. Anemia risk decreased significantly over time among women aged 30–39, 50–59, 60–69, and 70+ years, while remaining stable in the 40–49 age group. This distinctive pattern likely reflects the higher susceptibility to abnormal uterine bleeding in women aged 40–49 years — often attributable to conditions such as uterine fibroids and perimenopausal endocrine disorders (1012). These findings underscore the need for age-differentiated anemia prevention and control strategies, with particular emphasis on strengthening health management for women aged 40–49 years to further reduce the overall anemia burden.

      Women with a history of cesarean section demonstrated a significantly elevated anemia risk, consistent with previous research (2). This association likely stems from both greater perinatal blood loss and increased risk of uterine impairment associated with cesarean delivery, either of which can substantially increase anemia susceptibility (1314). Moreover, this study revealed that the association between cesarean section history and anemia risk strengthened significantly over time. These findings highlight the importance of increasing clinical awareness of cesarean section history as an anemia risk factor and reducing unnecessary cesarean deliveries.

      This study has several limitations. First, the cross-sectional design precludes definitive causal inferences regarding factors contributing to anemia in women. Second, due to practical constraints on data processing timelines, this study compared anemia prevalence at only two discrete time points, failing to capture potential fluctuations during the intervening period—a limitation that may affect the precision of temporal trend assessments. Third, although automated hematology analyzers were used to measure hemoglobin levels at all examination centers with standardized calibration protocols, variations in specific instrument models and testing reagents across sites may have introduced measurement variability.

      In conclusion, China has made measurable progress in maternal anemia prevention and control, yet substantial disease burden persists in certain provinces and population subgroups. Targeted and risk-stratified public health interventions are warranted, with priority given to women aged 40–49 years, women with a history of cesarean section, and provinces where anemia prevalence has increased or exceeded 20%.

    • Approval by the Peking University Institutional Review Board (IRB-0000152-19077).

  • Conflicts of interest: No conflicts of interest.
  • Reference (14)

    Citation:

    Catalog

      /

      DownLoad:  Full-Size Img  PowerPoint
      Return
      Return