
 Download:


-
Introduction Menstrual irregularity is a hallmark clinical feature of polycystic ovary syndrome (PCOS), a well-established risk factor for spontaneous abortion (SA). However, robust population-level evidence directly linking specific menstrual patterns to SA risk remains lacking, as prior studies have been limited by small sample sizes and single-center designs.
Methods We analyzed data from 3.9 million women across nine Chinese provinces who participated in the National Free Preconception Care Project (NFPCP) between 2013 and 2024. Logistic regression was used to examine associations between menstrual characteristics and SA risk. Multilevel models, restricted cubic splines, and subgroup analyses were employed as extended analytical approaches to confirm the robustness of findings.
Results Irregular menstrual cycles [adjusted odds ratio (aOR)=1.11, 95% confidence interval (CI): 1.05, 1.17] and irregular periods (aOR=1.23, 95% CI: 1.15, 1.32) were independently associated with SA. The combination of long cycles (38-53 days) and prolonged periods (>7 days) conferred the highest risk (aOR=1.82, 95% CI: 1.33, 2.49). Dose-response relationships and subgroup analyses yielded patterns consistent with the primary analysis.
Conclusions These findings support the utility of menstrual characteristic assessment as an effective tool for SA risk stratification before and during pregnancy. Greater clinical attention should be directed toward women with abnormal menstrual cycles and/or periods, who warrant targeted monitoring and intervention — measures that offer meaningful benefit even for those who have already achieved conception.
-
Spontaneous abortion (SA), defined as pregnancy loss before viability, affects approximately 23 million women each year. Polycystic ovary syndrome (PCOS), a common endocrinopathy affecting up to 13% of reproductive-age women, is associated with a 49–53% increased risk of SA (1). PCOS is frequently underdiagnosed (2), and its complex diagnostic criteria can delay confirmation by more than 2 years (3). Since anovulation — affecting 75%–85% of PCOS patients (4–5) — is central to the condition and is closely associated with menstrual dysfunction, the characteristic patterns of these menstrual abnormalities may themselves serve as simple, accessible early warning signs. Menstrual characteristics (cycle length, bleeding duration) directly reflect endocrine health in women of reproductive age (6). Accordingly, assessment of menstrual characteristics represents a simple, low-cost, and clinically accessible tool for stratifying SA risk during preconception and early pregnancy. Incorporating this assessment into routine care could enable earlier identification of high-risk women, facilitating targeted monitoring and timely intervention.
Current research on menstrual characteristics has focused predominantly on fertility assessment during preconception, with limited robust evidence linking specific menstrual patterns to SA risk — a gap attributable in part to the small sample sizes and single-center designs of prior studies (7–9). To address this limitation, we analyzed data from over 3 million reproductive-aged women across nine Chinese regions within the National Free Preconception Checkups Project (NFPCP) to investigate the independent and combined associations of menstrual characteristics with SA risk.
This retrospective cohort study drew on data from the NFPCP, a population-based initiative launched in 2010 by the National Health and Family Planning Commission and the Ministry of Finance to provide free preconception health check-ups to rural and urban couples throughout mainland China. The project encompasses free health examinations, risk assessments, consultations, early pregnancy follow-ups, and pregnancy outcome follow-ups; its design, organization, and implementation have been described previously (8,10). The present study included women aged 20–49 years from nine provinces spanning eastern, central, and western China (
Supplementary Table S1 ) who participated in the NFPCP between January 1, 2013, and December 31, 2024. Women were excluded if they met any of the following criteria: 1) multiple births; 2) ectopic pregnancy; 3) medically induced abortion; or 4) missing data on both menstrual cycle and menstrual period. After applying these exclusion criteria, a final cohort of 3,865,348 women was retained for analysis (Figure 1).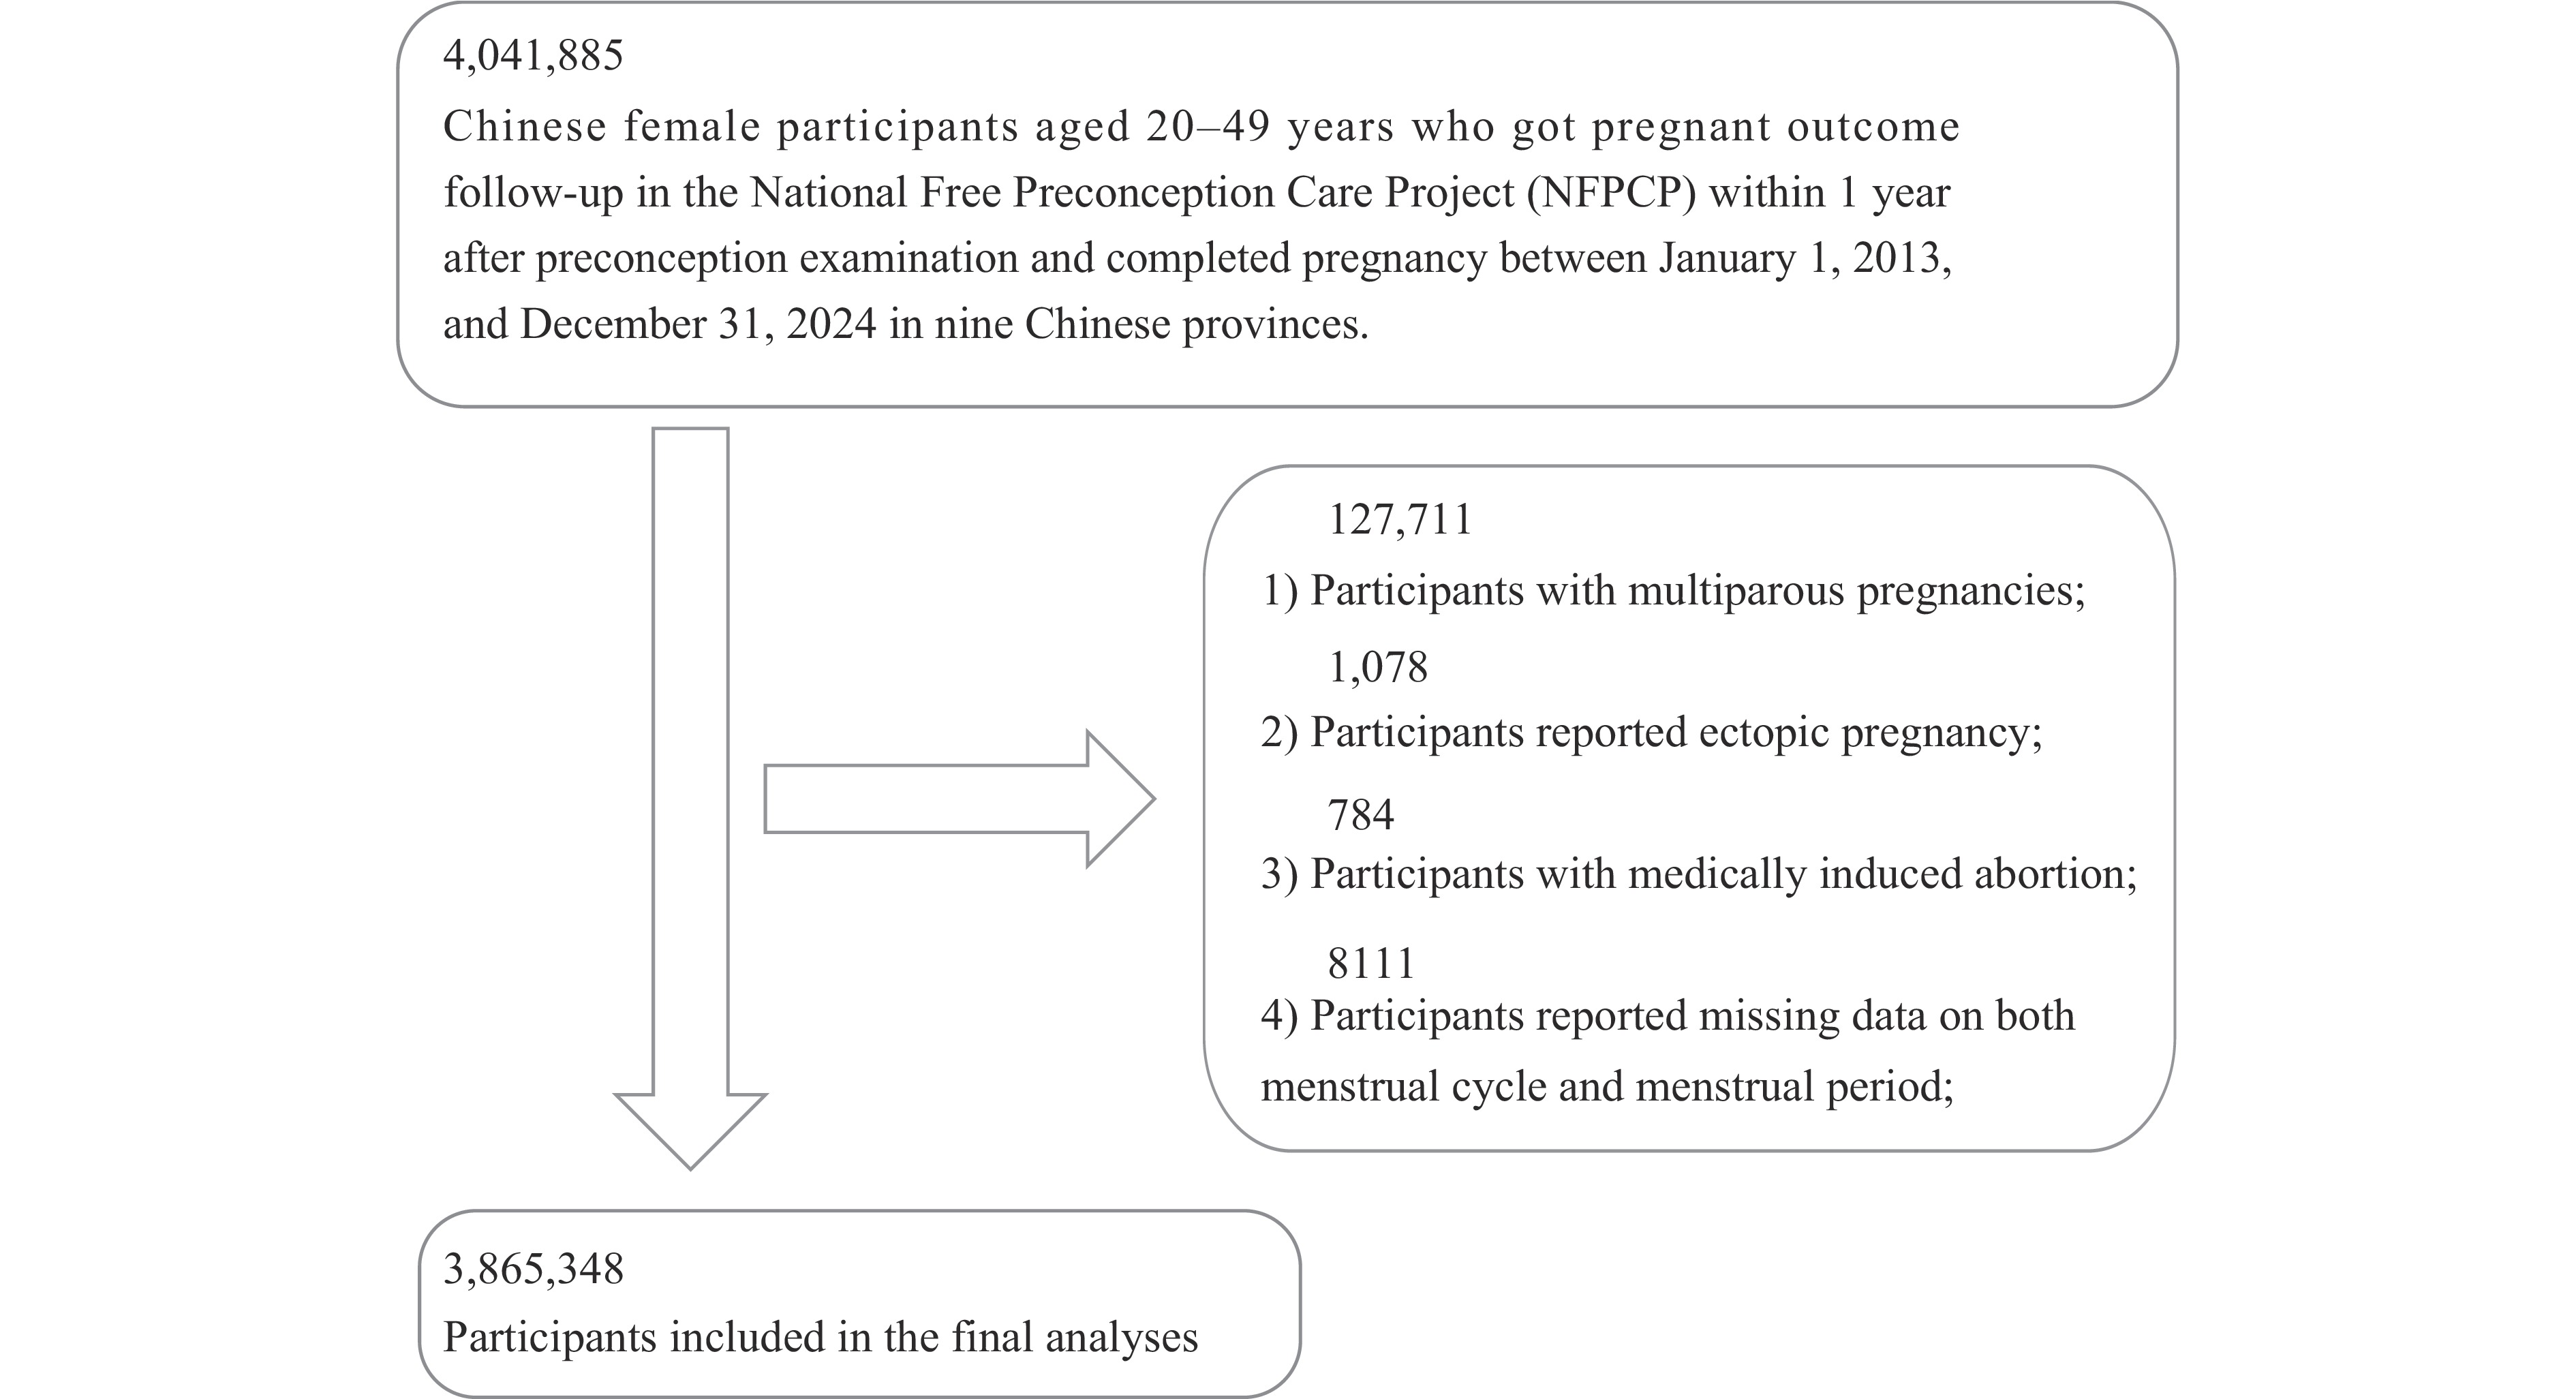 Figure 1.
Flowchart of the study population selection.
Abbreviation: NFPCP=National Free Preconception Checkups Project.Menstrual characteristics (cycle length and period length) were assessed by trained health workers through structured interviews using a standardized household health questionnaire; data were entered directly into a web-based electronic collection system and transmitted to the national database center. Based on self-reported averages, menstrual cycles were categorized as regular (24–38 days) or irregular (≤24 days, 39–53 days, or >53 days), and menstrual period as normal (3–7 days) or abnormal (<3 days or >7 days) (11–12). The primary outcome was SA, defined as fetal death or pregnancy loss before 28 weeks of gestation. Baseline characteristics were compared across menstrual regularity groups using descriptive statistics and chi-square (χ2) tests.
The primary analysis employed logistic regression models to estimate odds ratios (ORs) and 95% confidence intervals (95% CIs) for associations between menstrual characteristics and SA. To minimize confounding, we adjusted for a comprehensive set of covariates spanning demographic, physiological, and lifestyle factors across three sequential models: unadjusted (Model 1), adjusted for high-risk factors (Model 2), and fully adjusted (Model 3); detailed covariate definitions are provided in
Supplementary Table S2 . As an extended analytical approach, multilevel logistic regression models incorporating random intercepts at the economic region level were fitted to account for the clustering of nine provinces within three economic regions (Model 4). Dose–response relationships were evaluated using restricted cubic splines with four knots. Subgroup analyses stratified by age, body mass index (BMI), and adverse pregnancy history were performed to assess the robustness of the primary findings. Baseline characteristics were compared across menstrual regularity groups using descriptive statistics and chi-square tests. All analyses were performed in R version 4.1.0 (R Foundation for Statistical Computing, Vienna, Austria); two-sided P<0.05 was considered statistically significant.The final analysis included 3,865,348 reproductive-age women (mean age 27±4.28 years), among whom 64,834 SA events were recorded (incidence: 1.68%). Complete menstrual cycle and menstrual period data were available for 3,860,915 and 3,791,110 women, with irregularity prevalences of 3.05% and 1.63%, respectively. Women with irregular menstrual cycles had higher rates of overweight or obesity and adverse pregnancy history. Women with abnormal menstrual periods showed higher prevalences of scanty menstrual flow and adverse pregnancy history (all P<0.001; Table 1 and
Supplementary Table S3 ).Maternal characteristic Menstruation P Menstruation P Menstrual cycle regularity Menstrual period regularity Regularity
(N=3,743,087)Irregularity
(N=117,828)Regularity
(N=3,729,300)Irregularity
(N=61,810)Age at last menstrual period, years (n, %) <0.001 <0.001 20–24 1,478,896 (39.51) 42,220 (35.83) 1,476,231 (39.58) 18,311 (29.62) 25–29 1,561,268 (41.71) 51,791 (43.95) 1,556,429 (41.73) 26,447 (42.79) 30–34 506,842 (13.54) 18,032 (15.30) 503,009 (13.49) 11,900 (19.25) 35–49 196,081 (5.24) 5,785 (4.91) 193,661 (5.19) 5,152 (8.34) BMI (kg/m2) <0.001 <0.001 Underweight 375,595 (10.03) 11,720 (9.95) 373,815 (10.02) 7,173 (11.60) Normal weight 2,672,162 (71.39) 74,583 (63.30) 2,658,515 (71.29) 41,536 (67.20) Overweight 551,434 (14.73) 22,657 (19.23) 551,471 (14.79) 10,120 (16.37) Obesity 139,047 (3.71) 8,590 (7.29) 140,861 (3.78) 2,896 (4.69) Unknown 4,849 (0.13) 278 (0.24) 4,668 (0.13) 85 (0.14) Blood sugar status (n, %) <0.001 <0.001 Normal glucose level 3,216,942 (85.94) 100,104 (84.96) 3,204,832 (85.94) 52,510 (84.95) Pre-diabetes 479,579 (12.81) 15,870 (13.47) 477,901 (12.81) 8,490 (13.74) Diabetes 29,522 (0.79) 1,204 (1.02) 29,639 (0.79) 504 (0.82) Unknown 17,044 (0.46) 650 (0.55) 16,958 (0.45) 306 (0.50) Blood pressure status (n, %) <0.001 <0.001 Normal 3,332,227 (89.02) 100,573 (85.36) 3,319,996 (89.02) 53,053 (85.83) Hypertension 39,778 (1.06) 2,118 (1.80) 39,659 (1.06) 1,035 (1.67) Unknown 371,082 (9.91) 15,137 (12.85) 369,675 (9.91) 7,722 (12.49) Education level (n, %) <0.001 <0.001 Junior high school or below 2,426,323 (64.82) 66,952 (56.82) 2,408,328 (64.58) 39,942 (64.62) Senior high school or above 1,181,982 (31.58) 46,838 (39.75) 1,188,935 (31.88) 20,604 (33.33) Unknown 134,782 (3.60) 4,038 (3.43) 132,067 (3.54) 1,264 (2.04) Ethnicity (n, %) <0.001 <0.001 Han 3,610,322 (96.45) 114,083 (96.82) 3,599,376 (96.52) 58,988 (95.43) Others 78,800 (2.11) 2,118 (1.80) 77,690 (2.08) 2,384 (3.86) Unknown 53,965 (1.44) 1,627 (1.38) 52,264 (1.40) 438 (0.71) Residence type (n, %) <0.001 <0.001 Urban 233,895 (6.25) 12,246 (10.39) 234,371 (6.28) 6,240 (10.10) Rural 3,509,192 (93.75) 105,582 (89.61) 3,494,959 (93.72) 55,570 (89.90) Dysmenorrhea status (n, %) <0.001 <0.001 None 2,902,978 (77.56) 76,971 (65.32) 2,886,189 (77.39) 44,034 (71.24) Mild 801,085 (21.40) 36,225 (30.74) 803,670 (21.55) 16,268 (26.32) Severe 29,654 (0.79) 2,903 (2.46) 30,188 (0.81) 1,347 (2.18) Unknown 9,370 (0.25) 1,729 (1.47) 9,283 (0.25) 161 (0.26) Menstrual flow (n, %) <0.001 <0.001 Slight 72,082 (1.93) 6,726 (5.79) 69,712 (1.87) 6,110 (9.90) Moderate 3,594,677 (96.22) 104,608 (90.03) 3,584,151 (96.30) 52,417 (84.93) Large 69,000 (1.85) 4,857 (4.18) 68,144 (1.83) 3,188 (5.17) Adverse pregnancy history (n, %) <0.001 <0.001 No 3,186,350 (85.13) 90,078 (76.45) 3,173,876 (85.11) 44,634 (72.21) Yes 556,737 (14.87) 27,750 (23.55) 555,454 (14.89) 17,176 (27.79) Parity (n, %) <0.001 <0.001 Nulliparous 2,085,449 (55.71) 61,670 (52.34) 2,081,289 (55.81) 25,327 (40.98) Parous 1,657,638 (44.29) 56,158 (47.66) 1,648,041 (44.19) 36,483 (59.02) Note: All variables are presented as N (%). All P<0.001. Baseline characteristics were stratified by menstrual cycle regularity — regular (24–38 days) versus irregular (<24 days, 39–53 days, or >53 days) — and by menstrual bleeding duration (menstrual period) — normal (3–7 days) versus abnormal (<3 or >7 days). All variables were classified into appropriate categories, and chi-square (χ2) tests were used to calculate P.
Abbreviation: BMI=body mass index.Table 1. Baseline characteristics of the study population by menstrual cycle and menstrual period.
Logistic regression models confirmed that both irregular menstrual cycles [adjusted OR (aOR)=1.11, 95% CI: 1.05, 1.17] and abnormal menstrual periods (aOR=1.23, 95% CI: 1.15, 1.32) were independently associated with increased SA risk after full covariate adjustment (Model 3), with consistent estimates obtained from multilevel models (Model 4). Further categorization revealed dose-response relationships for both menstrual characteristics. Very long cycles (>53 days) conferred the highest cycle-related risk (aOR=1.25, 95% CI: 1.06, 1.48), and prolonged menstrual periods (>7 days) were also a significant risk factor (aOR=1.31, 95% CI: 1.20, 1.42) (Table 2). Restricted cubic spline (RCS) analyses revealed a J-shaped relationship for cycle length and a U-shaped relationship for menstrual period duration (both P for nonlinearity <0.001; Figure 2). In joint analyses, isolated irregularities in either dimension were each significantly associated with SA risk (cycles only: aOR=1.10; period only: aOR=1.24). Combined abnormalities showed an elevated point estimate (aOR=1.14, 95% CI: 0.90, 1.44) that did not reach statistical significance, a result likely attributable to the limited number of women in this category yielding wide confidence intervals. Notably, the combination of long cycles (39–53 days) and prolonged periods (>7 days) conferred the highest overall risk (Model 3: aOR=1.82, 95% CI: 1.33, 2.49), with multilevel models (Model 4) producing consistent estimates across all joint exposure categories (Table 3). Finally, stratified analyses suggested potentially enhanced associations among women aged ≥35 years, those with overweight or obesity, and those with a history of adverse pregnancy outcomes (Figure 3).
Characteristic Total participants SA cases
n (%)OR (95% CI) Model 1 Model 2 Model 3 Model 4 Menstrual cycle Binary classification Regular (24–38 days) 3,743,087 62,165 (1.66) 1.00 (Reference) 1.00 (Reference) 1.00 (Reference) 1.00 (Reference) Irregular 117,828 2,559 (2.17) 1.31 (1.26, 1.37) 1.23 (1.18, 1.29) 1.11 (1.05, 1.17) 1.11 (1.05, 1.17) Detailed classification 24D–38D 3,743,087 62,165 (1.66) 1.00 (Reference) 1.00 (Reference) 1.00 (Reference) 1.00 (Reference) <24D 69,579 1,454 (2.09) 1.26 (1.20, 1.33) 1.22 (1.15, 1.29) 1.12 (1.04, 1.20) 1.10 (1.02, 1.17) 39D–53D 38,707 865 (2.23) 1.35 (1.26, 1.45) 1.22 (1.13, 1.32) 1.06 (0.97, 1.17) 1.09 (0.99, 1.12) >53D 9,542 240 (2.52) 1.53 (1.34, 1.74) 1.40 (1.21, 1.61) 1.25 (1.06, 1.48) 1.25 (1.06, 1.48) Menstrual period Binary classification Regular (3D–7D) 3,729,330 61,780 (1.66) 1.00 (Reference) 1.00 (Reference) 1.00 (Reference) 1.00 (Reference) Irregular 61,810 1,643 (2.66) 1.62 (1.54, 1.70) 1.44 (1.36, 1.52) 1.23 (1.15, 1.32) 1.26 (1.17, 1.35) Detailed classification 3D–7D 3,729,330 61,780 (1.66) 1.00 (Reference) 1.00 (Reference) 1.00 (Reference) 1.00 (Reference) <3D 29,729 743 (2.50) 1.52 (1.41, 1.64) 1.35 (1.25, 1.46) 1.11 (0.99, 1.25) 1.18 (1.05, 1.32) >7D 32,081 900 (2.81) 1.71 (1.60, 1.83) 1.53 (1.42, 1.64) 1.31 (1.20, 1.42) 1.31 (1.20, 1.42) Note: Data are presented as odds ratio (95% CI). Estimates with 95% CIs excluding 1 are considered statistically significant at P<0.05. Models examined associations between menstrual cycle regularity (regular: 24–38 days; irregular: <24, 39–53, or >53 days) and menstrual period duration (normal: 3–7 days; abnormal: <3 or >7 days) with SA risk. Four models were fitted: Model 1 (unadjusted), Model 2 (adjusted for high-risk factors), and Model 3 (fully adjusted) using conventional logistic regression; Model 4 (fully adjusted) using multilevel logistic regression as an extended analytical approach. All covariates are listed in Supplementary Table S2 .
Abbreviation: OR=odds ratio; CI=confidence interval; SA=spontaneous abortion.Table 2. Individual associations between menstrual characteristics and SA risk.
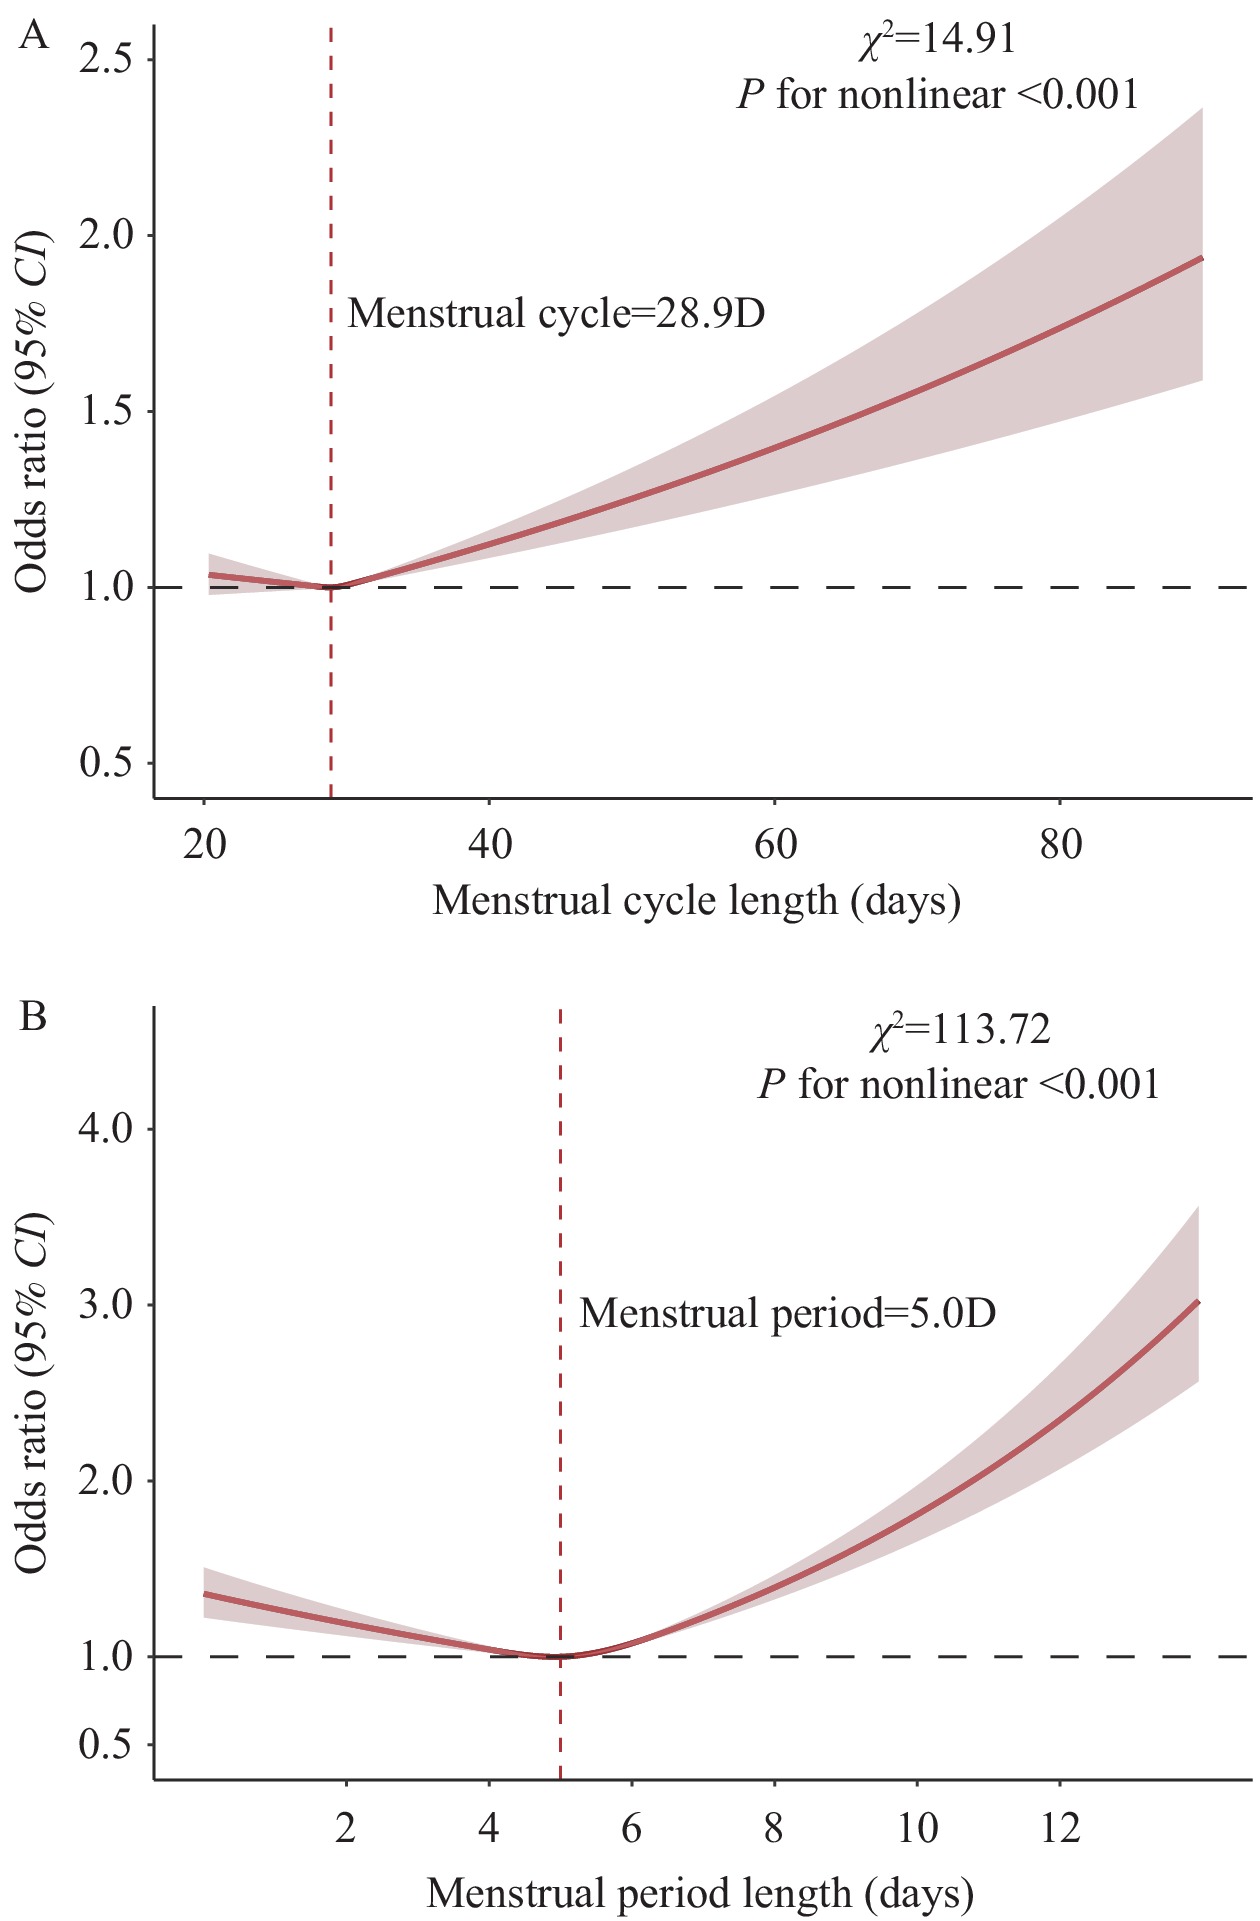 Figure 2.
Dose-response relationship between menstrual characteristics and SA risk (restricted cubic spline analysis). (A) Menstrual cycle length (RCS-adjusted logistic regression); (B) Menstrual period length (RCS-adjusted logistic regression).
Note: This figure displays restricted cubic spline (RCS) curves from logistic regression models examining the dose–response relationships between menstrual cycle length and menstrual period duration with spontaneous abortion (SA) risk. The red dashed horizontal line represents an OR of 1.0, indicating no difference in risk relative to the reference. Solid red lines indicate the estimated ORs, and shaded ribbons denote the corresponding 95% CIs. Logistic regression models were adjusted for all covariates listed in
Supplementary Table S2 . Bolded values indicate statistical significance (P<0.05). The χ2 and P for nonlinearity are reported in each panel to evaluate the significance of the non-linear association.Abbreviation: RCS=Restricted Cubic Spline; SA=Spontaneous Abortion; χ2=Chi-square statistic; OR=odds ratio; CI=confidence interval.
Menstrual Characteristic Pattern Total
participantsSA cases
n (%)OR (95% CI) Model 1 Model 2 Model 3 Model 4 Binary joint classification Both normal 3,657,947 60,231 (1.62) 1.00 (Reference) 1.00 (Reference) 1.00 (Reference) 1.00 (Reference) Irregular cycle only 67,043 1,444 (2.11) 1.31 (1.25, 1.39) 1.20 (1.13, 1.27) 1.10 (1.01, 1.17) 1.11 (1.03, 1.20) Irregular period only 56,991 1,498 (2.56) 1.61 (1.53, 1.70) 1.42 (1.34, 1.50) 1.24 (1.16, 1.34) 1.27 (1.18, 1.37) Both abnormal 4,726 140 (2.88) 1.82 (1.54, 2.16) 1.45 (1.20, 1.76) 1.14 (0.90, 1.44) 1.18 (0.93, 1.49) Detailed joint classification Both normal 3,657,947 60,231 (1.62) 1.00 (Reference) 1.00 (Reference) 1.00 (Reference) 1.00 (Reference) Short cycle & short period 1,414 33 (2.28) 1.43 (1.01, 2.02) 1.01 (0.67, 1.51) 0.97 (0.65, 1.47) 0.68 (0.38, 1.20) Short cycle & regular period 21,392 420 (1.93) 1.20 (1.09, 1.32) 1.11 (1.00, 1.23) 1.07 (0.97, 1.20) 1.12 (0.97, 1.29) Short cycle & long period 804 30 (3.60) 2.23 (1.61, 3.33) 1.75 (1.15, 2.66) 1.52 (0.99, 2.32) 1.44 (0.90, 2.31) Regular cycle & short period 27,655 690 (2.43) 1.53 (1.42, 1.65) 1.34 (1.24, 1.46) 1.31 (1.20, 1.42) 1.22 (1.08, 1.38) Regular cycle & long period 29,336 808 (2.68) 1.69 (1.58, 1.82) 1.50 (1.39, 1.62) 1.39 (1.29, 1.50) 1.30 (1.19, 1.42) Long cycle & short period 472 15 (3.08) 1.96 (1.17, 3.28) 1.36 (0.75, 2.48) 1.37 (0.75, 2.51) 1.31 (0.61, 2.79) Long cycle & regular period 36,704 802 (2.14) 1.33 (1.24, 1.43) 1.20 (1.11, 1.29) 1.19 (1.10, 1.29) 1.07 (0.97, 1.17) Long cycle & long period 1,463 46 (3.05) 1.94 (1.45, 2.60) 1.98 (1.46, 2.69) 1.82 (1.33, 2.49) 1.64 (1.15, 2.34) Very long cycle & short period 146 2 (1.35) 0.83 (0.21, 3.35) 0.78 (0.19, 3.17) 0.75 (0.18, 3.04) 0.58 (0.08, 4.21) Very long cycle & regular period 8,947 222 (2.42) 1.52 (1.33, 1.74) 1.41 (1.22, 1.63) 1.40 (1.21, 1.62) 1.29 (1.08, 1.53) Very long cycle & long period 427 14 (3.17) 2.02 (1.19, 3.45) 1.08 (0.51, 2.28) 1.04 (0.50, 2.21) 0.59 (0.19, 1.86) Note: Exposure categories were defined based on combinations of menstrual cycle length and menstrual period duration. The reference group comprised women with both normal cycle length and normal period duration. Both normal: normal menstrual cycle length (24–38 days) and normal period duration (3–7 days). Irregular cycle only: irregular menstrual cycle (<24 or >38 days) with normal period duration. Irregular period only: normal menstrual cycle with irregular period duration (<3 or >7 days). Both abnormal: irregular menstrual cycle and irregular period duration. Four models were constructed: Model 1 (unadjusted), Model 2 (adjusted for high-risk factors), and Model 3 (fully adjusted) using conventional logistic regression; Model 4 (fully adjusted) using multilevel logistic regression as an extended analytical approach. All covariates are listed in Supplementary Table S2 . Results are presented as odds ratios (95% CI). Associations are considered statistically significant at P<0.05, corresponding to 95% CIs that exclude 1.
Abbreviation: CI=confidence interval; SA=spontaneous abortion.Table 3. Combined associations between menstrual characteristics and SA risk.
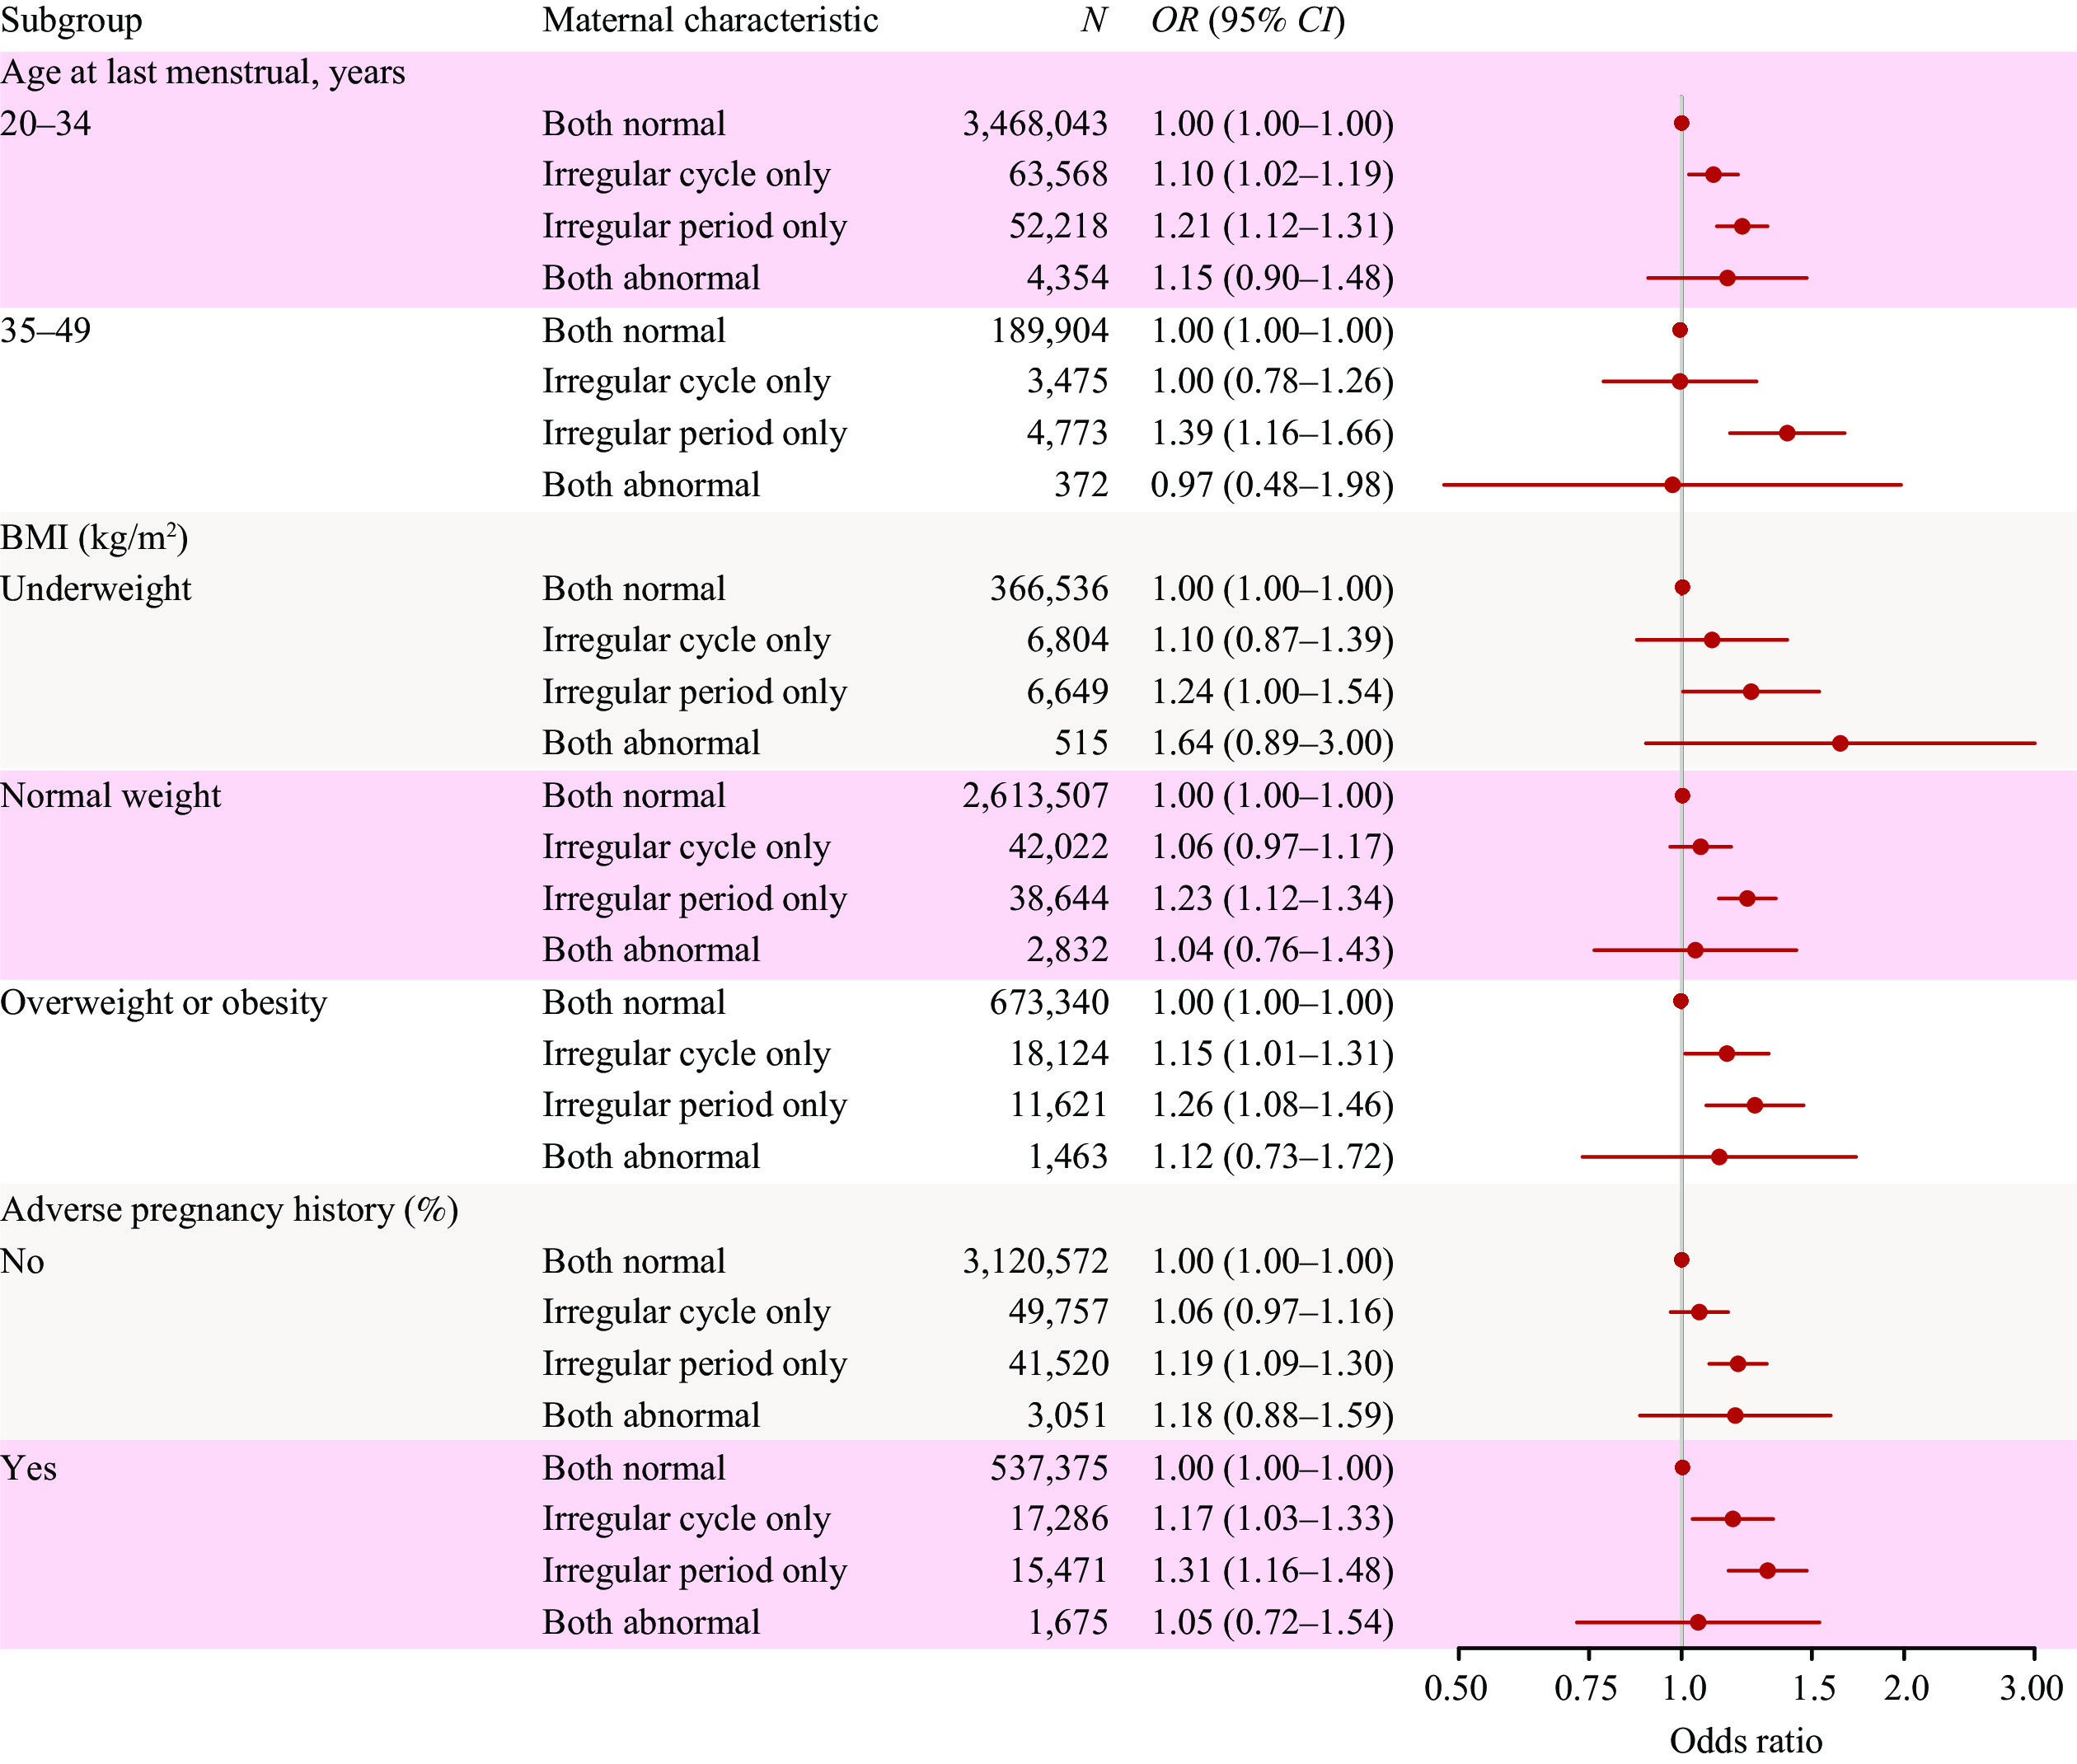 Figure 3.
Forest plot of the association between menstrual characteristics and spontaneous abortion (SA) risk, stratified by age, BMI, and adverse pregnancy history.
Note: This forest plot presents subgroup analysis results examining the association between combined menstrual characteristic categories and SA risk. ORs and 95% CIs were derived from fully adjusted multivariable logistic regression models. Exposure categories were defined based on combinations of menstrual cycle length and menstrual period duration, with women having both normal cycle length and normal period length serving as the reference group. Both Normal: normal menstrual cycle length (24–38 days) and normal period length (3–7 days). Irregular Cycle Only: irregular menstrual cycle (<24 or >38 days) with normal period length. Irregular Period Only: normal menstrual cycle with irregular period length (<3 or >7 days). Both Abnormal: irregular menstrual cycle and irregular period length. Analyses were stratified by three key maternal characteristics: age at last menstrual period (20–34 vs. 35–49 years); body mass index (BMI) category (underweight, normal weight, or overweight/obesity); and a history of adverse pregnancy (no vs. yes). Within each stratum, four mutually exclusive exposure categories were compared, with the "Both Normal" group serving as the common reference (OR=1.00). Each estimate is represented by a solid square (point estimate, OR) with a horizontal line denoting the 95% CI. The area of each square is proportional to the precision of the estimate. The vertical dashed line at OR=1.0 indicates no association; statistical significance is indicated when the 95% CI does not cross this line (i.e., excludes 1.0).
Abbreviation: OR=odds ratio; CI=confidence interval; SA=spontaneous abortion; BMI=body mass index (kg/m2).
-
In this cohort of 3 million reproductive-age women spanning more than a decade, we demonstrated that deviations in menstrual characteristics — both cycle length and bleeding duration — are independently and dose-dependently associated with SA risk, following a J-shaped relationship for cycle length and a U-shaped relationship for period duration. The combination of long cycles and prolonged periods conferred the highest risk, a pattern that remained consistent across all subgroups examined.
These findings extend prior evidence linking menstrual irregularities to adverse pregnancy outcomes. We confirmed that longer menstrual cycles are associated with increased SA risk, consistent with existing literature connecting cycle irregularity to miscarriage and ovulatory dysfunction (13–14). We further identified prolonged menstrual periods (>7 days) as a significant independent risk factor for SA. Both patterns are consistent with underlying oligo-anovulation or luteal-phase deficiency — conditions relevant to PCOS, in which hyperandrogenism and progesterone insufficiency may compromise endometrial receptivity and impair early pregnancy maintenance (15–16). Direct mechanistic verification was beyond the scope of the present study. Nevertheless, our findings provide a scientific basis for public health policies targeting SA prevention, particularly in resource-limited settings. Menstrual characteristics represent a simple, low-cost, and readily accessible tool for stratifying SA risk across the perinatal continuum — from preconception counseling through early pregnancy. Early identification of women with menstrual abnormalities facilitates timely intervention for underlying conditions such as PCOS or obesity-related anovulation, before pregnancy complications emerge. Evidence supports that lifestyle modification and low-cost pharmacological interventions can restore ovulatory cycles, improve metabolic health, and enhance reproductive outcomes (5,11). Although menstrual data are routinely recorded in clinical practice, they remain substantially underutilized in pregnancy risk assessment. Greater clinical attention should therefore be directed toward women with abnormal cycles or periods — not only during preconception counseling, but also after conception has occurred — as both groups stand to benefit from targeted monitoring and timely intervention. Embedding this risk-aware approach throughout the perinatal continuum has the potential to meaningfully improve pregnancy outcomes.
This study has several notable strengths. First, the large-scale design, drawing on long-term data from nine Chinese regions, provided sufficient statistical power to detect moderate yet clinically meaningful associations between menstrual characteristics and SA risk — associations that prior smaller studies were underpowered to establish. Second, the application of multiple analytical approaches to evaluate distinct menstrual dimensions, combined with detailed exposure categorization, enhanced both the robustness and granularity of our findings. Importantly, all menstrual characteristics were ascertained prior to pregnancy, which minimizes recall bias and establishes a clear temporal sequence between exposure and outcome. Finally, the availability of comprehensive individual-level covariate data enabled well-powered and informative subgroup analyses across key demographic and clinical strata.
This study has several limitations that warrant consideration. First, menstrual characteristics were self-reported at the preconception health visit, which may introduce misclassification arising from recall or reporting inaccuracies. Second, the absence of biochemical or hormonal biomarkers precluded direct verification of ovulatory status or quantification of endocrine dysfunction. Third, residual confounding cannot be excluded, as certain variables remained unmeasured or unidentified — including genetic factors (such as embryonic or parental chromosomal abnormalities) and environmental exposures at the population level (e.g., air pollution, climate, temperature, humidity, and atmospheric pressure). Fourth, although participants were drawn from nine provinces, the majority were rural residents; consequently, our findings may not be fully generalizable to all reproductive-age women in China, particularly those of higher socioeconomic status or those who do not seek preconception care.
-
All healthcare professionals and participants across administrative divisions for their invaluable contributions to the National Free Preconception Care Project.
-
Approved by the Institutional Review Board of the National Research Institute for Family Planning (IRB-201001). Written informed consent was obtained from all National Free Preconception Care Project (NFPCP) participants. The study was conducted in accordance with the principles of the World Medical Association Declaration of Helsinki (2000), and its reporting adheres to the Strengthening the Reporting of Observational Studies in Epidemiology (STROBE) guidelines.
HTML
| Citation: |

|