
 Download:


-
Introduction: Classroom environments — the primary visual setting for students — may significantly influence ocular health. This study examined key modifiable factors of poor vision related to primary and junior high school classroom environments in Guangdong, China.
Methods: We analyzed population-based data (of 180,584 students and 3,905 classrooms) from the Surveillance Program for Common Student Diseases and Health Risk Factors implemented in Guangdong in 2024. Multivariable logistic regression was employed to examine associations between poor vision and classroom conditions. XGBoost modeling and Shapley Additive Explanations (SHAP) were applied to rank the relative importance of environmental predictors.
Results: The prevalence of poor vision was 60.22%. An unqualified desk-chair allocation compliance rate, blackboard reflectance, and desktop illuminance uniformity were independently associated with higher odds of poor vision, with adjusted odds ratios (95% confidence interval) of 1.05 (1.01, 1.08), 1.09 (1.06, 1.11), and 1.05 (1.02, 1.08), respectively. The SHAP analysis identified blackboard reflectance as the most influential factor, followed by blackboard average illuminance, desk-chair allocation compliance rate, and desktop illuminance uniformity.
Conclusions: Blackboard reflectance, desk-chair allocation compliance rate, and desktop illuminance uniformity were critical modifiable factors. A multisectoral collaboration mechanism aligned with national myopia prevention policies is recommended to ensure compliance with visual environmental standards in educational settings.
-
The increasing prevalence and earlier onset of poor vision among school-aged children constitute a growing public health concern with profound implications for adolescent development. Beyond immediate visual dysfunction, these impairments contribute to progressive myopia and retinal complications, affecting long-term quality of life and creating socioeconomic burdens. As classrooms serve as the primary setting for sustained near-vision tasks, the physical characteristics of the classroom environment are critically associated with ocular health (1). In resource-limited districts, where comprehensive upgrades may not be immediately feasible, prioritizing the most impactful interventions is essential. However, empirical evidence to guide such prioritization remains scarce.
This study examined the association between classroom environmental factors and poor vision among primary and junior high school students in Guangdong Province, China. It evaluated the relative importance of these modifiable determinants to inform targeted, evidence-based interventions aimed at improving visual health within educational settings.
Data from the 2024 “Surveillance Program for Common Student Diseases and Health Risk Factors” in Guangdong Province, China were used, which employed multistage stratified random sampling across 21 prefecture-level cities. After processing, 180,584 students and 3,905 classrooms were retained for statistical modeling (
Supplementary Figure S1 ).Demographic data were collected using standardized questionnaires. Uncorrected visual acuity (UCVA) was assessed by professionals from district/county CDC following standardized protocols, with poor vision defined as UCVA<5.0 in at least one eye. Classroom environmental parameters were evaluated by trained personnel using calibrated instruments, adhering to the Functional Sizes and Technical Requirements for School Desks and Chairs (GB/T 3976–2014) and Hygienic Standards for Daylighting and Illumination in Classrooms (GB 7793–2010).
Statistical analyses were performed using Stata (version 18.0; StataCorp LLC, College Station, Texas, USA) and Python (version 3.12.6; Python Software Foundation, Wilmington, Delaware, USA). Categorical variables were summarized as numbers and percentages, with chi-square tests comparing poor vision detection rates across groups. Multivariable logistic regression was used to examine the association between classroom environmental factors and poor vision, with statistical significance set at P<0.05. Extreme Gradient Boosting (XGBoost) evaluated the impact of each environmental factor. Hyperparameters of the XGBoost model were optimized via a grid search combined with 5-fold stratified cross-validation to ensure robust model performance. The Shapley Additive Explanations (SHAP) methodology quantified the contribution of each predictor to model performance.
Of the 180,584 students included in the analysis, 108,741 (60.22%) had poor vision. The mean age was 10.17 years (SD=2.61). Table 1 shows that students with poor vision were older, more likely to be female, enrolled in junior high school, more prevalent as grades increased, and resided in urban areas. After adjusting for gender, educational stage, and region, lower desk-chair allocation compliance rate, unqualified blackboard reflectance, and inappropriate desktop illuminance uniformity were associated with higher odds of poor vision in students, with adjusted odds ratios (OR) [95% confidence interval (CI)] of 1.05 (1.01, 1.08), 1.09 (1.06, 1.11), and 1.05 (1.02, 1.08), respectively (Table 2).
Variables Overall Poor vision P Yes No Number of participants 180,584 (100.00) 108,741 (60.22) 71,843 (39.78) Age, mean (SD) 10.17 (2.61) 10.65 (2.61) 9.45 (2.44) <0.001 Gender <0.001 Boy 95,652 (52.97) 53,707 (56.15) 41,945 (43.85) Girl 84,932 (47.03) 55,034 (64.80) 29,898 (35.20) Education stage <0.001 Primary school 123,548 (68.42) 66,273 (53.64) 57,275 (46.36) Junior high school 57,036 (31.58) 42,468 (74.46) 14,568 (25.54) Grade <0.001 Grade 1 19,940 (11.04) 10,220 (51.25) 9,720 (48.75) Grade 2 20,820 (11.53) 9,004 (43.25) 11,816 (56.75) Grade 3 20,591 (11.40) 9,463 (45.96) 11,128 (54.04) Grade 4 20,458 (11.33) 10,997 (53.75) 9,461 (46.25) Grade 5 20,765 (11.50) 12,569 (60.63) 8,196 (39.47) Grade 6 20,974 (11.61) 14,020 (66.84) 6,954 (33.16) Grade 7 19,889 (11.01) 14,069 (70.74) 5,820 (29.26) Grade 8 18,448 (10.22) 13,825 (74.94) 4,623 (25.06) Grade 9 18,699 (10.35) 14,574 (77.94) 4,125 (22.06) Area <0.001 Urban 58,264 (32.26) 35,568 (61.05) 22,696 (38.95) Rural 122,320 (67.74) 73,173 (59.82) 49,147 (40.18) Note: Age is presented as mean (standard deviation, SD).
Abbreviation: N=number; SD=standard deviation.Table 1. Basic information and the prevalence of poor vision among primary and junior high school students in Guangdong Province, China, 2024 [N (%)].
Variables Number of participants (N, %) Crude model Adjusted model OR (95% CI) P OR (95% CI) P Desk-chair allocation compliance rate 0.001 0.005 Qualified 21,093 (11.68) 1.00 1.00 Unqualified 159,491 (88.32) 1.05 (1.02, 1.08) 1.05 (1.01, 1.08) Blackboard reflectance <0.001 <0.001 Qualified 64,003 (35.44) 1.00 1.00 Unqualified 116,581 (64.56) 1.04 (1.02, 1.06) 1.09 (1.06, 1.11) Blackboard average illuminance 0.961 0.433 Qualified 136,694 (75.70) 1.00 1.00 Unqualified 43,890 (24.30) 1.00 (0.98, 1.03) 0.99 (0.96, 1.02) Blackboard illuminance uniformity 0.270 0.283 Qualified 147,833 (81.86) 1.00 1.00 Unqualified 32,751 (18.14) 0.99 (0.96, 1.01) 1.01 (0.99, 1.04) Desktop average illuminance 0.185 0.731 Qualified 163,996 (90.81) 1.00 1.00 Unqualified 16,588 (9.19) 1.03 (0.99, 1.06) 0.99 (0.96, 1.03) Desktop illuminance uniformity <0.001 0.002 Qualified 155,603 (86.17) 1.00 1.00 Unqualified 24,981 (13.83) 1.06 (1.03, 1.09) 1.05 (1.02, 1.08) Note: The model was adjusted for gender, education stage, and urban/rural area.
Abbreviation: N=number; OR=odds ratio; CI=confidence interval.Table 2. Associations between classroom environmental indicators and students’ visual impairment.
In the SHAP analysis derived from the XGBoost model, adjusted for gender, educational stage, and region, blackboard reflectance accounted for the largest contribution to the prediction of poor vision, followed by blackboard illuminance, desk-chair allocation compliance rate, desktop illuminance uniformity, average desktop illuminance, and blackboard illuminance uniformity (Figure 1). Compared to logistic regression, SHAP has methodological advantages in not requiring strict statistical assumptions and better capturing nonlinear relationships and variable interactions.
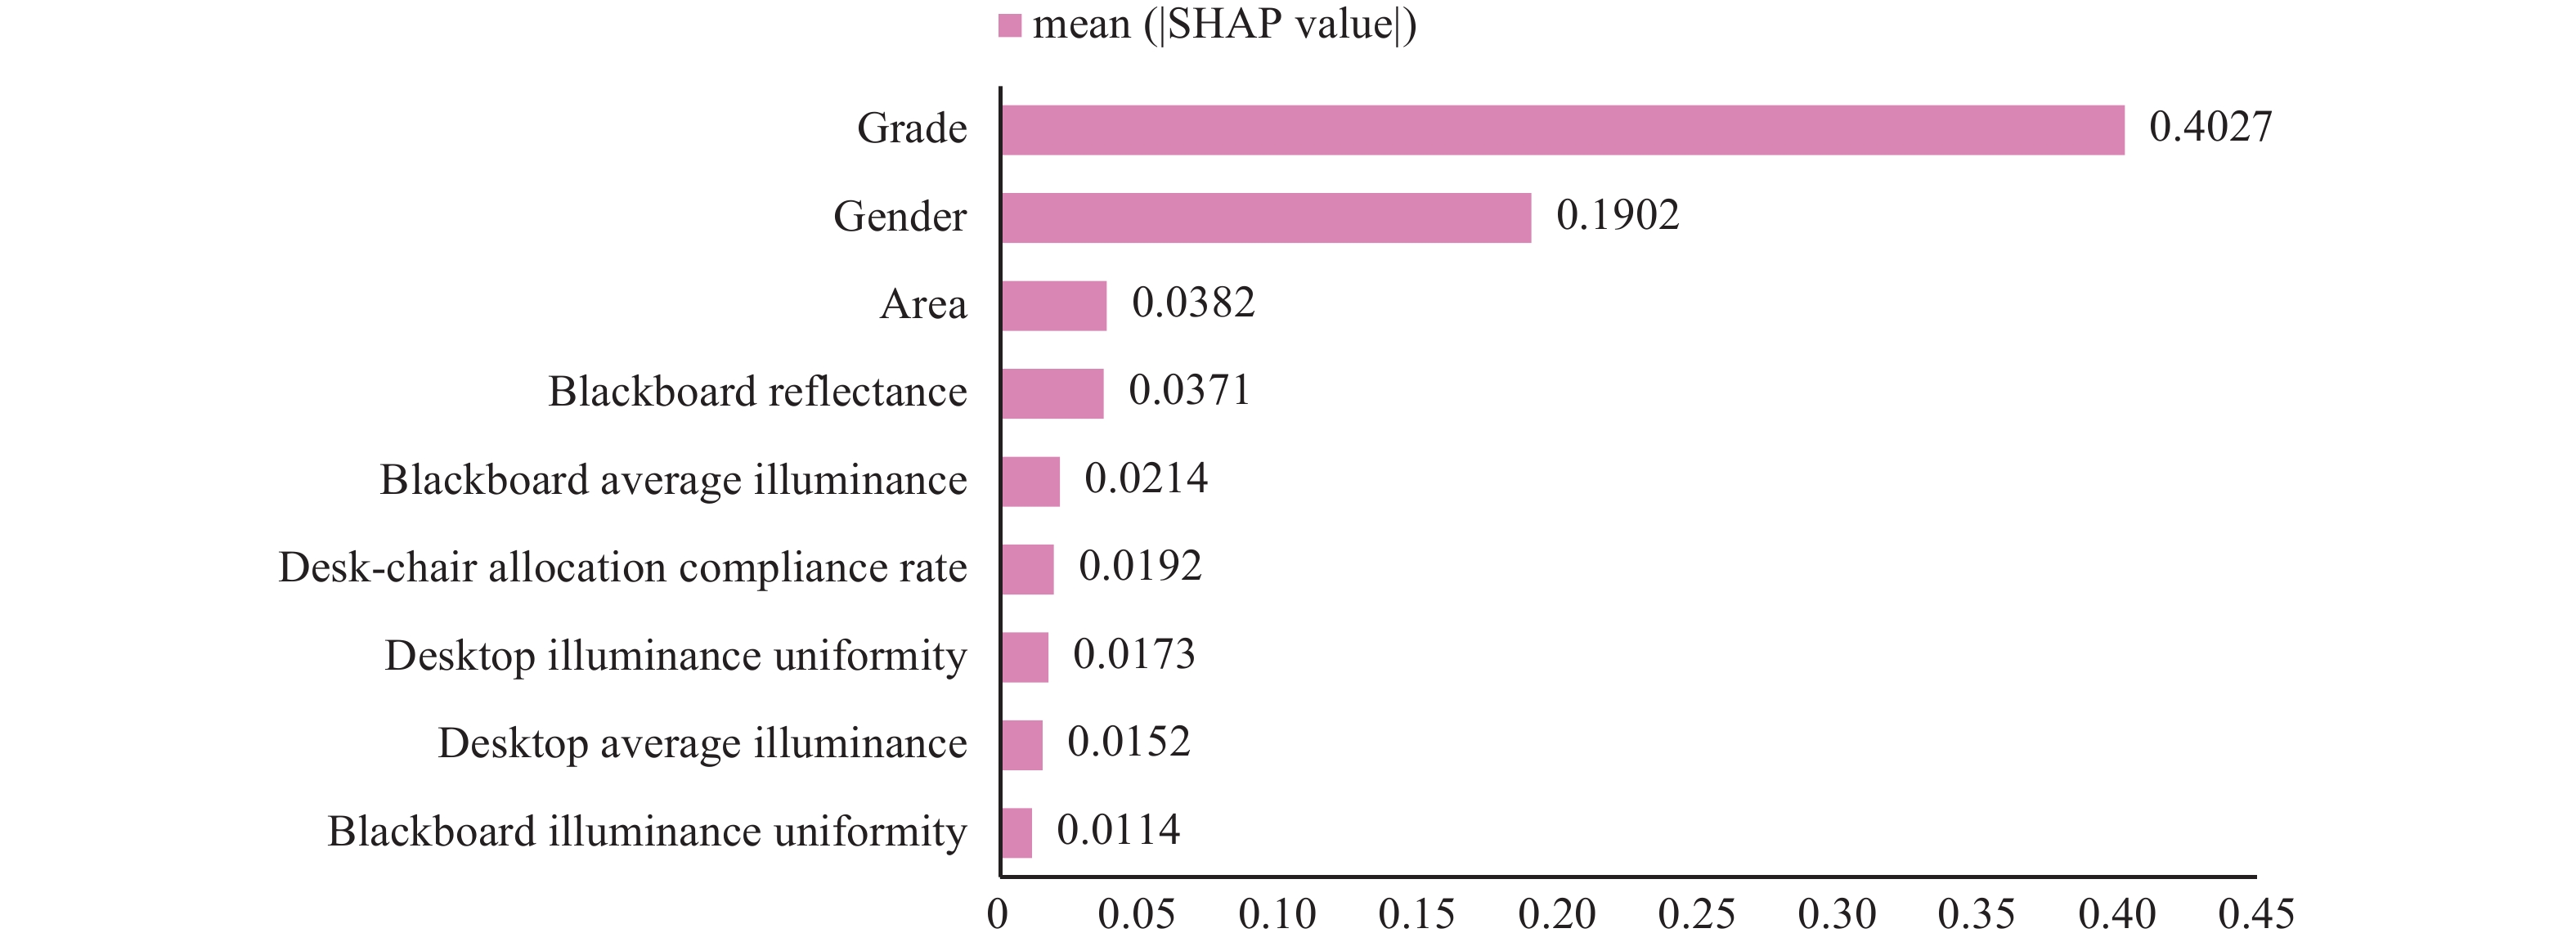 Figure 1.
SHAP summary plot of variable contributions to the XGBoost model.
Abbreviation: SHAP=Shapley additive explanations; XGBoost=extreme gradient boosting.Sensitivity analyses showed significant effect modification by educational stage, sex, and area. For educational stage, unqualified desk-chair allocation compliance had a stronger association with poor vision in primary school students (P for interaction=0.021); unqualified desktop illuminance uniformity was more pronounced in junior high school students (P for interaction=0.004). Blackboard illuminance uniformity affected females more strongly than males (P for interaction=0.030). Multiple classroom environmental factors displayed marked area interactions: unqualified blackboard illuminance uniformity was associated with increased poor vision risk only in rural areas (P for interaction=0.004); unqualified desktop average illuminance were correlated with higher poor vision risk only in urban areas (P for interaction <0.001). Furthermore, unqualified desktop illuminance uniformity was linked to elevated poor vision risk in urban areas (P for interaction=0.008). Non-optimal blackboard reflectance remained significantly associated with higher odds of poor vision in all subgroups (all P<0.05) (
Supplementary Tables S1–S3 ). -
This large, representative study of more than 180,000 students in Guangdong Province, China, provides compelling evidence that specific classroom environmental conditions are correlated with poor vision in school-aged children. These findings highlight the significance of modifiable school-based exposure in childhood visual impairment. In constrained resource contexts, prioritizing interventions targeting blackboard reflectance and classroom lighting standards may offer substantial ocular health benefits.
Crucially, this study used a SHAP plot to generate interpretable rankings of the relative contributions of classroom environmental factors to students’ poor vision. In our study, optimal blackboard reflectance was the factor most strongly associated with a lower risk of poor vision, with consistent cross subgroup effects. Elevated blackboard reflectance can cause glare and, thus, visual discomfort and impaired performance owing to uneven luminance and extreme contrast (2). Glare has two mechanisms: discomfort glare induces frequent pupillary adjustments and visual fatigue (3), and disability glare disrupts retinal image quality and diminishes text-background contrast (4). Our findings prompt the regulation and optimization of classroom blackboard reflectance, specifically addressing excessive reflectance.
Moreover, students with unqualified desk-chair allocation compliance rates had a significantly higher risk of poor vision, particularly those in primary schools. Reportedly, the prolonged use of ill-fitting desks and chairs among primary school students could lead to abnormal reading and writing postures, hinder adherence to behavioral guidelines, and increase myopia risk (5). Primary and junior high school periods involve rapid height growth; thus, insufficient desk-chair adjustments may cause dynamic mismatches. We recommend accelerating the standardized implementation of adjustable desks and chairs to meet the physical growth needs of students.
Furthermore, students with unqualified desktop illuminance uniformity, particularly among junior high school students and those living in urban areas, had a significantly higher risk of poor vision. Notably, substandard desktop illuminance uniformity can increase the risk of screen-detected myopia (6). Junior high school students face heavier academic workloads and prolonged near-vision activities in fixed seating positions, which explains their increased susceptibility to this factor. This urban-specific association may be related to heavier academic workloads and longer classroom-based learning durations in urban schools.
Although the blackboard average illuminance did not reach statistical significance in the multivariable analysis, it ranked second in SHAP importance ordering. Unlike multivariable logistic regression, machine learning methods do not require strict statistical assumptions and can capture nonlinear relationships and interactions (7). This advantage aligns with the complexity of real-world classroom environments, where multiple environmental factors interact dynamically rather than acting independently. Thus, with limited resources and the need to pinpoint impactful factors for targeted improvement, SHAP-derived results should be prioritized to guide practical intervention strategies. This discrepancy indicates that blackboard lighting, despite its limited independent impact, likely affects visual health through its interactions with other classroom environmental factors. Reportedly, substandard average blackboard illuminance increases the risk of screen-detected myopia (8).
Marked urban-rural disparities were observed in blackboard illuminance uniformity and desktop average illuminance, with substandard levels correlating with elevated poor vision risk in rural and urban areas, respectively. These differences likely stem from regional resource allocation gaps. Rural schools have historically faced funding shortages, inadequate professional expertise, and insufficient lighting maintenance supervision, directly inducing more severe blackboard illuminance inconsistency and greater adverse visual impacts than their urban counterparts (9). Conversely, urban classrooms may have higher baseline lighting levels but stricter demands for stable desktop illuminance, owing to longer indoor study hours.
In resource-constrained rural areas, upgrading blackboard facilities is critical to safeguard students’ visual health. SHAP analyses identified blackboard reflectance as the most impactful classroom environmental factor with consistent cross-subgroup effects. However, despite its low overall SHAP-derived impact, blackboard illuminance uniformity’s context-specific link to rural students’ poor vision risk further supports the necessity of targeted blackboard improvements. In summary, given limited resources, replacing outdated blackboards or upgrading blackboard-specific lighting systems should be prioritized over other measures to improve classroom environments.
Notably, the modest adjusted odds ratios of classroom environmental factors for poor vision do not undermine the public health significance. First, exposure to suboptimal conditions is highly prevalent. For instance, 88.32% of students faced unqualified desk-chair allocation. Given China’s large school-aged population, such modest effect sizes can translate to numerous preventable poor vision cases, consistent with the population attributable fraction (PAF) core logic (10). Importantly, these factors are highly modifiable and amenable to low-cost interventions. As childhood myopia is a progressive public health concern, even minor population-level risk reduction can generate substantial long-term benefits.
This study has several limitations. First, its cross-sectional design precludes the establishment of a causal relationship between classroom environment and poor vision. Second, residual confounding factors — unmeasured visual health behaviors, genetic factors, and extracurricular activity duration — cannot be fully ruled out. Finally, as a preliminary screening survey, this study calls for future research to incorporate refractive examination data and comprehensive classroom environmental factors to conduct more rigorous and targeted analyses.
In summary, this population-based study provided robust evidence that specific classroom environmental factors are independently associated with poor vision among school-aged children. These findings support targeted environmental interventions, particularly blackboard reflectance regulation, as a priority in school-based myopia prevention strategies. Aligned with China’s Comprehensive Implementation Plan for Preventing and Controlling Myopia among Children and Adolescents, we recommend that educational authorities focus on these three indicators and establish multisectoral collaborations to ensure compliance with classroom visual environment standards.
-
Granted exemption by the Medical Research Ethics Review Committee of the Guangdong Provincial Center for Disease Control and Prevention due to the use of anonymous information from “Surveillance for common disease and health risk factors among students” in Guangdong Province.
HTML
| Citation: |

|