
 Download:


-
Introduction: Myopia prevalence is rising globally, with particularly high rates observed in East Asia. This study evaluated the prevalence and associated factors of myopia among primary and secondary school students in Zhejiang Province, China.
Methods: A total of 192,704 students from 521 primary and secondary schools in Zhejiang Province were enrolled through multistage stratified cluster sampling as participants in the School-Based Chinese Adolescents’ Health Survey (SCAHS) in 2023. All participants underwent comprehensive ophthalmic examinations. Demographic characteristics, parental myopia status, visual and lifestyle behaviors, and dietary habits were collected through structured questionnaires.
Results: The overall myopia prevalence among primary and secondary school students in Zhejiang Province was 68.87%, with a high myopia prevalence of 5.82%. Multilevel logistic regression analysis demonstrated that female sex, parental myopia, higher body mass index (BMI), an advanced school stage, homework duration ≥3 hours per day, and prolonged sedentary behavior were significantly associated with increased myopia risk. Conversely, residence in suburban counties, outdoor rest after class, outdoor exercise ≥3 hours per day, and vegetable intake ≥twice per day were associated with reduced myopia risk. Notably, consuming a meat and egg-based breakfast [odds ratio (OR)=0.96, 95% confidence interval (CI): 0.92, 0.99] emerged as a protective factor against myopia.
Conclusions: Myopia prevalence remains high among primary and secondary school students in Zhejiang Province, China. Future prevention efforts should prioritize early screening and targeted interventions for high-risk children and adolescents.
-
Myopia represents one of the most prevalent eye diseases globally, with its burden continuing to escalate (1). Projections indicate that by 2050, the global prevalence of myopia will reach 50% (approximately 5 billion individuals), with high myopia affecting 10% (approximately 1 billion individuals) (2). Asian children and adolescents experience the highest myopia rates, with an estimated 80% of school-aged children affected (1). In China, the 2022 overall myopia prevalence among children and adolescents was 51.9%, demonstrating a marked progression across educational stages: 36.7% in primary school, 71.4% in junior high school, and 81.2% in senior high school (3). Beyond refractive error alone, the rapid increase in myopia prevalence parallels rising rates of vision-threatening complications, including macular degeneration, glaucoma, and blindness (4), thereby imposing substantial economic burdens on healthcare systems and society. Despite extensive research on myopia prevalence, regional variations and modifiable risk factors remain incompletely characterized, particularly in high-burden provinces. This study therefore investigated the prevalence and associated factors of myopia among primary and secondary school students in Zhejiang Province, China, to inform targeted prevention and early intervention strategies.
This cross-sectional study utilized data from the 2023 School-based Chinese Adolescents’ Health Survey (SCAHS) conducted in Zhejiang Province. We employed a multistage stratified cluster random sampling method to obtain a representative sample of children and adolescents aged 6 to 21 years. The first stage involved stratification by urban districts and suburban counties within each city. From each urban district, we randomly selected two primary schools, two junior high schools, and three senior high schools, whereas from each suburban county, we randomly selected two primary schools, two junior high schools, and one senior high school. In the second stage, we randomly selected multiple classes from each grade within the chosen schools and enrolled all students from these selected classes. Sample size was calculated using the formula (
$ N=Z_{\alpha /2}^{2}\cdot P\cdot \left(1-P\right)/{\delta }^{2} $ ), with the expected myopia prevalence (P) set at 0.519 (3), α at 0.05, and the allowable error (δ) at 0.1P. Accounting for an expected non-response rate of 20%, the minimum required sample size was determined to be 428 participants. Ultimately, 193,823 children and adolescents from 521 schools across 11 cities participated in the survey, providing a representative assessment of myopia status among primary and secondary school students in Zhejiang Province.Trained ophthalmologists performed refractive examinations using an automatic refractometer (RM-800, TOPCON, Tokyo, Japan). The spherical equivalent (SE) was calculated as the spherical power plus half of the cylindrical power (SE=sphere+1/2 cylinder). Myopia was defined as SE≤−0.50 D, and high myopia as SE≤−6.00 D. Weight was measured with an electronic scale (accuracy: 0.1 kg) and height with a stadiometer (accuracy: 0.1 cm). Body mass index (BMI) was calculated as weight divided by the square of height (kg/m2). All participants were confirmed to be free of systemic diseases and ocular disorders through medical history review and clinical examination. Trained researchers administered a structured questionnaire to collect demographic, behavioral, and dietary data. Demographic variables included sex, age, nationality (Han/non-Han), school stage (primary school/junior high school/senior high school), and region (urban district/suburban county, based on 2023 administrative divisions of Zhejiang Province). Parental myopia status was categorized as none, one parent with myopia, or both parents with myopia. Behavioral variables encompassed daily homework load (<3 hours/≥3 hours), daily screen time duration (hours), performance of eye exercises (yes/no), break intervals for near work (<3 hours/≥3 hours, defined as the continuous duration of writing or reading before taking a break), after-class rest location (indoors/outdoors), daily outdoor activity duration (<3 hours/≥3 hours), daily sleep duration (hours), daily sedentary time (hours), and secondhand smoke exposure (yes/no). Dietary variables assessed intake frequency over the past 7 days for sugary drinks, fried foods, milk and soy drinks (never/<once per day/≥once per day), fruits and vegetables (never/<twice per day/≥twice per day), and breakfast composition including grains and tubers (yes/no), meat and eggs (yes/no), and dairy products (yes/no). After excluding 1,119 participants with unavailable refractive data, 192,704 participants were included in the final analysis, of whom 138,330 completed valid questionnaires.
Statistical analyses were performed using R statistical software (version 4.4.1, R Foundation for Statistical Computing, Vienna, Austria). Continuous variables were presented as mean ± standard deviation, while categorical variables were expressed as frequency (percentage). Independent samples t-tests, Welch t-tests, and chi-square tests were employed to compare differences between myopia and non-myopia groups (
Supplementary Tables S1 and S2 ). To account for the hierarchical data structure — with students nested within schools and schools nested within cities — we applied multilevel logistic regression models with random intercepts at both the school and city levels to identify factors associated with myopia. Multicollinearity was assessed and ruled out by examining variance inflation factors. Effect sizes were reported as odds ratios (OR) with 95% confidence intervals (CI). Statistical significance was defined as P<0.05.This study included 192,704 children and adolescents aged 6 to 21 years (mean age: 11.85±3.47 years), comprising 101,527 males and 91,177 females. The overall myopia prevalence was 68.87%, with high myopia affecting 5.82% of participants. Females demonstrated a significantly higher myopia rate (70.94%) compared to males (67.01%, P<0.001). Myopia prevalence increased markedly with age, rising from 24.23% at age 6 years to 93.20% at 18 years and older (P<0.001). Significant differences in myopia prevalence were observed across educational stages: 51.04% in primary school, 85.36% in junior high school, and 92.71% in senior high school (P<0.001). Notable variation was observed in myopia rates across cities in Zhejiang Province. Hangzhou exhibited the highest prevalence (72.42%), followed by Quzhou (72.18%), whereas Wenzhou (64.93%), Jinhua (65.60%), and Lishui (67.04%) demonstrated comparatively lower rates. Urban districts (70.43%) had significantly higher myopia rates than suburban counties (67.53%, P<0.001) (Figure 1 and Table 1).
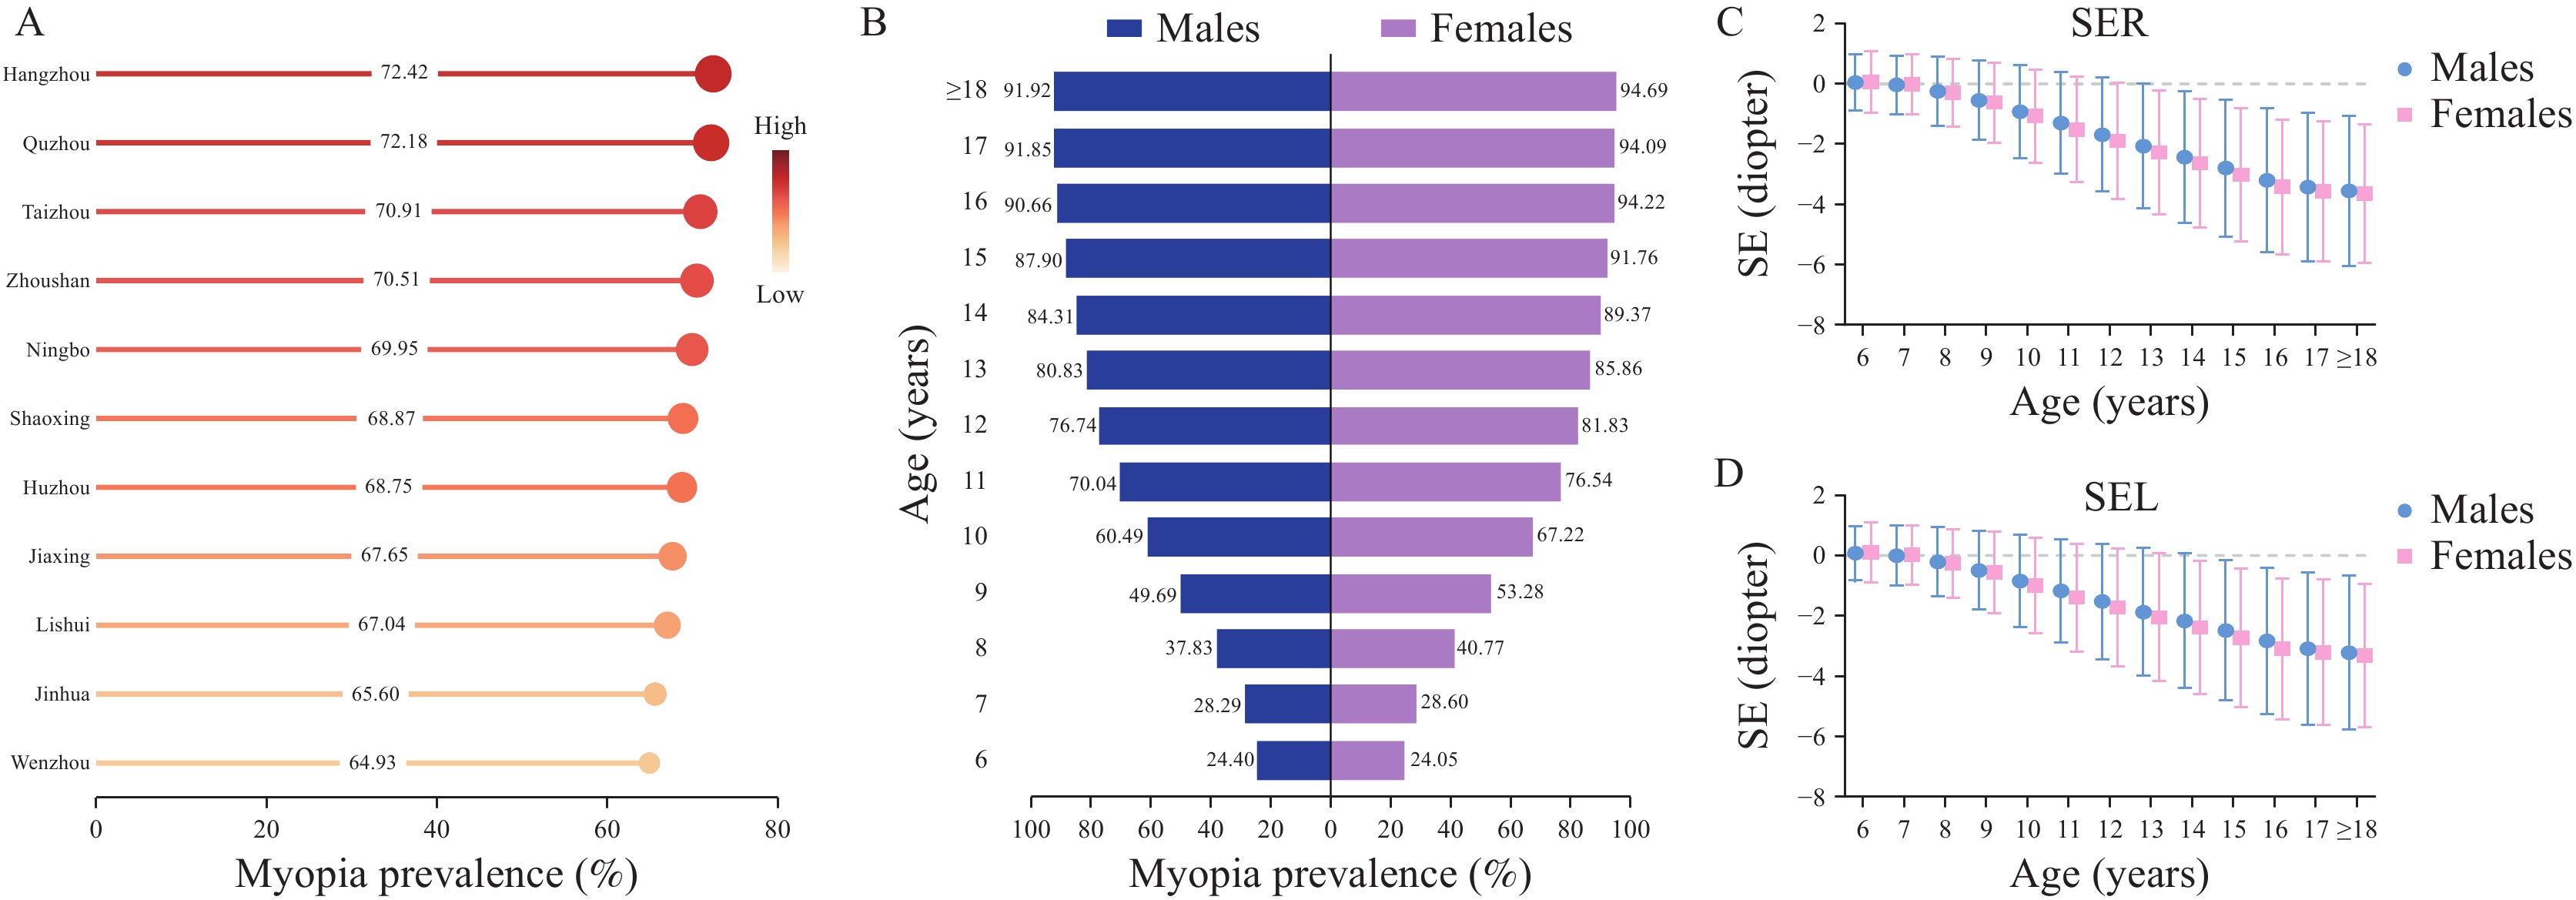 Figure 1.
Epidemiological characteristics of myopia among primary and secondary school students in Zhejiang Province, China, 2023. (A) Myopia prevalence across different cities; (B) Myopia prevalence stratified by sex and age groups; (C) Refractive distribution of the right eye by sex and age groups; (D) Refractive distribution of the left eye by sex and age groups.
Abbreviation: SER=spherical equivalent right; SEL=spherical equivalent left.Variables Count Myopia [n (%)] High myopia [n (%)] SER (D) SEL (D) Total 192,704 132,722 (68.87) 11,216 (5.82) −1.71±2.21 −1.54±2.18 Sex Male 101,527 68,038 (67.01) 5,725 (5.64) −1.64±2.20 −1.47±2.17 Female 91,177 64,684 (70.94) 5,491 (6.02) −1.79±2.21 −1.62±2.19 Age (years) 6 6,582 1,595 (24.23) 14 (0.21) 0.05±0.98 0.09±0.95 7 20,098 5,716 (28.44) 52 (0.26) −0.03±0.98 0.01±0.99 8 15,654 6,138 (39.21) 56 (0.36) −0.27±1.14 −0.23±1.14 9 17,643 9,060 (51.35) 76 (0.43) −0.58±1.32 −0.53±1.32 10 15,405 9,807 (63.66) 154 (1.00) −0.99±1.55 −0.92±1.56 11 16,760 12,254 (73.11) 300 (1.79) −1.40±1.71 −1.28±1.75 12 15,810 12,513 (79.15) 505 (3.19) −1.78±1.91 −1.62±1.94 13 16,223 13,490 (83.15) 890 (5.49) −2.16±2.06 −1.96±2.12 14 16,166 14,018 (86.71) 1,329 (8.22) −2.53±2.16 −2.27±2.22 15 14,916 13,385 (89.74) 1,580 (10.59) −2.90±2.24 −2.60±2.31 16 14,580 13,469 (92.38) 2,111 (14.48) −3.30±2.31 −2.96±2.39 17 13,851 12,874 (92.95) 2,403 (17.35) −3.49±2.39 −3.15±2.47 ≥18* 9,016 8,403 (93.20) 1,736 (19.25) −3.60±2.40 −3.26±2.47 School stage Primary school 101,578 51,842 (51.04) 889 (0.88) −0.68±1.50 −0.61±1.49 Junior high school 49,007 41,833 (85.36) 3,407 (6.95) −2.38±2.13 −2.15±2.19 Senior high school 42,119 39,047 (92.71) 6,920 (16.43) −3.42±2.36 −3.08±2.44 Region Urban districts 89,223 62,844 (70.43) 5,818 (6.52) −1.82±2.26 −1.64±2.24 Suburban counties 103,481 69,878 (67.53) 5,398 (5.22) −1.62±2.15 −1.46±2.13 Abbreviation: SER=spherical equivalent right; SEL=spherical equivalent left; D=diopter.
* The maximum age was 21 years.Table 1. Prevalence of myopia and refractive status among primary and secondary school students in Zhejiang Province, China, 2023.
Multiple multilevel logistic regression analyses demonstrated that myopia risk was significantly elevated in females compared to males (OR=1.37, 95% CI: 1.33, 1.41). Children with one myopic parent exhibited increased risk (OR=1.64, 95% CI: 1.58, 1.70), while those with both parents myopic showed substantially higher risk (OR=2.60, 95% CI: 2.47, 2.73) relative to children with non-myopic parents. Compared to primary school students, myopia risk was markedly higher among junior high school students (OR=2.87, 95% CI: 2.61, 3.15) and senior high school students (OR=7.03, 95% CI: 6.31, 7.83). Several modifiable factors were associated with increased myopia risk, including higher BMI (OR=1.05, 95% CI: 1.03, 1.06), homework duration ≥3 hours per day (OR=1.07, 95% CI: 1.01, 1.13), and prolonged sedentary time (OR=1.05, 95% CI: 1.03, 1.07). Conversely, several protective factors were identified. Students residing in suburban counties demonstrated lower myopia risk than those in urban districts (OR=0.80, 95% CI: 0.69, 0.93). Children who rested outdoors after class had reduced risk compared to those resting indoors (OR=0.94, 95% CI: 0.91, 0.97). Additional protective factors included outdoor activities ≥3 hours per day (OR=0.95, 95% CI: 0.92, 0.98), vegetable intake ≥twice per day (OR=0.92, 95% CI: 0.86, 0.99), and consuming a meat and egg-based breakfast (OR=0.96, 95% CI: 0.92, 0.99) (Table 2). The multilevel model revealed substantial clustering effects, with a random intercept variance of 0.171 (95% CI: 0.145, 0.201) at the school level and 0.010 (95% CI: 0.005, 0.027) at the city level, confirming significant variability across both hierarchical levels.
Variables Simple analysis Multiple analysis OR (95% CI) P OR (95% CI) P Sex Male Ref. Ref. Female 1.23 (1.20, 1.26) <0.001 1.37 (1.33, 1.41) <0.001 BMI (per 1 SD)* 1.26 (1.24, 1.27) <0.001 1.05 (1.03, 1.06) <0.001 Nationality Han Ref. Ref. Non-Han 0.89 (0.83, 0.95) <0.001 0.99 (0.90, 1.09) 0.779 School stage Primary school Ref. Ref. Junior high school 5.86 (5.36, 6.41) <0.001 2.87 (2.61, 3.15) <0.001 Senior high school 13.44 (12.19, 14.82) <0.001 7.03 (6.31, 7.83) <0.001 Region Urban districts Ref. Ref. Suburban counties 0.82 (0.68, 1.00) 0.053 0.80 (0.69, 0.93) 0.022 Parental myopia status None Ref. Ref. One parent 1.65 (1.59, 1.70) <0.001 1.64 (1.58, 1.70) <0.001 Both parents 2.60 (2.47, 2.73) <0.001 2.60 (2.47, 2.73) <0.001 Homework <3 hours Ref. Ref. ≥3 hours 1.10 (1.05, 1.16) <0.001 1.07 (1.01, 1.13) 0.013 Screen time (per 1 SD)* 1.22 (1.19, 1.24) <0.001 0.99 (0.97, 1.00) 0.163 Eye exercises No Ref. Ref. Yes 0.94 (0.85, 1.05) 0.285 0.98 (0.87, 1.11) 0.762 Near-work break interval <3 hours Ref. Ref. ≥3 hours 1.04 (0.98, 1.11) 0.218 1.05 (0.97, 1.13) 0.243 Resting place Indoors Ref. Ref. Outdoors 0.87 (0.85, 0.90) <0.001 0.94 (0.91, 0.97) <0.001 Outdoor activity <3 hours Ref. Ref. ≥3 hours 0.93 (0.90, 0.96) <0.001 0.95 (0.92, 0.98) 0.035 Sleep duration (per 1 SD)* 0.98 (0.96, 0.99) 0.026 1.02 (1.00, 1.04) 0.051 Sedentary time (per 1 SD)* 1.10 (1.08, 1.11) <0.001 1.05 (1.03, 1.07) <0.001 Sugary drinks Never Ref. Ref. <Once per day 1.08 (1.01, 1.17) 0.033 1.02 (0.93, 1.11) 0.711 ≥Once per day 1.09 (1.00, 1.18) 0.048 1.02 (0.93, 1.12) 0.707 Fried foods Never Ref. Ref. <Once per day 1.03 (1.00, 1.07) 0.087 1.00 (0.96, 1.05) 0.847 ≥Once per day 0.99 (0.92, 1.07) 0.872 1.00 (0.91, 1.09) 0.930 Fresh fruits Never Ref. Ref. <Twice per day 0.99 (0.96, 1.02) 0.579 0.99 (0.95, 1.03) 0.677 ≥Twice per day 0.96 (0.90, 1.02) 0.216 0.99 (0.91, 1.07) 0.725 Vegetables Never Ref. Ref. <Twice per day 0.99 (0.92, 1.04) 0.639 0.97 (0.90, 1.03) 0.361 ≥Twice per day 0.92 (0.86, 0.98) 0.011 0.92 (0.86, 0.99) 0.023 Grains and tubers No Ref. Ref. Yes 1.07 (1.04, 1.10) <0.001 1.02 (0.99, 1.05) 0.279 Meat and eggs No Ref. Ref. Yes 0.96 (0.93, 1.00) 0.013 0.96 (0.92, 0.99) 0.032 Dairy products No Ref. Ref. Yes 1.00 (0.97, 1.03) 0.962 0.98 (0.95, 1.01) 0.168 Abbreviation: OR=odds ratio; CI=confidence interval; BMI=body mass index; SD=standard deviation.
* Continuous variables were z-score standardized, and ORs are reported per one standard deviation increase.Table 2. Regression analysis of factors associated with myopia.
-
In 2023, the overall myopia prevalence among primary and secondary school students in Zhejiang Province reached 68.87%, with high myopia affecting 5.82% of students. This prevalence substantially exceeds that reported in Hubei Province (34.35% among children aged 3–18 years) (5) but aligns closely with findings from Shaanxi Province (67.4%, with high myopia at 4.6%) (6), demonstrating considerable regional variation across China. Internationally, Zhejiang’s myopia rates markedly surpass those observed in Western countries, where prevalence ranges from 3.3% to 19.9% in Ireland (7). These disparities likely reflect regional differences in genetic susceptibility, educational systems, academic pressure, lifestyle behaviors, and socioeconomic conditions.
Our findings are consistent with previous studies (5,8). Elevated myopia risk was associated with female sex, parental myopia, higher BMI, an advanced school stage, homework duration ≥3 hours, and prolonged sedentary behavior. Conversely, protective factors included residence in suburban counties, outdoor rest after class, ≥3 hours of outdoor activity per day, and vegetable intake ≥twice per day. Collectively, these findings underscore the critical influence of genetic, academic, and lifestyle factors on myopia development among children and adolescents. Accordingly, myopia prevention and control strategies should prioritize female students, implement early targeted interventions for children with myopic parents, reduce academic workload, and promote outdoor activities and physical exercise.
A particularly noteworthy finding was that consuming a meat and egg-based breakfast was associated with reduced myopia risk (OR=0.96, 95% CI: 0.92, 0.99). This protective effect may be explained by the high-quality protein content of meat and eggs. Supporting this interpretation, Yin et al. (8) reported that a protein-rich dietary pattern significantly reduced myopia risk in Chinese children (OR=0.78, 95% CI: 0.66, 0.92). Current evidence indicates that the scleral extracellular matrix (ECM) remodeling represents a key pathological mechanism underlying myopia onset and progression, with collagen — the major ECM component — playing a critical role in scleral remodeling (9). Consequently, increased protein intake may mitigate myopia development by promoting scleral collagen synthesis. Furthermore, monitoring data from 101,464 students in Liaoning Province revealed that students who only occasionally consumed breakfast exhibited a 4% higher myopia risk compared to those eating breakfast daily (OR=1.04, 95% CI: 1.01, 1.08) (10). These findings collectively suggest that regular consumption of protein-rich breakfasts, particularly those containing meat and eggs, may serve as a protective factor against myopia in children and adolescents.
Despite its considerable strengths, including a large sample size and broad geographic coverage, this study has several important limitations. First, we employed non-cycloplegic automated refraction rather than cycloplegic refraction, the clinical gold standard, which may have resulted in misclassification of some myopia cases. Second, data on influencing factors were collected via self-reported questionnaires, introducing potential recall and reporting biases. Third, the cross-sectional design only permits inference of associations but not causality. Finally, results may not be generalizable to other regions with different educational and dietary contexts.
In conclusion, our study revealed high myopia prevalence among primary and secondary school students in Zhejiang Province. To effectively prevent myopia, it is essential to strengthen early identification and targeted interventions for susceptible children and adolescents. Additionally, intersectoral collaboration among health, education, and family sectors should be mobilized to establish a comprehensive prevention system. Future longitudinal studies are needed to confirm causal relationships.
-
Adhered to the principles of the Declaration of Helsinki and received approval from the Ethics Committee of the Zhejiang Provincial Center for Disease Control and Prevention (Ethics approval number 2024-026-01). Written informed consent was obtained from parents or legal guardians of all participants following comprehensive explanation of the study objectives and methodology.
HTML

| Citation: |

|