
 Download:


-
Introduction: Alcohol use represents a major public health challenge globally. This survey provides nationally representative data on alcohol consumption patterns among China’s population aged 15 years and above.
Methods: In 2024, a population-based cross-sectional survey of individuals aged 15+ years was conducted using a multi-stage stratified cluster random sampling design. Trained interviewers utilized self-reported questionnaires to collect data on the prevalence of alcohol use in the past 30 days and past 12 months, as well as heavy episodic drinking (HED). Prevalence estimates with 95% confidence intervals (CIs) were calculated using weighted methods to account for the complex sampling design. Rao-Scott χ2 tests were applied to compare prevalence differences across demographic subgroups.
Results: In 2024, among Chinese individuals aged 15+ years, the prevalence of alcohol use was 20.3% in the past 30 days and 27.6% in the past 12 months. Males demonstrated significantly higher rates than females (past-month: 34.3% vs. 5.9%; past-year: 44.5% vs. 10.2%), with prevalence peaking in the 25–44 age group (past-month: 23.2%; past-year: 32.5%). Among current drinkers, the most common drinking frequency was <1 day/month (32.3%). Frequent drinking (≥5 days/week) was reported by 17.5% of current drinkers, with males (20.1%) exceeding females (5.7%). Additionally, 42.9% of current drinkers engaged in HED, with males (48.0%) substantially exceeding females (19.9%).
Conclusions: The prevalence of alcohol use in China was lower than the global average. However, the proportion of HED among current drinkers was comparatively high. Pronounced gender disparities were observed, with males substantially surpassing females across all indicators. Gender-specific interventions targeting males, particularly those aged 25–44 years, and strategies to reduce HED among current drinkers should be prioritized.
-
Alcohol use constitutes a major global public health risk factor, directly affecting multiple health-related indicators of the Sustainable Development Goals (1). The 2023 Global Burden of Disease study revealed that alcohol accounts for 2.03% of the global disease burden and approximately 1.3 million deaths annually (2–3). In China, drinking culture has a long-standing history and remains deeply embedded in social life, representing an integral component of Chinese tradition. However, widespread alcohol consumption has generated substantial health and social challenges, undermining progress toward the Healthy China 2030 goals (4). Systematic monitoring of alcohol use patterns is therefore essential to support evidence-based policymaking and targeted interventions. This study presents nationally representative data from a population-based cross-sectional survey of individuals aged 15+ years conducted in 2024.
This survey employed a multistage stratified cluster sampling design. Initially, one provincial-level administrative division (PLAD) was randomly selected from each of China’s seven major geographical regions. Subsequently, within each selected PLAD, probability proportional to size (PPS) sampling was applied to randomly select 10 districts/counties based on their population size. For each chosen district/county, an additional PPS sampling round was conducted to select 3 sub-districts/townships. Within each sub-district/township, two neighborhood committees/villages were further selected using PPS sampling based on household counts. Within each neighborhood committee/village, simple random sampling was used to recruit 120 households. Trained investigators then conducted household visits to enumerate all eligible family members aged 15+ years. One eligible member per household was subsequently selected as the respondent through an electronic randomization procedure. Inclusion criteria comprised Chinese residents aged 15+ years whose primary residence was their current household in the month preceding the survey, excluding those residing in collective living facilities such as student dormitories, military barracks, prisons, or hospitals. Fieldwork was conducted from July to November 2024.
This survey collected data on alcohol use. Alcoholic beverages were defined as drinks with an alcohol concentration exceeding 0.5% by volume. The indicator definitions were consistent with standards established by the World Health Organization (WHO) and the China Chronic Disease and Nutrition Surveillance (CCDNS). The specific definitions are as follows:
Alcohol use in the past 30 days: The percentage of the population aged 15+ years who consumed alcoholic beverages in the previous 30 days.
Alcohol use in the past 12 months: The percentage of the population aged 15+ years who consumed alcoholic beverages in the previous 12 months.
Heavy episodic drinking (HED): Defined as consuming at least 60 grams of pure alcohol on one occasion once or more in the past month.
To ensure national representativeness, a comprehensive weighting strategy was applied to account for the stratified sampling design. The weight calculation comprised three sequential steps: 1) Base weight, derived from all sampling stages; 2) Non-response adjustment weight, calculated from individual non-response rates during sampling; and 3) Post-stratification weight, adjusted to match the national population distribution (15+ years) by urban/rural residence, sex, and age groups. The final weight for each respondent was computed by multiplying these three components. All subsequent analyses incorporated these final weights. Standard population data were obtained from the Seventh National Population Census (2020). Prevalence estimates with 95% confidence intervals (CIs) were calculated using weighted methods appropriate for complex survey designs. Statistical significance was assessed using two-tailed tests with α=0.05 (P<0.05). All statistical analyses were conducted using SAS software version 9.4 (SAS Institute Inc., Cary, NC, USA).
Of the 50,400 eligible individuals, 46,376 completed valid questionnaires, yielding a response rate of 92.0%. The sample included 23,970 females and 22,406 males, with 24,990 participants from urban areas and 21,386 from rural areas. Complete demographic characteristics are presented in Table 1.
Characteristics Unweighted No. Weighted % (95% CI) Total 46,376 Sex Female 23,970 49.4 (48.5, 50.3) Male 22,406 50.6 (49.7, 51.5) Age, years 15–24 1,630 12.9 (11.3, 14.5) 25–44 10,298 36.5 (31.9, 41.0) 45–64 19,885 34.4 (31.4, 37.3) 65+ 14,563 16.3 (13.5, 19.1) Area Urban 24,990 45.8 (35.3, 56.3) Rural 21,386 54.2 (43.7, 64.7) Region North 6,872 14.6 (9.8, 19.5) Northeast 6,453 9.3 (6.4, 12.2) East 6,604 17.7 (10.3, 25.1) Central 6,694 18.8 (12.3, 25.3) South 6,582 25.0 (13.0, 37.0) Southwest 6,452 6.6 (3.7, 9.5) Northwest 6,719 8.0 (3.8, 12.2) Education level Primary school or below 15,613 22.0 (18.1, 26.0) Middle school 16,722 34.5 (31.1, 37.9) High school 6,894 18.8 (16.8, 20.8) College or above 7,048 24.7 (19.3, 30.0) Occupation Agriculture, forestry, animal husbandry, fishery, and water conservancy workers 16,567 23.4 (18.0, 28.7) Government/public institution staff 915 2.8 (2.2, 3.5) Business/service sector workers 7,577 23.8 (18.7, 29.0) Teachers 583 2.1 (1.6, 2.5) Healthcare workers 555 1.7 (1.4, 2.0) Unemployed 5,685 11.4 (9.6, 13.2) Others 14,146 34.8 (31.9, 37.8) Note: North China: Beijing, Tianjin, Hebei, Shanxi, Inner Mongolia; Northeast China: Liaoning, Jilin, Heilongjiang; East China: Shanghai, Jiangsu, Zhejiang, Anhui, Fujian, Jiangxi, Shandong; Central China: Henan, Hubei, Hunan; South China: Guangdong, Guangxi, Hainan; Southwest China: Sichuan, Chongqing, Guizhou, Yunnan; Northwest China: Shaanxi, Gansu, Ningxia, Qinghai, Xinjiang.
Abbreviation: CI=confidence interval.Table 1. Participant characteristics among individuals aged 15+ years — China, 2024.
In 2024, among Chinese individuals aged 15+ years, the prevalence of alcohol consumption was 20.3% in the past 30 days and 27.6% in the past 12 months. Males demonstrated significantly higher prevalence than females (34.3% vs. 5.9% for past-month use; 44.5% vs. 10.2% for past-year use). The prevalence of alcohol use increased with age, reaching its peak in the 25–44 age group (23.2% for past-month, 32.5% for past-year), before declining in older age groups. Regarding educational attainment, individuals with middle school education exhibited the highest past-month drinking prevalence (22.6%), whereas those with college education or above demonstrated the highest past-year prevalence (31.4%). Conversely, individuals with primary school education or below showed the lowest prevalence for both time periods (15.1% and 19.5%, respectively). Occupationally, institutional staff exhibited the highest drinking prevalence (34.7% for past-month, 47.6% for past-year), while unemployed individuals reported the lowest (13.2% and 18.1%, respectively). Regionally, North China demonstrated the highest past-month drinking prevalence, whereas the Northwest region showed the lowest. No statistically significant regional differences were observed in past-year drinking prevalence or HED proportion among current drinkers (Table 2 and Figure 1).
Characteristics Alcohol use in the past 30 days Alcohol use in the past 12 months HED Weighted % (95% CI) P Weighted % (95% CI) P Weighted % (95% CI) P Total 20.3 (18.4, 22.2) 27.6 (25.3, 29.8) 42.9 (39.0, 46.7) Sex <0.001 <0.001 <0.001 Male 34.3 (31.3, 37.4) 44.5 (41.2, 47.8) 48.0 (44.1, 52.0) Female 5.9 (5.0, 6.8) 10.2 (8.8, 11.6) 19.9 (15.3, 24.5) Age, years <0.001 <0.001 <0.001 15–24 14.3 (11.1, 17.4) 22.0 (17.8, 26.3) 30.2 (22.8, 37.7) 25–44 23.2 (20.4, 25.9) 32.5 (29.7, 35.3) 48.3 (44.2, 52.3) 45–64 21.2 (19.2, 23.1) 27.3 (25.1, 29.4) 45.1 (40.9, 49.4) 65+ 16.9 (14.9, 18.9) 21.7 (19.3, 24.0) 29.1 (24.3, 33.9) Residence 0.286 0.897 0.862 Urban 19.3 (17.3, 21.3) 27.4 (25.1, 29.8) 43.2 (38.9, 47.5) Rural 21.2 (18.2, 24.1) 27.7 (24.1, 31.4) 42.6 (36.5, 48.7) Region 0.047 0.086 0.111 North 25.9 (20.6, 31.2) 31.4 (25.4, 37.4) 47.7 (37.9, 57.5) Northeast 17.6 (13.9, 21.3) 22.1 (17.4, 26.9) 48.4 (37.8, 59.0) East 23.6 (20.5, 26.7) 31.5 (26.4, 36.5) 37.8 (31.6, 44.0) Central 17.4 (14.0, 20.8) 22.9 (18.8, 27.0) 41.1 (31.0, 51.3) South 18.3 (13.6, 23.1) 28.6 (23.0, 34.3) 44.4 (35.7, 53.1) Southwest 22.5 (15.3, 29.7) 28.7 (21.5, 35.9) 28.2 (24.6, 31.7) Northwest 17.1 (12.3, 21.9) 25.2 (18.5, 31.9) 52.5 (43.5, 61.5) Education level <0.001 <0.001 0.006 Primary school or below 15.1 (13.0, 17.2) 19.5 (17.1, 21.8) 35.1 (28.5, 41.8) Middle school 22.6 (20.0, 25.3) 29.3 (26.3, 32.2) 44.7 (40.3, 49.1) High school 21.8 (18.5, 25.1) 29.1 (25.7, 32.4) 44.0 (38.9, 49.1) College or above 20.6 (17.8, 23.5) 31.4 (27.8, 35.0) 44.3 (39.4, 49.1) Occupation <0.001 <0.001 0.009 Agriculture, forestry, animal husbandry, fishery, and water conservancy workers 17.4 (14.6, 20.1) 22.2 (19.0, 25.4) 42.3 (36.1, 48.5) Government/public institution staff 34.7 (28.7, 40.7) 47.6 (42.2, 53.0) 59.3 (49.7, 68.9) Business/service sector workers 27.3 (23.1, 31.5) 36.8 (32.7, 40.9) 45.2 (40.2, 50.1) Teachers 17.2 (10.3, 24.1) 28.6 (19.6, 37.5) 29.9 (18.3, 41.6) Healthcare workers 14.8 (9.4, 20.3) 24.6 (18.7, 30.4) 34.8 (22.9, 46.6) Unemployed 13.2 (11.0, 15.3) 18.1 (15.7, 20.5) 36.9 (29.2, 44.7) Others 19.3 (16.6, 22.1) 26.7 (23.9, 29.6) 41.0 (35.0, 47.1) Male 34.3 (31.3, 37.4) 44.5 (41.2, 47.8) 48.0 (44.1, 52.0) Age, years <0.001 <0.001 <0.001 15–24 20.2 (14.8, 25.5) 30.0 (23.5, 36.4) 36.8 (28.7, 44.9) 25–44 38.6 (33.7, 43.6) 51.3 (47.0, 55.6) 54.2 (49.7, 58.7) 45–64 37.4 (34.4, 40.4) 46.3 (43.1, 49.6) 49.2 (44.8, 53.6) 65+ 29.9 (27.0, 32.9) 37.0 (33.5, 40.4) 32.0 (27.2, 36.8) Residence 0.138 0.489 0.751 Urban 32.1 (28.8, 35.4) 43.3 (39.6, 47.0) 48.7 (43.8, 53.6) Rural 36.2 (31.8, 40.7) 45.5 (40.5, 50.5) 47.5 (41.6, 53.4) Region 0.006 0.043 0.137 North 46.0 (37.9, 54.1) 53.8 (44.7, 62.9) 53.5 (43.3, 63.7) Northeast 31.1 (24.8, 37.3) 37.2 (30.1, 44.3) 52.5 (41.9, 63.0) East 39.8 (35.3, 44.3) 50.3 (44.3, 56.2) 42.9 (35.5, 50.3) Central 30.1 (25.0, 35.2) 38.3 (31.9, 44.8) 47.2 (35.5, 58.9) South 29.4 (22.4, 36.5) 42.9 (35.2, 50.6) 49.8 (41.8, 57.7) Southwest 37.7 (26.8, 48.7) 46.4 (35.6, 57.2) 32.1 (28.0, 36.2) Northwest 28.1 (20.9, 35.4) 41.1 (30.9, 51.3) 54.9 (46.8, 63.1) Education level 1.858 0.033 0.090 Primary school or below 31.4 (27.8, 35.1) 38.6 (34.6, 42.6) 40.5 (33.9, 47.1) Middle school 35.9 (32.0, 39.8) 45.0 (40.8, 49.3) 48.8 (44.1, 53.6) High school 34.4 (29.5, 39.3) 43.6 (38.6, 48.6) 48.4 (42.8, 54.0) College or above 33.9 (28.8, 38.9) 48.3 (42.6, 54.0) 50.5 (44.0, 57.0) Occupation <0.001 <0.001 0.015 Agriculture, forestry, animal husbandry, fishery, and water conservancy workers 30.4 (26.1, 34.7) 37.9 (33.0, 42.8) 45.8 (39.3, 52.3) Government/public institution staff 51.0 (44.2, 57.9) 63.1 (57.7, 68.6) 67.0 (58.3, 75.8) Business/service sector workers 41.1 (35.5, 46.7) 53.7 (49.0, 58.3) 49.9 (44.6, 55.2) Teachers 47.8 (33.0, 62.7) 72.2 (59.8, 84.7) 34.6 (21.9, 47.3) Healthcare workers 37.0 (24.9, 49.0) 49.2 (37.7, 60.7) 47.0 (33.9, 60.1) Unemployed 26.4 (22.8, 29.9) 34.6 (29.9, 39.2) 44.6 (35.0, 54.3) Others 31.7 (27.2, 36.1) 41.5 (37.2, 45.8) 45.7 (39.5, 52.0) Female 5.9 (5.0, 6.8) 10.2 (8.8, 11.6) 19.9 (15.3, 24.5) Age, years 0.163 0.004 0.070 15–24 7.3 (3.7, 10.8) 12.6 (8.0, 17.3) 12.0 (4.3, 19.7) 25–44 6.7 (5.4, 8.0) 12.4 (10.5, 14.4) 22.1 (17.7, 26.6) 45–64 4.9 (4.0, 5.9) 8.2 (6.9, 9.5) 22.1 (15.0, 29.1) 65+ 5.3 (3.9, 6.6) 8.0 (6.3, 9.7) 17.1 (9.1, 25.1) Residence 0.724 0.255 0.549 Urban 6.1 (5.0, 7.2) 11.1 (9.5, 12.6) 21.3 (17.3, 25.3) Rural 5.8 (4.3, 7.2) 9.5 (7.2, 11.8) 18.6 (10.5, 26.7) Region 0.588 0.100 0.123 North 5.9 (2.5, 9.3) 9.2 (5.3, 13.0) 14.0 (9.2, 18.8) Northeast 4.3 (3.0, 5.6) 7.3 (5.0, 9.6) 27.9 (16.2, 39.5) East 7.2 (5.9, 8.5) 12.4 (8.2, 16.6) 17.0 (11.7, 22.3) Central 5.2 (3.1, 7.2) 7.9 (5.1, 10.6) 12.4 (3.5, 21.4) South 6.0 (3.7, 8.2) 12.7 (9.1, 16.3) 24.1 (14.4, 33.8) Southwest 7.1 (5.2, 8.9) 10.8 (8.6, 13.0) 10.9 (4.7, 17.1) Northwest 5.7 (2.5, 8.8) 8.7 (4.6, 12.9) 40.6 (25.1, 56.1) Education level 0.357 <0.001 0.772 Primary school or below 5.6 (4.2, 7.1) 8.4 (6.7, 10.1) 20.9 (10.1, 31.6) Middle school 6.2 (4.5, 7.8) 9.8 (7.8, 11.7) 21.1 (14.3, 28.0) High school 4.8 (3.3, 6.2) 9.4 (7.2, 11.7) 16.4 (11.4, 21.5) College or above 6.5 (5.3, 7.7) 13.4 (10.9, 15.8) 20.3 (14.3, 26.2) Occupation 0.016 0.003 0.696 Agriculture, forestry, animal husbandry, fishery, and water conservancy workers 4.4 (3.0, 5.7) 6.6 (4.9, 8.3) 22.2 (12.0, 32.3) Government/public institution staff 6.6 (2.4, 10.8) 20.8 (10.2, 31.5) 19.0 (0.8, 37.2) Business/service sector workers 8.9 (6.0, 11.8) 14.3 (10.5, 18.1) 21.3 (15.4, 27.2) Teachers 6.3 (1.3, 11.2) 13.0 (6.4, 19.6) 20.6 (3.3, 38.0) Healthcare workers 3.1 (1.1, 5.2) 11.6 (6.5, 16.6) 7.2 (0.0, 15.0) Unemployed 6.4 (4.4, 8.3) 9.6 (7.4, 11.9) 22.8 (14.5, 31.1) Others 5.1 (3.9, 6.3) 9.6 (7.8, 11.4) 17.7 (11.3, 24.1) Abbreviation: CI=confidence interval. Table 2. Prevalence of alcohol use in the past 30 days and past 12 months among the total population aged 15+ years, and heavy episodic drinking (HED) among current drinkers — China, 2024.
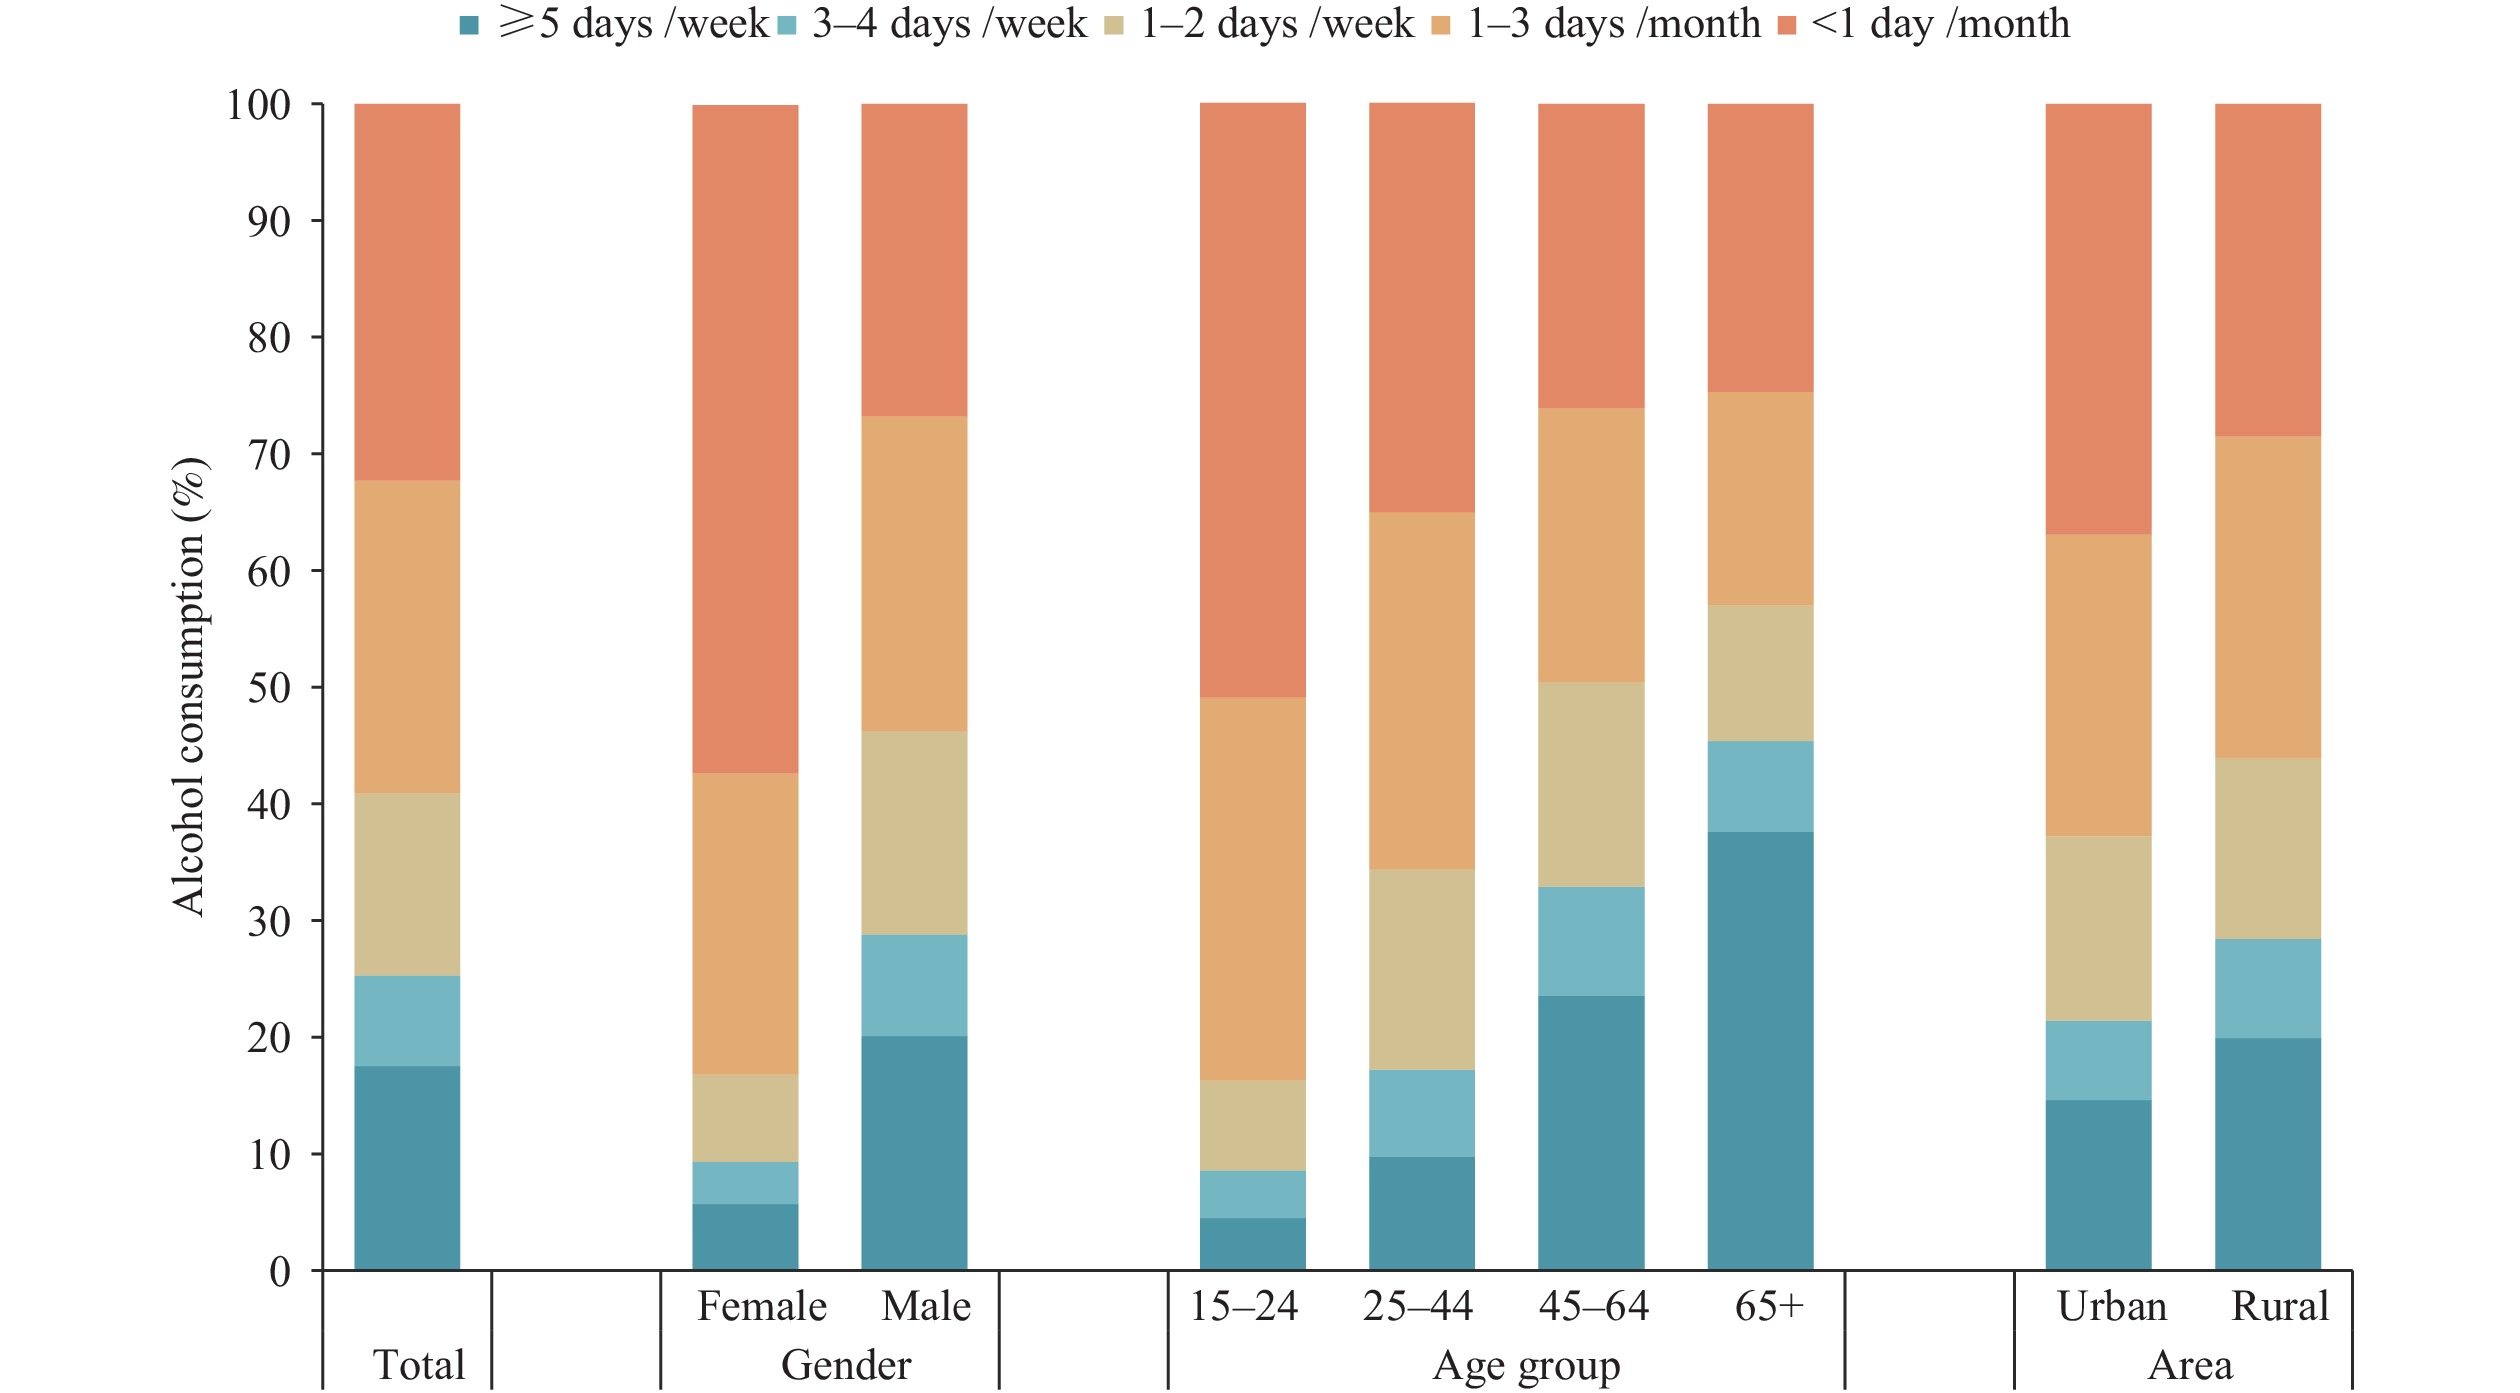 Figure 1.
Frequency of alcohol consumption among current drinkers during the past 12 months, stratified by gender, age group, and geographic area, China, 2024.
Figure 1 demonstrates that among current drinkers, the most common drinking frequency was <1 day/month (32.3%), followed by 1–3 days/month (26.8%). The proportion of individuals drinking ≥5 days/week was 17.5%, with males (20.1%) exceeding females (5.7%), and rural residents (19.9%) exceeding urban residents (14.6%). This proportion increased progressively with age, reaching its peak of 37.6% in the 65+ age group.
Among current drinkers, 42.9% engaged in HED, with males (48.0%) demonstrating significantly higher rates than females (19.9%); no urban-rural differences were observed. The prevalence of HED initially increased with age, reaching a peak of 48.3% in the 25–44 age group, before declining among older populations. Individuals with primary school education or below exhibited relatively low HED prevalence (35.1%), whereas those with middle school, high school, and college or above education demonstrated comparable rates (ranging from 44.0% to 44.7%). Occupationally, institutional staff displayed the highest HED prevalence (59.3%), while teachers exhibited the lowest (29.9%). Regionally, Northwest China demonstrated the highest HED prevalence (52.5%), whereas Southwest China showed the lowest (28.2%).
-
This study represents the first national survey on alcohol consumption in China to adopt international age criteria (15+ years), thereby establishing benchmark data and revealing several key findings with important public health implications.
First, the study demonstrated that the prevalence of alcohol use in China was relatively low compared to both the global average and previous estimates for China. In 2024, the past-year drinking prevalence among individuals aged 15+ in China (27.6%) was considerably lower than that observed in the European Region (62.4%), the United States (71.1%), Australia (80.5%), and the global average (43.8%) (5). This prevalence was also lower than the figure reported for China in the WHO 2024 alcohol report (reflecting 2019 data, 15+ years, 61.2%) (5) and the prevalence of alcohol consumption among Chinese adults aged 18+ (39.8%) documented in the 2018 CCDNS (6). Compared to tobacco control, measures to curb alcohol use remain relatively weak and are still in the early stages of implementation in China. A recent policy study revealed that none of the classic alcohol control strategies — including taxation increases, availability restrictions, restrictions on advertisement and marketing, drink-driving laws, screening, and brief interventions — can explain the decline in China’s alcohol consumption rate. Economic explanations similarly fail to account for this decline. Nevertheless, China’s extensive anti-corruption campaign, which prohibits government officials from consuming alcoholic beverages in their daily lives, has made a substantial contribution to these reductions, thereby contributing to the denormalization of alcohol consumption in broader society (7). Similarly, the lower prevalence observed in our study compared to previous estimates may also be attributed to this anti-corruption campaign.
Second, significant gender disparities in alcohol use were observed, with males drinking substantially more than females. These differences were widespread, encompassing past-month and past-year drinking prevalence, as well as HED proportion. This pattern aligns with global trends (5,8). This study revealed a male-to-female ratio of 4.4 for current drinking in China, similar to findings from the CCDNS (4.0 in 2010 and 3.2 in 2018) (6,9). Furthermore, the male HED proportion exceeded twice that of females. Additionally, the proportion of individuals drinking ≥5 days/week was notably higher among males, approximately 3.5 times that of females. These findings indicate that male alcohol use should be a specific focus of intervention efforts (10).
Third, although China’s past-year alcohol use prevalence fell below the global average, the proportion of current drinkers engaging in HED reached 42.9% — comparable to the United States (42.3%) and Australia (44.8%), and exceeding both Russia (30.8%) and the global average among drinkers (38%) (5). This finding indicates that HED prevalence among Chinese drinkers was notably elevated and may have increased from the 39.8% reported for adults aged 18+ in the 2018 CCDNS (6).
Fourth, substantial disparities in alcohol use emerged across age groups and occupational categories. Individuals aged 25–44 years demonstrated the highest overall alcohol consumption and the highest rates among males, whereas females peaked earlier (15–24 years) for both past-month and past-year drinking. Among occupational groups, institutional staff exhibited the highest drinking prevalence, identifying them as a priority population for targeted interventions. Notably, adults aged 65+ years reported the highest frequency of drinking ≥5 days/week, underscoring the critical need for focused interventions addressing frequent alcohol use among elderly populations.
Fifth, regional variations in alcohol use patterns were evident across multiple dimensions. North China, characterized by upper-middle income levels, demonstrated the highest past-month drinking prevalence, while Northwest China, with lower-middle per capita GDP, exhibited the lowest. Although no statistically significant differences emerged for past-year drinking (P=0.086) or HED proportion (P=0.111), past-year drinking prevalence in Eastern China (31.5%) exceeded that in Northeast China (22.1%) by approximately 10 percentage points. Similarly, the highest regional HED proportion (Northwest, 52.5%) surpassed the lowest (Southwest, 28.2%) by more than 20 percentage points. The geographic distribution of these indicators varied considerably across regions. No significant urban-rural differences in overall alcohol use were detected, except that frequent drinking (≥5 days/week) was more prevalent in rural areas. These findings suggest that regional variations in alcohol consumption patterns may reflect not only economic disparities but also deeply embedded local drinking cultures and social norms.
This study has several limitations. Reliance on self-reported data introduces potential recall and social desirability biases. However, the questionnaire was designed in accordance with WHO alcohol monitoring guidelines and CCDNS protocols, ensuring methodological rigor and data consistency. Furthermore, China’s longstanding drinking culture and widespread social acceptance of alcohol consumption likely minimized stigma-related reporting bias, enhancing the reliability of self-reported measures.
In conclusion, the overall prevalence of alcohol use in China was lower than the global average. However, the proportion of HED among current drinkers was relatively high. Significant gender disparities were observed, with males demonstrating substantially higher rates across all indicators compared to females. Regional variations in drinking patterns were also evident. Key populations requiring targeted intervention include individuals aged 25–44 years, institutional staff, and elderly individuals (65+ years) who engage in frequent drinking. Evidence-based policies and preventive measures should be developed and implemented in alignment with these findings.
-
Approved by the Institutional Review Board of the Chinese Center for Disease Control and Prevention (approval number 202410).
HTML
| Citation: |

|