
 Download:


-
Introduction: To address the lack of long-term national–provincial comparisons, we used Global Burden of Disease (GBD) 2023 data to assess the burden of non-communicable diseases (NCDs) attributable to high alcohol use across 31 provincial-level administrative divisions and the Hong Kong and Macao Special Administrative Regions of China at both national and provincial levels from 1990 to 2023.
Methods: We summarized deaths and disability-adjusted life years (DALYs) for GBD Level 1 cause NCDs and alcohol-linked Level 2 causes based on the GBD comparative risk assessment framework. Analyses were stratified by cause composition, age, sex, and region.
Results: In 2023, age-standardized death and DALY rates declined markedly compared with 1990, while absolute numbers rose slightly. Neoplasms contributed the largest share of DALYs, followed by substance use disorders; diabetes and kidney diseases contributed smaller shares but demonstrated substantial increases (160.22%, 2010–2023). DALY peaks occurred at ages 40 to 64 years for digestive diseases, neoplasms, and substance use disorders, and at ages 65 years and older for cardiovascular diseases and diabetes and kidney diseases; neurological disorders showed the most negative values at ages 65 years and older. The male age-standardized DALY rate was 10.64 times that of females, and marked spatial heterogeneity persisted, with distinct provincial clustering by disease category.
Conclusion: Despite declining age-standardized rates, the persistent absolute burden of NCDs attributable to high alcohol use and heterogeneous disease profiles support the need for cause-, age-, sex-, and region-specific prevention strategies. Public health efforts should prioritize substance use disorders, monitor the rising burden of diabetes and kidney diseases, and sustain interventions to reduce the substantial neoplasm burden.
-
The International Agency for Research on Cancer classifies alcohol as a Group 1 carcinogen, with the 2024 report attributing approximately 2.6 million deaths worldwide in 2019 (1-2). In China, substantial evidence demonstrates that alcohol consumption elevates the risk of numerous diseases and contributes significantly to the national non-communicable diseases (NCDs) burden (3). However, comprehensive long-term comparisons between national and provincial levels remain scarce.
This study analyzed Global Burden of Disease (GBD) 2023 mortality and disability-adjusted life years (DALYs) data to assess high alcohol use–attributable NCDs burden across 31 provincial-level administrative divisions (PLADs) and the Hong Kong and Macao Special Administrative Regions (SARs) of China from 1990 to 2023 (4). The GBD 2023 framework generates comparable estimates for China by synthesizing major national and subnational data sources, including the China Disease Surveillance Points system, China Cancer Registry, and national censuses (5–8). Mortality and morbidity estimates are derived using established GBD modeling approaches (5–6). Our analysis encompasses NCDs (defined as GBD Level 1 causes) and high alcohol use–attributable Level 2 causes identified through GBD risk-outcome pairs (5–6). Disease categories and their corresponding International Classification of Diseases, Tenth Revision (ICD-10) codes are based on the GBD mapping table (5–6).
Following the GBD comparative risk assessment framework, high alcohol use is defined as consumption exceeding the theoretical minimum risk exposure level (TMREL) (6). Population-attributable fractions are calculated by combining relative risks from meta-analyses with exposure distributions, then applied to cause-specific deaths and DALYs (6). Uncertainty intervals (UIs; 95%) are derived from the 2.5th and 97.5th percentiles of 250 draws. Age-standardized rates employ the GBD world population age standard (5–7), and all analyses were conducted using R software (version 4.5.1; The R Foundation for Statistical Computing, Vienna, Austria).
From 1990 to 2023, age-standardized NCDs death and DALY rates attributable to high alcohol use declined substantially (death rate: 22.03 to 9.35 per 100,000, −57.6%; DALY rate: 740.28 to 393.11 per 100,000, −46.9%). However, absolute numbers increased modestly during this period (deaths: 188,950 to 211,240, 11.8%; DALYs: 7.38 million to 7.89 million, 6.9%) (Table 1).
Cause level Diseases 1990 2023 Deaths DALYs Deaths DALYs Cases No. ×103 (95% UI) Age-Standardized Rate per 100,000 (95% UI) Cases No. ×103 (95% UI) Age-Standardized Rate per 100,000 (95% UI) Cases No. ×103 (95% UI) Age-Standardized Rate per 100,000 (95% UI) Cases No. ×103 (95% UI) Age-Standardized Rate per 100,000 (95% UI) Level 1 Cause Non-communicable diseases 188.95
(57.50,
367.12)22.03
(6.75,
43.26)7,382.40
(3,495.88,
12,502.55)740.28
(325.53,
1,291.85)211.24
(73.97,
408.22)9.35
(3.28,
18.12)7,893.92
(4,258.84,
12,987.57)393.11
(221.03,
627.16)Level 2 causes Cardiovascular diseases 57.75
(3.17,
135.49)8.15
(0.97,
18.60)1,218.05
(−225.91,
3,196.87)156.04
(−7.03,
378.83)62.31
(3.07,
150.11)2.71
(0.04,
6.55)1,271.80
(−163.76,
3,289.60)52.45
(−12.00,
141.55)Diabetes and kidney diseases −0.02
(−0.68,
0.88)0.01
(−0.06,
0.14)−59.23
(−96.79,
3.93)−4.81
(−8.17,
0.82)2.67
(−0.65,
7.61)0.11
(−0.03,
0.33)78.44
(−90.34,
430.59)2.05
(−4.62,
16.79)Digestive diseases 37.77
(15.30,
71.80)3.96
(1.62,
7.50)1,387.03
(545.99,
2,628.57)136.49
(54.22,
257.98)32.89
(12.85,
56.26)1.51
(0.59,
2.57)1,073.94
(419.77,
1,819.87)51.81
(20.22,
88.85)Neoplasms 84.14
(22.14,
168.52)9.22
(2.41,
18.54)2,614.34
(721.64,
5,140.03)272.28
(73.91,
538.97)103.38
(26.65,
208.49)4.45
(1.18,
8.88)2,875.73
(756.54,
5,666.95)126.88
(34.74,
246.05)Neurological disorders −1.41
(−9.72,
2.38)−0.32
(−1.66,
0.26)35.27
(−167.09,
167.71)−1.38
(−28.60,
15.21)−5.59
(−28.08,
2.55)−0.23
(−1.25,
0.13)−102.77
(−582.27,
138.10)−2.36
(−23.02,
8.34)Substance use disorders 10.71
(7.59,
15.44)1.01
(0.71,
1.43)2,186.94
(1,632.24,
2,881.82)181.65
(136.70,
238.57)15.59
(12.74,
19.22)0.79
(0.64,
0.97)2,696.77
(2,062.94,
3,649.25)162.28
(122.51,
221.88)Note: Within the GBD 2023 framework, non-communicable diseases constitute a Level 1 cause classification. This category encompasses cardiovascular diseases, diabetes and kidney diseases, digestive diseases, neoplasms, neurological disorders, and substance use disorders, all designated as Level 2 causes of non-communicable diseases. All estimates include 95% uncertainty intervals. Negative values indicate estimates falling below the TMREL counterfactual threshold in the GBD CRA framework.
Abbreviation: DALYs=disability-adjusted life years; UI=uncertainty interval; TMREL=theoretical minimum risk exposure level; CRA=comparative risk assessment; GBD=Global Burden of Disease.Table 1. Cases and age-standardized rates of high alcohol use-attributable deaths and DALYs by disease category in China, 1990 and 2023.
Over the long-term period (1990–2023), age-standardized DALY rates for cardiovascular diseases, digestive diseases, and neoplasms declined, although these conditions still contribute substantially to the absolute burden in 2023. Substance use disorders showed only modest reductions and remain a leading component of the current burden. During this same period, diabetes and kidney diseases transitioned from protective (below the theoretical minimum risk exposure level) to harmful, with positive alcohol-attributable age-standardized DALY rates, while neurological disorders remained protective overall. From 2010 to 2023, cardiovascular diseases, digestive diseases, and neoplasms continued to decline, albeit at slower rates. Substance use disorders decreased slightly overall but changed minimally after 2010 and still account for a substantial share of the burden. Diabetes and kidney diseases, which were protective in 1990, had become net harmful by 2010 and 2023, with a sharp rise of 160.22%. Neurological disorders continue to show negative age-standardized DALY rates, indicating a protective effect (Figure 1).
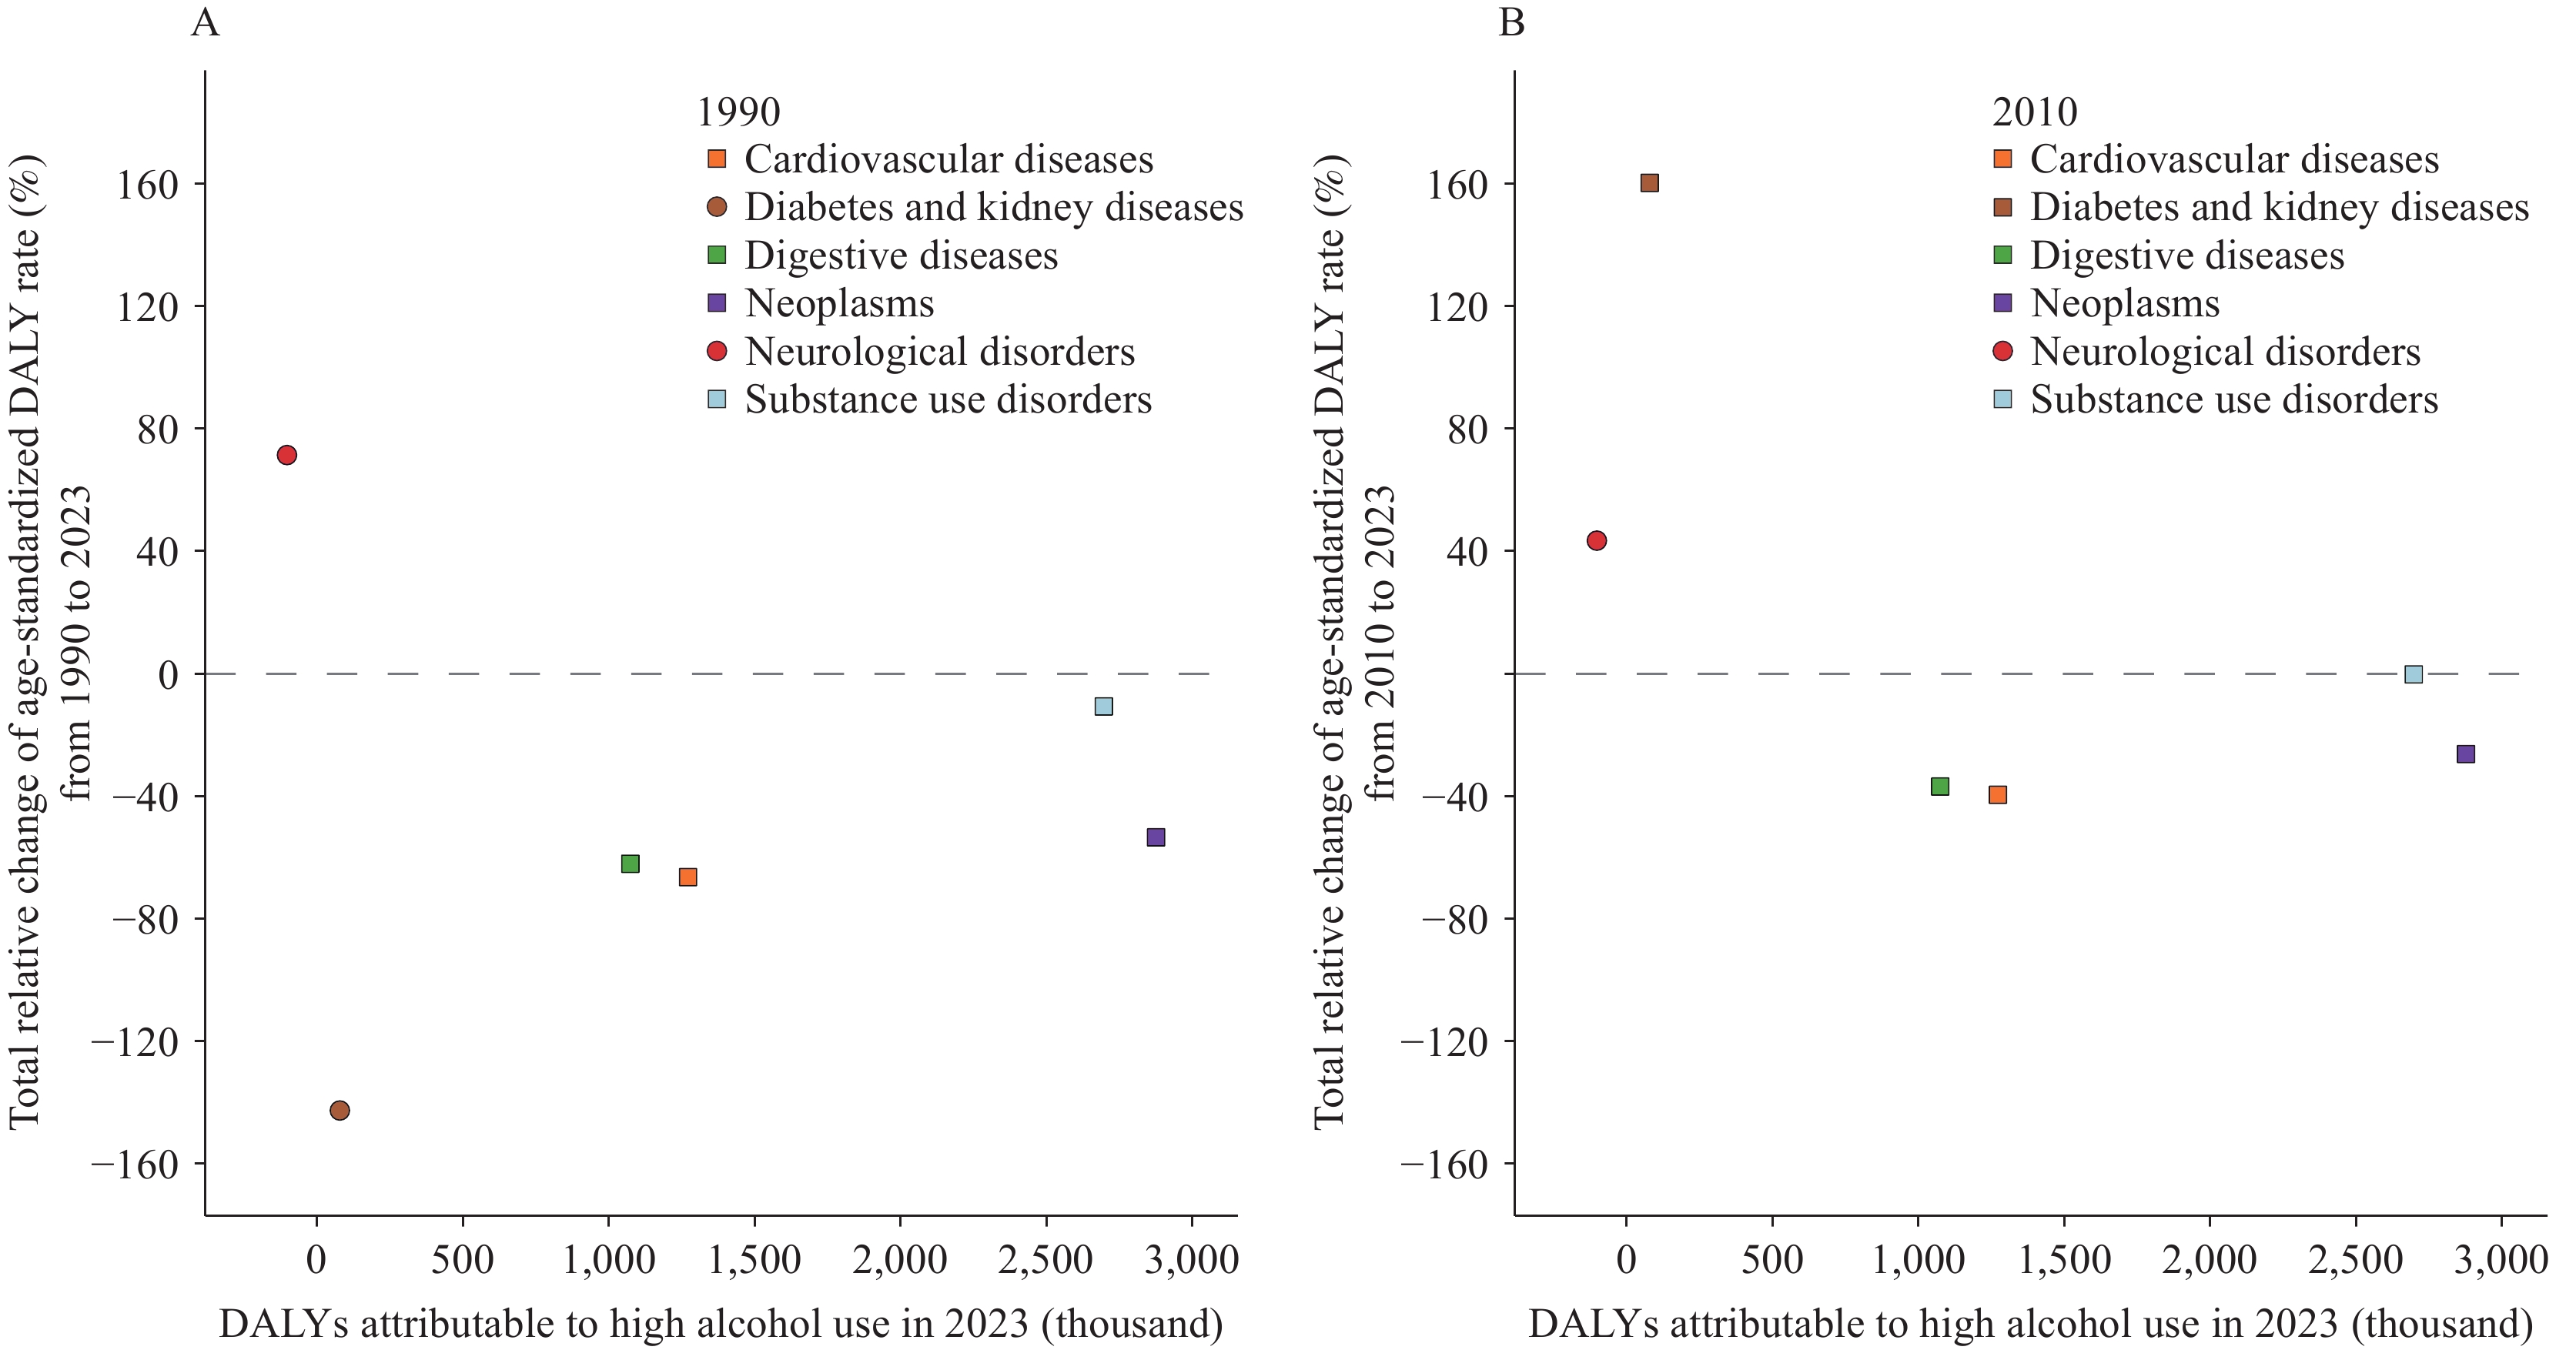 Figure 1.
Absolute number of alcohol-attributable DALYs (thousands) in 2023 plotted against the relative change in age-standardized DALY rates (%). (A) The relative change from 1990 to 2023 versus 2023 absolute values; (B) The relative change from 2010 to 2023 versus 2023 absolute values.
Note: In the legend, circles represent causes with negative values and squares represent causes with positive values in the corresponding baseline year.
Abbreviation: DALYs=disability-adjusted life years.
Age-specific patterns in 2023 reveal distinct burden profiles across disease categories. Cardiovascular diseases demonstrate protective effects (negative alcohol-attributable DALYs) at ages 15–39 but reach peak harmful burden at ages 65 years and older. Similarly, diabetes and kidney diseases show protective effects at ages 15–39 but transition to harmful effects thereafter, with peak burden also occurring at ages 65 years and older. In contrast, digestive diseases, neoplasms, and substance use disorders all reach maximum burden at ages 40–64 years. Neurological disorders present a complex pattern in 2023, with overall negative DALYs indicating net protective effects: the strongest protective effects occur at ages 65 years and older, though a harmful contribution emerges at ages 95 years and older, while ages 15–39 years carry the primary harmful burden (Figure 2). Historical comparisons reveal important temporal shifts: the peak burden for substance use disorders shifted from ages 15–39 years in 1990 to ages 40–64 years in both 2010 and 2023; diabetes and kidney diseases at ages 40–64 years showed protective effects in 1990 and 2010 but became harmful by 2023; and total neurological DALYs transitioned from harmful in 1990 to protective in 2010 and 2023.
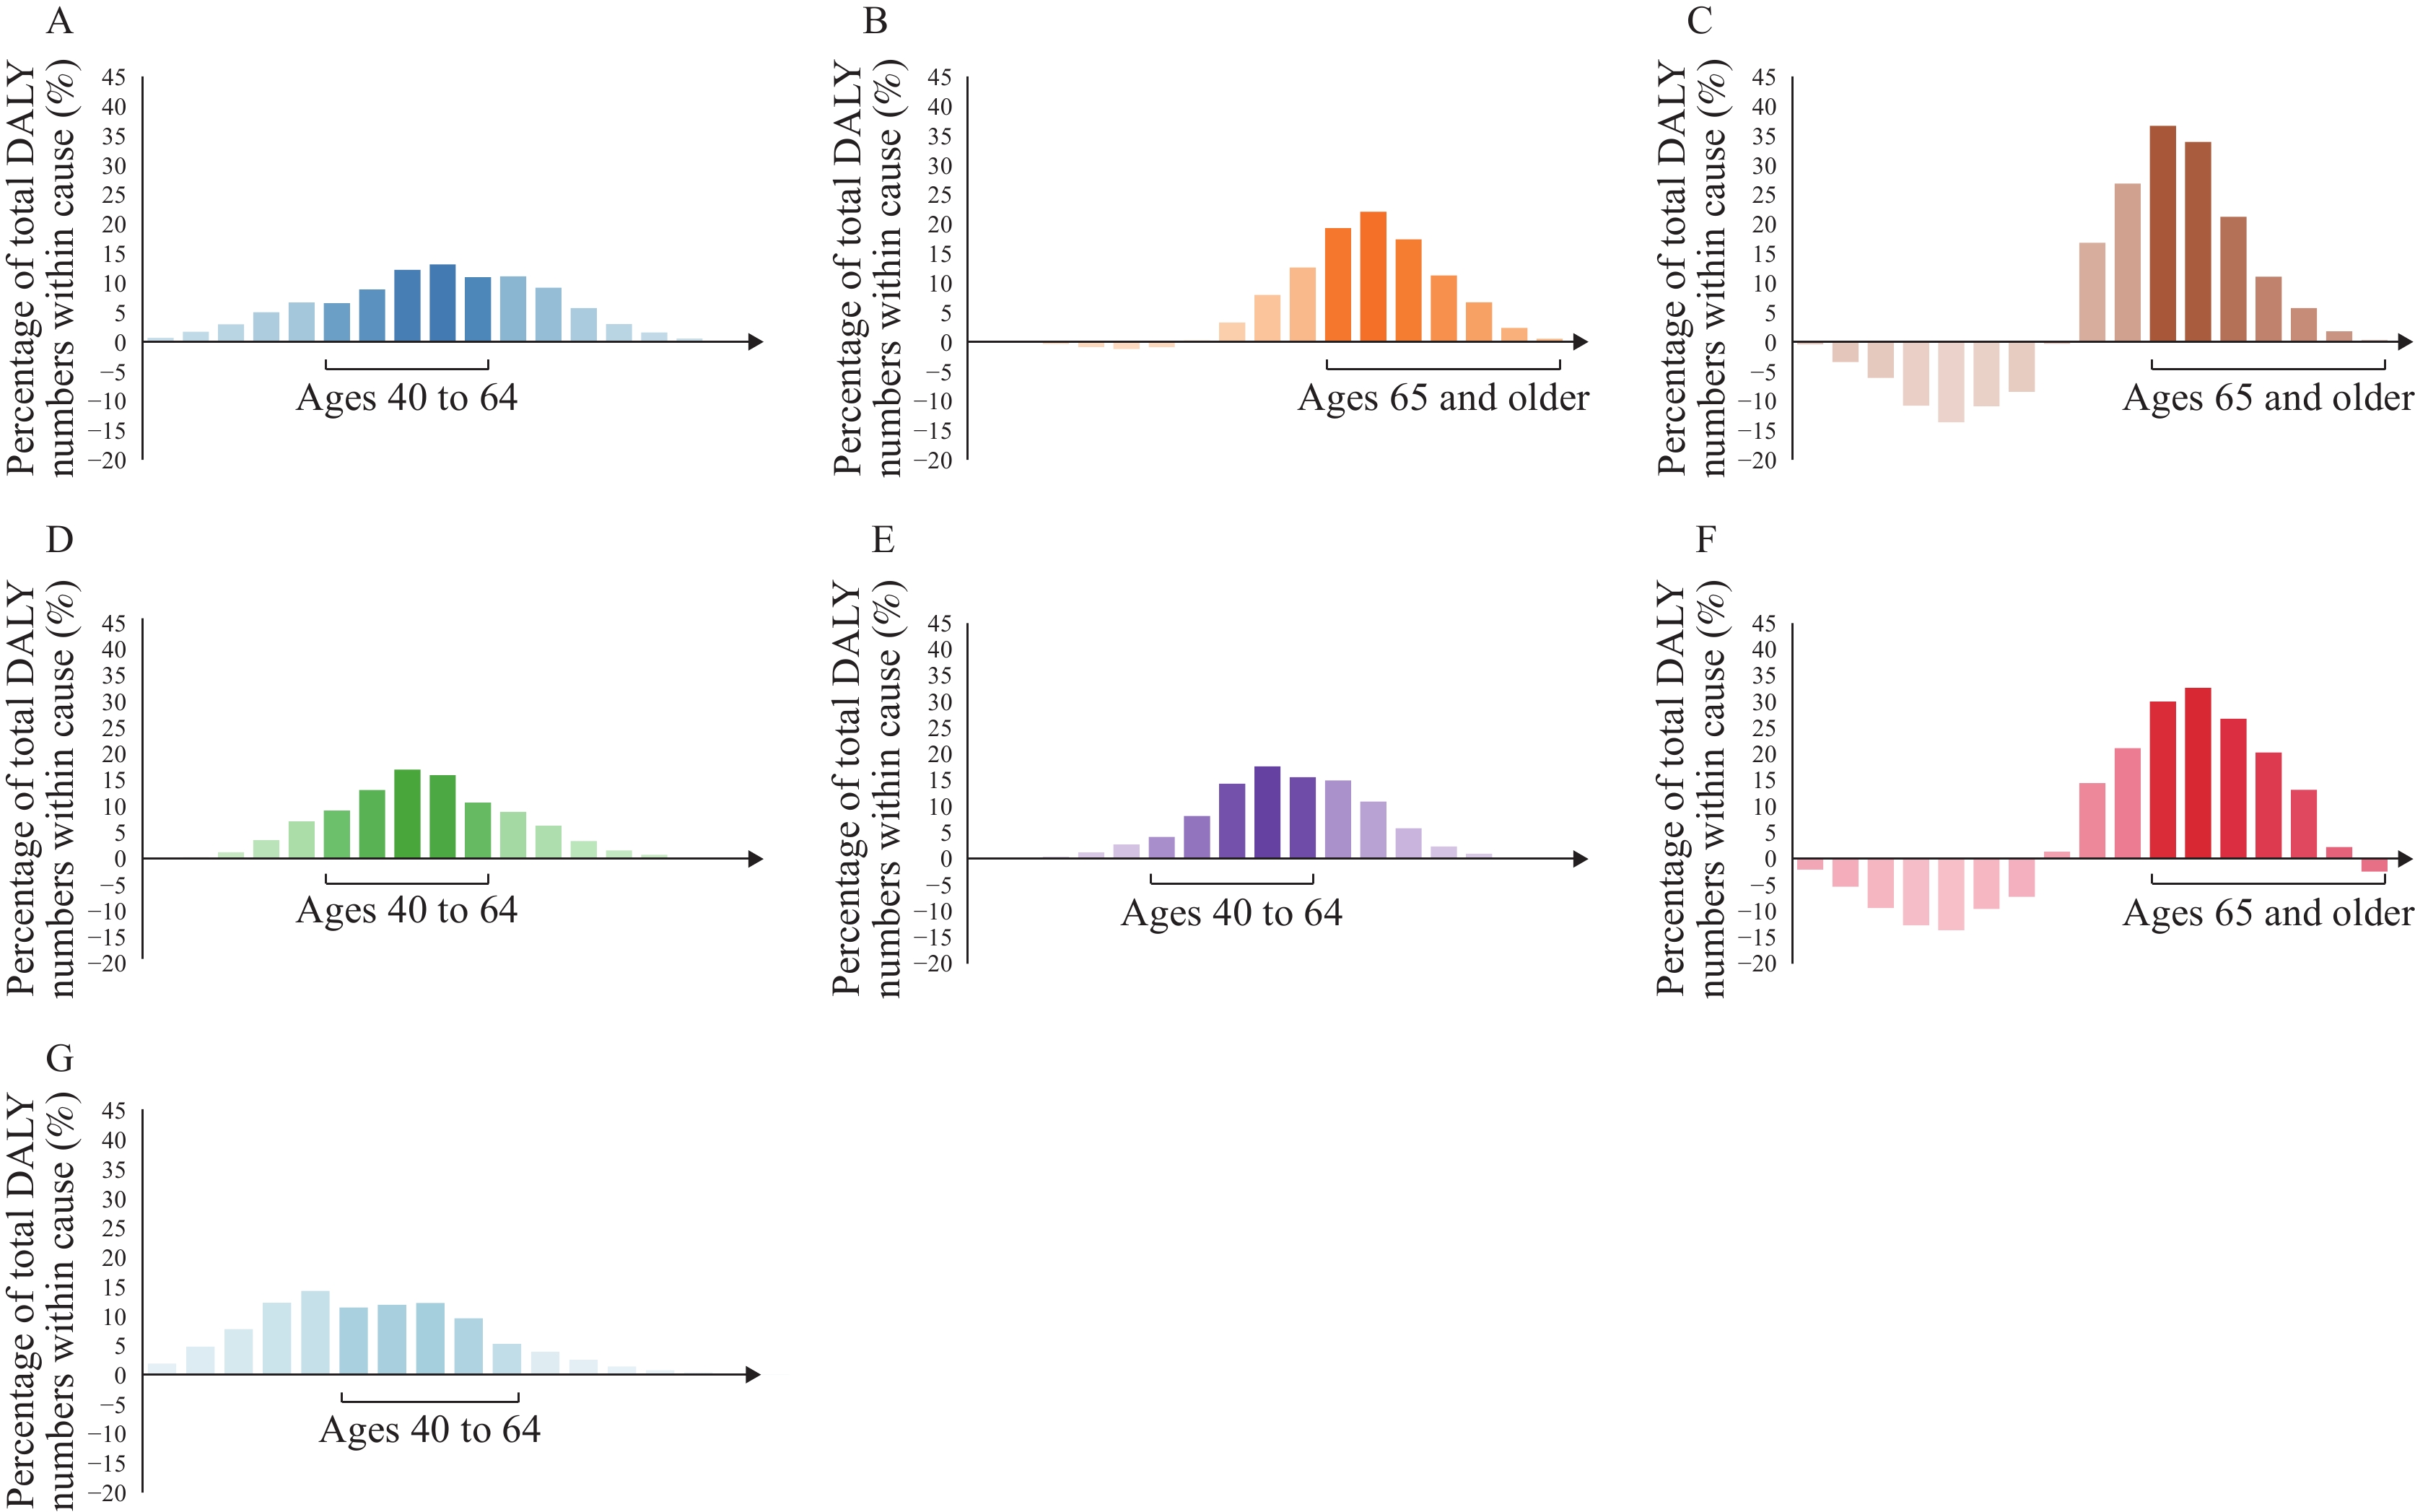 Figure 2.
Percentage of total DALY number attributable to the high alcohol use, by cause and age group — China, 2023. (A) Non-communicable diseases; (B) Cardiovascular diseases; (C) Diabetes and kidney diseases; (D) Digestive diseases; (E) Neoplasms; (F) Neurological disorders; (G) Substance use disorders.
Note: Analyses were performed for three age groups: 15–39 years, 40–64 years, and 65 years and older. For each disease category, the x-axis displays the age group contributing the highest percentage of DALYs attributable to high alcohol use. Abbreviation: DALY=disability-adjusted life year.Sex- and cause-specific spatial patterns of high alcohol use-attributable burden demonstrate substantial regional heterogeneity (
Supplementary Tables S1 –S3 ). From 1990 to 2023, the male-to-female ratio of age-standardized DALY rates for NCDs attributable to high alcohol use in China remained consistently elevated, ranging from 9.74 to 11.38. This sex disparity varied markedly across the six disease categories: cardiovascular diseases (10.90–14.53), neoplasms (13.58–21.20), digestive diseases (16.21–26.82), substance use disorders (4.82–6.68), diabetes and kidney diseases (−233.00–39.63), and neurological disorders (1.45–9.46). In 2023, the national male-to-female ratio reached 10.64; at the provincial level, Guangxi exhibited the highest ratio (15.81), nearly 2.4 times that of the province with the lowest ratio. Regional patterns reveal distinct geographic clustering: the southwest demonstrates a high burden of digestive diseases, with substance use disorders markedly elevated in males. In the northwest, substance use disorders are relatively higher in both sexes. The northeast and north show elevated diabetes and kidney diseases, more pronounced in males. In the central region, females exhibit notably higher diabetes and kidney diseases, whereas males show slightly elevated cardiovascular diseases. In the east and south, neurological disorders generally demonstrate negative DALYs (protective effects) in both sexes. The SARs present a distinct profile characterized by high-burden diabetes and kidney diseases, particularly among females. -
From 1990 to 2023, the high alcohol use-attributable NCDs burden in China demonstrated marked declines in age-standardized death and DALY rates, yet absolute death and DALY numbers increased, reflecting population growth and aging. Neoplasms constitute the largest contributor to this burden, followed by substance use disorders, cardiovascular diseases, and digestive diseases. Diabetes and kidney diseases contribute a smaller but rising burden, whereas neurological disorders remain negative in age-standardized DALY rate.
Over the most recent decade (2010–2023), substance use disorders exhibited minimal improvement, diabetes and kidney diseases rose sharply, and neoplasms continued to account for the largest share of all-age NCDs DALYs. These findings carry three key implications for public health practice. First, prevention and management of alcohol use disorder should be prioritized through routine screening, brief intervention, timely referral, and relapse-prevention follow-up. Second, the rise in diabetes and kidney diseases should be addressed by embedding standardized alcohol screening and counseling within routine cardiometabolic care, with positive screens triggering intervention, referral, and longitudinal monitoring. Third, gains in cardiovascular and digestive diseases should be maintained while accelerating reductions in the neoplasm burden through sustained prevention, earlier detection, and expanded treatment access.
Although the overall age-, sex-, and region-specific patterns of NCDs in 1990, 2010, and 2023 remain broadly similar, cause-specific compositions demonstrate marked age heterogeneity. In 2023, NCDs burden peaked at ages 40–64 years, representing the critical age period for digestive diseases, neoplasms, and substance use disorders, whereas ages 65 years and older carried the highest burden of cardiovascular diseases and diabetes and kidney diseases. At the provincial level, when examining both sexes combined using age-standardized DALY rates, Yunnan, Xizang, and Guizhou recorded the highest alcohol-attributable NCDs burden. For alcohol-attributable substance use disorders specifically, Yunnan, Guizhou, Qinghai, and Inner Mongolia exceeded the national estimate by more than 50%. Tianjin, Shanghai, and Macao emerged as the leading high-burden provinces for diabetes and kidney diseases, while Sichuan, Chongqing, and Heilongjiang led for neoplasms. Notably, the national and all provincial male-to-female ratios of age-standardized DALY rates exceeded the global estimate of 4.92 (6). These patterns underscore pronounced geographic and sex gradients, highlighting the need for differentiated strategies that target high-burden populations and regions (9–11).
The province-level findings suggest four targeted public health strategies. First, provinces with markedly elevated overall NCDs burden attributable to high alcohol use should establish comprehensive, system-wide programs incorporating routine screening, brief intervention, timely referral to specialized services, and structured relapse-prevention follow-up, supported by continuous evaluation metrics. Second, provinces experiencing high burdens of substance use disorders require expanded addiction-medicine capacity, with standardized alcohol screening integrated into primary care settings and provision of evidence-based brief interventions. Third, provinces demonstrating elevated diabetes and kidney disease burdens should embed alcohol screening and counseling within cardiometabolic clinics and chronic disease management programs, ensuring coordinated intervention, appropriate referral pathways, and longitudinal monitoring. Fourth, provinces with substantial neoplasm burden should incorporate alcohol risk assessment and intervention strategies into existing cancer prevention and early detection programs.
This study has several limitations. The GBD estimates rely on model-based synthesis of multiple data sources, which may introduce uncertainty. The relative risks applied are predominantly derived from international meta-analyses and may not fully account for China-specific effect modifiers, potentially introducing bias in cause-specific attribution. Additionally, province-level aggregation may obscure important within-province heterogeneity in alcohol consumption patterns and disease burden, limiting the precision of subnational estimates.
In conclusion, while age-standardized rates have declined substantially, demographic pressures continue to drive increases in absolute disease burden. Public health priorities should emphasize prevention and management of substance use disorders, close monitoring of the rising burden of diabetes and kidney diseases, and sustained efforts to reduce the substantial neoplasm burden. Age-tailored strategies are essential: interventions targeting adults aged 40 to 64 years should focus on digestive diseases, neoplasms, and substance use disorders; programs for individuals aged 65 years and older should prioritize cardiovascular diseases along with diabetes and kidney diseases; and surveillance of neurological disorders should encompass both younger adults (15 to 39 years) and older populations (65 years and older). The pronounced geographic and sex disparities documented in this analysis, consistent with domestic evidence, underscore the need for differentiated prevention strategies tailored to high-burden populations and regions. Given the substantial provincial heterogeneity across disease categories, future interventions should be strategically aligned with the specific disease profiles of high-burden provinces to enhance precision, relevance, and implementation effectiveness.
HTML
| Citation: |

|