
 Download:


-
Introduction: China’s rapidly aging population poses profound public health challenges. Current research overlooks health heterogeneity across older subgroups, limiting the effectiveness of policy responses. This study addresses these gaps to inform targeted health strategies.
Methods: Using data from the Global Burden of Disease Study 2023, we analyzed age-specific mortality rate (MR) and years lived with disability (YLDs) among Chinese older adults (60–74, 75–89, and 90 years and above) from 1990 to 2023. Temporal trends were assessed using average annual percentage change (AAPC).
Results: From 1990–2023, all-cause MR declined substantially; YLDs remained stable. Stroke, ischemic heart disease (IHD), and chronic obstructive pulmonary disease remained the leading causes of mortality. Alzheimer’s disease and other dementias (ADOD) showed the most rapid MR increase [AAPC=1.76, 95% confidence interval (CI): 1.63, 1.87]. Age-related hearing loss and falls dominated YLDs. IHD accounted for 26.20% of deaths in the 90+ age group, whereas ADOD accounted for 13.24%.
Conclusion: The evolving disease burden among older Chinese adults is increasingly dominated by nonfatal health loss and shows distinct patterns across age subgroups. This integrated evidence-based policy shift from disease-centered care to function-oriented strategies is essential to systematically reduce disability and promote healthy aging among the elderly population in China.
-
In 2023, 21% of China’s population was aged 60 years and older, totaling 300 million, posing substantial public health challenges. The World Health Organization (WHO) classifies older adults into the young-old (60–74 years), middle-old (75–89 years), and oldest-old (≥90 years) (1), reflecting extended life expectancy and improved health status. Between 1990 and 2021, China underwent an epidemiological transition in which chronic non-communicable diseases (NCDs) replaced infectious diseases as the dominant contributors to disease burden. In 2018, the prevalence of chronic conditions in older adults was 75.8% (2). Moreover, in 2016, approximately 33% of China’s total disease burden was attributable to individuals aged 60 and above, projected to increase to 60% by 2050 (3).
Current studies often treat older adults as a homogeneous group, overlooking variations in physiological capacity, disease patterns, and healthcare needs across different age groups. This limits the effectiveness of public health resource allocation and policy planning, failing to meet the growing health demands of the elderly population. Conventional burden metrics, such as mortality and incidence, remain prioritized, whereas composite indicators, such as years lived with disability (YLDs), have received insufficient attention. Such incomplete understanding of the full impact of NCDs on quality of life and long-term functional status may hinder the development of quality-focused health-service systems and evidence-based policies tailored to aging populations.
The Global Burden of Disease (GBD) 2023 dataset offers high-quality age-stratified estimates, enabling a detailed analysis of dynamic disparities in disease burden among older age strata. This study utilized the GBD 2023 data to systematically examine trends in the disease spectrum among the Chinese elderly from 1990 to 2023. These findings aim to inform stratified health interventions, optimize resource allocation, and support the goals of “Healthy China 2030” in promoting healthy aging.
The GBD Study 2023 data used in this study documents incidence, prevalence, mortality, years of life lost (YLLs), YLDs, and disability-adjusted life years (DALYs) for 371 diseases and injuries across 204 countries and territories. We extracted all-cause and GBD Level 3 cause-specific mortality and YLDs data for the Chinese population aged 60 years and older, stratified by 5-year age groups. Cause-specific mortality and YLD rates were calculated for the overall elderly population (above 60 years) and for specific age strata (60–74, 75–89, and 90 years and older) based on age-specific population estimates. The 95% uncertainty intervals (UIs) for all key estimates were calculated using the GBD method to quantify sampling and non-sampling uncertainties. Age-standardized rates (ASRs) were calculated using the 2020 Chinese census population as the standard. The average annual percentage change (AAPC) to characterize temporal trends in the disease burden of GBD Level 3 causes between 1990 and 2023 in China. AAPC and its 95% confidence interval (CI) were estimated by fitting piecewise log-linear regression models using the Joinpoint Regression Program (version 5.0.2; National Cancer Institute, Rockville, MD, US) (4). Additional statistical analyses and data visualizations were performed using the R software (version 4.3.2; R Foundation for Statistical Computing, Vienna, Austria). Significance level was set at 0.05.
Between 1990 and 2023, all-cause mortality rate (MR) per 100,000 among Chinese adults aged 60 years and older declined from 5,182.90 (95% UI: 4,677.19, 5,697.50) to 3034.53 (2,482.67, 3,614.91); YLD rate per 100,000 increased slightly from 23,195.01 (17,821.15, 29,528.87) to 23,510.68 (18,111.90, 29,900.34). Significant shifts were observed in the cause-specific mortality and disability patterns (Table 1). In 1990, the leading causes of death were stroke, chronic obstructive pulmonary disease (COPD), ischemic heart disease (IHD), stomach cancer, and hypertensive heart disease. By 2023, the top causes shifted to stroke (MR=619.53/100,000; 478.17–773.06), IHD (MR=605.01/100,000; 468.76–748.25), COPD (MR=324.76/100,000; 230.53–495.15), tracheal, bronchus, and lung cancer (MR=213.26/100,000; 161.96–264.30), and Alzheimer’s disease and other dementias (ADOD) (MR=196.86/100,000; 47.30–490.71). ADOD-related mortality showed a remarkable increase, with an AAPC of 1.76 (95% CI: 1.63, 1.87). IHD mortality showed a modest increase, with an AAPC of 0.30 (0.19, 0.40). Age-related and other hearing loss (AOHL) and falls remained the top two causes of YLDs throughout the study period (2,833.58 and 2,245.49 per 100,000 in 2023, respectively). Substantial annual increases in YLD rates were also observed for ADOD; atrial fibrillation; and flutter, falls, and anxiety disorders.
Level 3 causes 1990 (95% UI) 2023 (95% UI) AAPC (95% CI) Mortality (/100,000) Stroke 1,662.47 (1,359.42, 2,000.30) 619.53 (478.17, 773.06) –2.84 (–2.94, –2.75) Ischemic heart disease 560.36 (443.07, 684.41) 605.01 (468.76, 748.25) 0.30 (0.19, 0.40) Chronic obstructive pulmonary disease 610.53 (396.25, 823.65) 324.76 (230.53, 495.15) –1.87 (–1.94, –1.80) Tracheal, bronchus, and lung cancer 212.92 (175.11, 285.13) 213.26 (161.96, 264.30) 0.11 (0.008, 0.22) Alzheimer’s disease and other dementias 116.78 (26.54, 332.33) 196.86 (47.30, 490.71) 1.76 (1.63, 1.87) Stomach cancer 283.80 (223.31, 361.92) 102.23 (73.23, 137.40) –2.95 (–3.04, –2.86) Hypertensive heart disease 242.15 (136.36, 347.86) 97.03 (58.42, 132.08) –2.65 (–2.79, –2.50) Esophageal cancer 168.78 (124.30, 204.11) 70.26 (53.60, 89.86) –2.52 (–2.61, –2.42) Colon and rectum cancer 81.48 (67.03, 98.46) 67.32 (52.57, 86.64) –0.51 (–0.61, –0.41) Diabetes mellitus 53.17 (38.40, 70.95) 50.87 (36.41, 67.72) –0.05 (–0.16, 0.08) Lower respiratory infections 109.98 (80.25, 146.30) 50.79 (35.76, 69.63) –2.28 (–2.44, –2.12) Chronic kidney disease 71.46 (48.68, 106.48) 42.89 (32.12, 55.00) –1.45 (–1.55, –1.35) Falls 27.21 (18.63, 38.67) 35.24 (17.39, 52.92) 0.92 (0.80, 1.03) Pancreatic cancer 27.51 (23.06, 33.26) 29.98 (23.60, 37.80) 0.35 (0.26, 0.43) Liver cancer 45.09 (36.92, 55.19) 29.83 (23.48, 37.20) –1.18 (–1.28, –1.09) Parkinson’s disease 26.85 (21.84, 34.54) 27.05 (20.57, 35.03) 0.15 (0.02, 0.27) Cirrhosis and other chronic liver diseases 78.72 (57.20, 107.43) 24.79 (18.47, 32.47) –3.36 (–3.44, –3.28) Road injuries 57.55 (30.61, 89.54) 22.44 (13.28, 31.16) –2.76 (–2.85, –2.66) Atrial fibrillation and flutter 18.83 (14.12, 23.47) 21.62 (15.93, 27.99) 0.41 (0.29, 0.54) Self–harm 54.42 (37.32, 73.26) 17.33 (12.55, 24.68) –3.40 (–3.49, –3.30) YLDs (/100,000) Age–related and other hearing loss 2,585.00 (1,749.22, 3,524.33) 2,833.58 (1,960.10, 3,896.06) 0.28 (0.27, 0.29) Falls 1,665.96 (1,216.38, 2,206.09) 2,245.49 (1,615.92, 3,094.28) 0.94 (0.87, 1.01) Low back pain 1,966.39 (1,239.35, 2,905.04) 1,459.29 (926.52, 2,161.41) –0.91 (–0.93, –0.88) Blindness and vision loss 1,827.71 (1,274.65, 2,546.74) 1,326.94 (895.15, 1,923.53) –0.95 (–0.98, –0.92) Alzheimer’s disease and other dementias 746.34 (498.85, 1,041.76) 1,302.14 (879.37, 1,793.91) 1.74 (1.69, 1.80) Stroke 1,067.81 (734.33, 1,440.51) 1,188.44 (838.22, 1,599.40) 0.33 (0.32, 0.34) Diabetes mellitus 948.29 (658.38, 1,300.68) 1,159.55 (807.65, 1,579.57) 0.62 (0.57, 0.68) Osteoarthritis 928.96 (449.58, 1,973.99) 1,120.02 (535.68, 2,384.60) 0.58 (0.56, 0.61) Depressive disorders 765.19 (528.40, 1,064.38) 849.04 (571.17, 1,152.66) 0.34 (0.26, 0.44) Oral disorders 818.23 (499.39, 1,230.32) 808.95 (509.72, 1,183.96) –0.01 (–0.05, 0.02) Ischemic heart disease 511.52 (333.71, 746.48) 653.51 (424.69, 962.21) 0.74 (0.68, 0.79) Chronic obstructive pulmonary disease 632.65 (505.08, 787.01) 574.44 (441.32, 729.83) –0.30 (–0.31, –0.28) Neck pain 507.12 (258.37, 866.88) 548.59 (281.91, 929.12) 0.24 (0.23, 0.26) Headache disorders 473.01 (327.90, 675.77) 487.40 (332.52, 686.22) 0.08 (0.07, 0.09) Anxiety disorders 342.89 (217.69, 509.18) 466.25 (283.16, 760.00) 0.91 (0.86, 0.96) Chronic kidney disease 411.10 (275.04, 583.41) 408.25 (266.47, 588.83) 0.07 (0.01, 0.13) Road injuries 353.11 (259.83, 464.90) 310.06 (224.97, 410.88) –0.38 (–0.40, –0.36) Schizophrenia 263.70 (194.86, 341.29) 257.06 (187.07, 330.50) –0.08 (–0.09, –0.07) Atrial fibrillation and flutter 186.90 (112.58, 294.81) 255.84 (154.72, 402.54) 0.99 (0.92, 1.07) Gallbladder and biliary diseases 282.07 (179.61, 426.63) 243.04 (153.94, 362.08) –0.35 (–0.46, –0.21) Abbreviation: YLDs=years lived with disability; GBD=global burden of disease; AAPC=average annual percentage change; CI=confidence interval; UI=uncertainty interval. Table 1. Rates of mortality and YLDs from the top 20 GBD Level 3 causes among older adults aged over 60 in China in 1990 and 2023, and the AAPC from 1990 to 2023.
ASRs of mortality decreased for most leading causes, whereas ASRs of YLDs rose (Figure 1). Mortality trends changed from 1990 to 2010 and stabilized thereafter. Stroke, IHD, and COPD consistently ranked as the top three mortality causes, each showing significant declines in ASRs of mortality. Contrarily, diabetes and falls rose in rank, and pancreatic cancer entered the top 15 causes by 2023 (AAPC=0.15; 0.07, 0.23). The overall disability burden remained relatively stable, with significant reductions in ASRs of YLDs for low back pain, blindness, and vision loss.
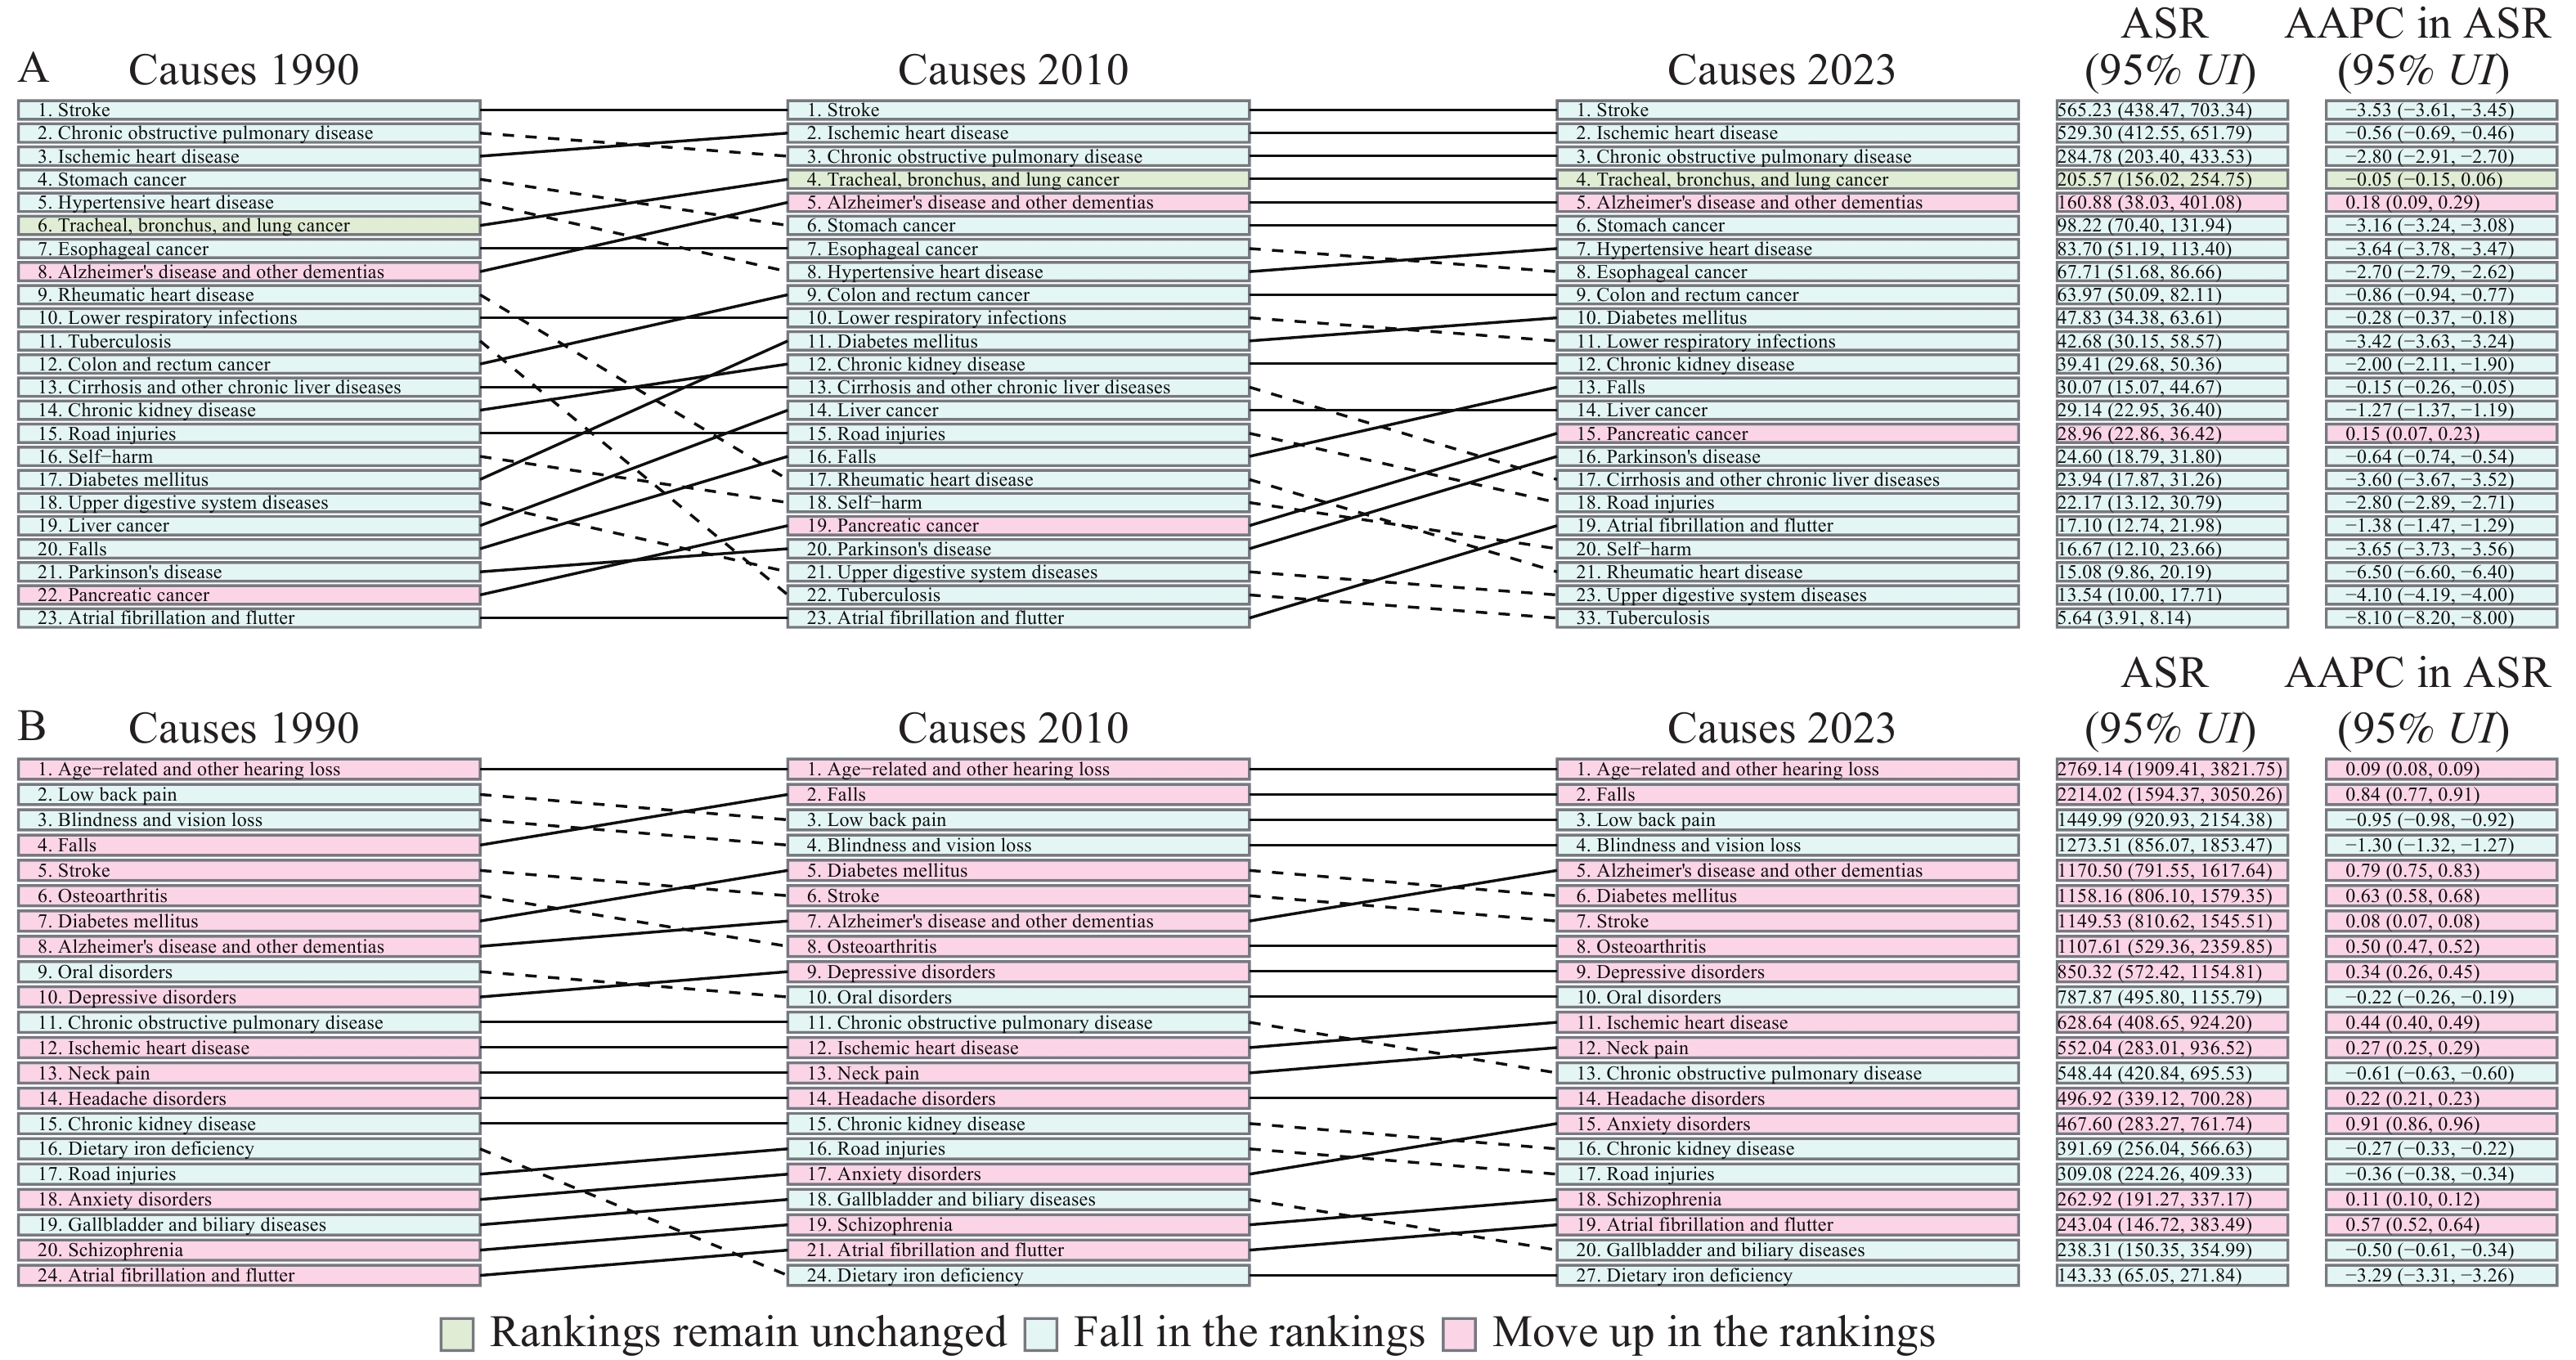 Figure 1.
Rankings of the top 20 Level 3 causes from the GBD Study by ASR of (A) mortality and (B) YLDs among older adults in China, 1990–2023, with their corresponding AAPCs.
Abbreviation: GBD=global burden of disease; YLDs=years lived with disability; ASR=age-standardized rate; AAPC=average annual percentage change.Notable age-specific disparities were observed (Figure 2). Stroke-related deaths declined across all age strata, while IHD-related deaths increased among those aged 90 and above, accounting for 26.20% of deaths in 2023. ADOD-related deaths were increasingly common with advancing age, representing 13.24% in the 90 and above age strata. Tracheal, bronchus, and lung cancer mortality proportions increased substantially in the 60–74 age strata. Diabetes-related mortality was significant in the 60–74 strata. Falls were prominent among those aged over 90. Regarding disability, AOHL dominated in the 60–89 age group, while ADOD was the primary cause in those above 90 years. Blindness and vision loss accounted for an increasing share of YLDs with increasing age. IHD contributed substantially to disability among adults aged 75 and above.
 Figure 2.
Cause-specific proportions of (A) all-cause deaths and (B) YLDs for the top 10 GBD Level 3 causes among older adults in China in 1990, 2010, and 2023.
Abbreviation: YLDs=years lived with disability; GBD=global burden of disease. -
This study systematically analyzed trends in mortality and disability among adults aged 60 years and above in China from 1990 to 2023. Results indicated a marked decline in all-cause MR, while the burden of disability, measured by YLDs, remained largely unchanged, highlighting the complex challenges of promoting healthy aging in rapidly aging societies.
The substantially reduced ASR of all-cause mortality in China exceeded the average decline observed in many middle- and low-income countries (5). This likely reflects substantial advances in China’s health system driven by socioeconomic development, expanded health coverage, improved risk factor management (e.g., hypertension), and progress in medical technology. Throughout the study period, stroke, IHD, and COPD remained the top three causes of death, while tracheal, bronchus, and lung cancer and ADOD rose to fourth and fifth places, respectively. The rising crude IHD mortality, alongside a falling age-standardized rate, indicates population aging as the main driver, alongside gains in the effectiveness of cardiovascular disease control among older adults. The persistence of COPD is a distinctive feature of the disease burden in China. ASR of mortality due to ADOD increased significantly, consistent with global trends in cognitive disorders, emphasizing the challenge posed by China’s accelerated aging population (6).
Contrary to the declining MR, the YLD rate increased slightly, suggesting that a longer life expectancy is accompanied by more years spent with disability and functional impairment, posing ongoing challenges for families and healthcare systems. AOHL and falls consistently lead to the disability burden. Substantial increases in YLD rates were notable for ADOD, falls, atrial fibrillation and flutter, and anxiety disorders, indicating that sensory, musculoskeletal, cognitive, mental, and cardiovascular impairments contribute to disability in older age, consistent with previous studies (7–10).
Age-stratified analyses revealed substantial heterogeneity across the age groups. The proportion of ADOD-related deaths increased steeply with age. Among adults aged 90 years and above, IHD surpassed stroke as the leading cause of death in 2023, with falls also becoming a major cause. This may be partly attributable to a competing risk effect, whereby successful stroke prevention increases survival at advanced ages, exposing the underlying risks of cardiovascular and cognitive diseases. Regarding disability, AOHL was the leading cause in those aged 60–89, and ADOD in those aged 90 years and older. Low back pain and IHD were prominent contributors to YLDs in the 60–74 and 75+ strata, respectively. A pronounced increase in lung cancer mortality was observed in adults aged 60–74 years old. Age-differentiated health strategies, including targeting chronic diseases and musculoskeletal conditions in the young-old, strengthening cardiovascular and cognitive care in the middle-old and old-old, and prioritizing IHD, ADOD, and fall prevention in the oldest-old, are important.
Limitations include reliance on modeled estimates, which require cautious interpretation, and the lack of subgroup analyses by sex, region, or urban–rural residence, possibly masking important disparities. Additionally, adopting a single-disease analytical framework failed to account for the prevalence of multimorbidity among older adults. Behavioral, social, and environmental determinants of disease burden have also not been fully explored.
In conclusion, despite significant reductions in mortality, China continues to face the dual challenges of a persistent chronic disease burden and rising disability among older adults. Therefore, health policies transition from a disease-centered model to a function-oriented approach, focusing on establishing an integrated elderly health service system. Building on existing policies, establishing of a community-based hierarchical health management pathway centered on family physicians is recommended. First, a comprehensive geriatric assessment should be incorporated as a standardized component of basic elderly health services under family physician contracts, facilitating early identification and systematic health evaluation. Second, a dynamic risk-stratification mechanism should be established at the community level. For common geriatric risks, such as ADOD, AOHL, falls, and COPD, personalized intervention packages can be activated, including balance training, home modification guidance, and pulmonary rehabilitation. Finally, seamlessly integrating community and specialist care is essential. High-risk patients should receive expedited referrals to appropriate hospital specialties, with subsequent management and follow-up responsibilities returned to the family physician team. This pathway systematically integrates chronic disease management, disability prevention, and rehabilitation into a continuous life-cycle health management model. Moreover, differentiated intervention strategies tailored to predominant health threats in specific age groups are crucial to systematically delay functional decline and reduce the overall burden of disease and disability among aging populations.
-
We acknowledge the Institute for Health Metrics and Evaluation (IHME) for providing the data from the Global Burden of Disease Study 2023.
HTML
| Citation: |

|