
 Download:


-
Introduction: This study investigated the prevalence of metabolic dysfunction-associated steatotic liver disease (MASLD) with clinically significant fibrosis among obese patients with type 2 diabetes mellitus (T2DM).
Methods: This multicenter study enrolled T2DM patients from tertiary hospitals and primary care facilities across 21 cities in China between 2017 and 2024. Clinically significant fibrosis was defined as liver stiffness measurement (LSM) ≥8 kPa assessed by vibration-controlled transient elastography (VCTE) or biopsy-confirmed fibrosis stage ≥F2.
Results: Of the 10,281 patients included, 9,725 comprised the VCTE cohort (5,171 from clinics and 4,554 from primary care), while 556 comprised the biopsy cohort. Overall, 25.6% were obese. The prevalence of MASLD with clinically significant fibrosis reached 26.7% in obese patients, significantly exceeding that in non-obese patients (8.4%). This prevalence increased progressively with rising body mass index and demonstrated a strong association with the number of cardiometabolic risk factors. Furthermore, a non-invasive model incorporating age, waist circumference, alanine aminotransferase, total bilirubin, and triglycerides exhibited reliable performance in stratifying the risk of MASLD with clinically significant fibrosis among obese patients with T2DM [Area under the receiver operating characteristic curve (AUC): 0.799 (95% CI: 0.767–0.832)].
Conclusions: MASLD with clinically significant fibrosis is highly prevalent among obese patients with T2DM, emphasizing the necessity for systematic risk stratification and integrated management of these interconnected metabolic conditions.
-
Metabolic dysfunction-associated steatotic liver disease (MASLD) affects approximately 38% of the global adult population, with its prevalence rising in parallel with the growing burden of metabolic disorders (1). The progression to clinically significant fibrosis substantially elevates the risk of liver-related complications, including cirrhosis and hepatocellular carcinoma (2). Cardiometabolic risk factors (CMRFs), particularly type 2 diabetes mellitus (T2DM) and obesity, frequently coexist with MASLD and further accelerate disease progression (3). Recognizing this critical intersection, the recent American Diabetes Association (ADA) consensus report recommends systematic risk stratification for MASLD and liver fibrosis in adults with T2DM, especially those with obesity (2). Despite these recommendations, comprehensive prevalence data and risk factor analyses for MASLD with clinically significant fibrosis among patients with both obesity and T2DM in China remain scarce. To address this knowledge gap, we conducted a large-scale multicenter study to evaluate the prevalence of MASLD with clinically significant fibrosis in obese patients with T2DM and to identify associated risk factors. Additionally, we systematically examined how five CMRFs, individually and in combination, contribute to the development of clinically significant fibrosis in this high-risk population.
This prospective multicenter study enrolled adult patients with T2DM from tertiary hospitals and primary care facilities across 21 cities in China (
Supplementary Table S1 ). The study comprised two cohorts: the vibration-controlled transient elastography (VCTE) cohort included patients who underwent VCTE examination between 2022 and 2024, while the liver biopsy cohort included patients with MASLD and T2DM who underwent liver biopsy between 2017 and 2024 (Supplementary Figure S1 ). All VCTE examinations were performed using the FibroScan® device (Echosens, Paris, France) according to standardized protocols. Clinically significant fibrosis was defined as liver stiffness measurement (LSM) ≥8 kPa in the VCTE cohort or histological fibrosis stage ≥F2 in the biopsy cohort, consistent with our previous study (4). Statistical analyses were conducted using SPSS (version 27.0.1, IBM SPSS Statistics, Armonk, NY, USA) and GraphPad Prism (version 10.0; GraphPad Software, San Diego, CA, USA). Additional methodological details, including exclusion criteria, VCTE reliability standards, histological assessment procedures, and statistical methods, are provided in theSupplementary Materials .A total of 10,281 participants were enrolled from two cohorts. The VCTE cohort comprised 9,725 participants (50.0% male; 24.5% obese). Obese patients were younger than their non-obese counterparts [49.4 (14.34) vs. 56.6 (13.18) years] (Table 1). Of these, 5,171 patients were recruited from clinics and 4,554 from primary care settings. Patients in primary care were older [61.4 (10.39) vs. 49.0 (13.87) years] and had a lower obesity prevalence (16.6% vs. 31.5%) compared to those in clinics (
Supplementary Table S2 ). The liver biopsy cohort included 556 biopsy-proven MASLD patients with T2DM (48.9% male; 44.1% obese) (Table 2).Characteristic Overall (N=9,725) Non-obese (n=7,338) Obese (n=2,387) P Age, years 54.8 (13.82) 56.6 (13.18) 49.4 (14.34) <0.001 Groups <0.001 18 to 59 years 5,665 (58.3%) 3,932 (53.6%) 1,733 (72.6%) ≥60 years 4,060 (41.7%) 3,406 (46.4%) 654 (27.4%) Sex, n (%) <0.001 Male 4,865 (50.0%) 3,471 (47.3%) 1,394 (58.4%) Female 4,860 (50.0%) 3,867 (52.7%) 993 (41.6%) BMI, kg/m2 25.8 (4.11) 24.0 (2.48) 31.2 (3.33) <0.001 Waist circumference, cm (n=8,101) 89.9 (10.98) 86.5 (8.51) 101.7 (10.41) <0.001 Hypertension (n=8,925) 5,745 (64.4%) 4,292 (62.6%) 1,453 (70.2%) <0.001 Dyslipidemia (n=3,493) 2,374 (67.9%) 1,595 (63.3%) 779 (80.0%) <0.001 Platelet count, ×109/L (n=3,492) 237.4 (69.82) 233.2 (68.54) 248.6 (72.05) <0.001 GGT, IU/L (n=2,498) 51.3 (97.28) 48.0 (107.53) 58.3 (69.99) 0.005 ALT, IU/L (n=3,802) 38.7 (108.53) 35.1 (123.84) 48.3 (44.95) <0.001 AST, IU/L (n=3,802) 30.2 (77.29) 29.2 (89.11) 32.8 (25.33) 0.054 ALB, g/L (n=3,753) 44.5 (4.17) 44.5 (4.23) 44.6 (3.98) 0.566 TBIL, μmol/L (n=3,791) 16.1 (12.05) 16.6 (13.42) 14.5 (6.83) <0.001 Scr, μmol/L (n=3,553) 151.2 (1,252.23) 96.7 (700.65) 296.7 (2,101.16) 0.004 UA, μmol/L (n=3,545) 356.9 (103.00) 340.4 (95.74) 400.9 (108.60) <0.001 HbA1c, % (n=3,004) 7.1 (1.80) 7.1 (1.80) 7.3 (1.78) 0.007 TC, mmol/L (n=3,494) 5.1 (1.27) 5.1 (1.31) 5.1 (1.17) 0.151 TG, mmol/L (n=3,494) 2.2 (2.42) 2.0 (2.34) 2.6 (2.55) <0.001 HDL-C, mmol/L (n=3,492) 1.3 (0.33) 1.3 (0.35) 1.2 (0.27) <0.001 LDL-C, mmol/L (n=3,494) 3.0 (3.69) 3.0 (4.32) 3.0 (0.87) 0.894 CAP, dB/m 260.9 (55.77) 250.5 (54.40) 293.1 (46.98) <0.001 CAP ≥248 dB/m 5,807 (59.7%) 3,783 (51.6%) 2,024 (84.8%) <0.001 CAP ≥268 dB/m 4,452 (45.8%) 2,736 (37.3%) 1,716 (71.9%) <0.001 CAP ≥280 dB/m 3,687 (37.9%) 2,205 (30.0%) 1,482 (62.1%) <0.001 LSM, kPa 6.9 (6.00) 6.5 (5.74) 8.0 (6.60) <0.001 LSM ≥6.8 kPa 2,972 (30.6%) 1,865 (25.4%) 1,107 (46.4%) <0.001 LSM ≥8.0 kPa 1,817 (18.7%) 1,096 (14.9%) 721 (30.2%) <0.001 LSM ≥10.0 kPa 1,020 (10.5%) 613 (8.4%) 407 (17.1%) <0.001 LSM ≥13.0 kPa 529 (5.4%) 329 (4.5%) 200 (8.4%) <0.001 Note: Data are presented as mean (SD) or n (%).
Abbreviation: VCTE=vibration-controlled transient elastography; ALB=albumin; ALT=alanine aminotransferase; AST=aspartate aminotransferase; BMI=body mass index; CAP=controlled attenuation parameter; GGT=gamma-glutamyltransferase; HbA1c=hemoglobin A1c; HDL-C=high-density lipoprotein cholesterol; LDL-C=low-density lipoprotein cholesterol; LSM=liver stiffness measurement; Scr=serum creatinine; SD=standard deviation; TBIL=total bilirubin; TC=total cholesterol; TG=triglyceride; UA=uric acid.Table 1. Baseline characteristics of patients with type 2 diabetes mellitus stratified by obesity status in the VCTE cohort.
Characteristic Overall (N=556) Non-obese (n=311) Obese (n=245) P Age, years 46.6 (12.98) 49.8 (11.69) 42.5 (13.41) <0.001 Groups 0.001 18 to 59 years 470 (84.5%) 249 (80.1%) 221 (90.2%) ≥60 years 86 (15.5%) 62 (19.9%) 24 (9.8%) Sex, n (%) <0.001 Male 272 (48.9%) 131 (42.1%) 141 (57.6%) Female 284 (51.1%) 180 (57.9%) 104 (42.4%) BMI, kg/m2 27.7 (4.14) 24.8 (2.05) 31.4 (3.04) <0.001 Waist circumference, cm (n=393) 95.2 (10.09 89.2 (6.91) 101.9 (8.77) <0.001 Hypertension (n=249) 187 (75.1%) 103 (71.0%) 84 (80.8%) 0.080 Dyslipidemia (n=503) 405 (80.5%) 215 (75.7%) 190 (86.8%) 0.002 Platelet count, ×109/L 225.5 (65.26) 217.3 (59.69) 235.8 (70.47) 0.001 GGT, IU/L (n=387) 89.1 (104.75) 89.6 (112.37) 88.4 (92.40) 0.906 ALT, IU/L 75.4 (58.04) 67.0 (49.52) 86.1 (65.89) <0.001 AST, IU/L 58.6 (60.39) 53.3 (38.44) 65.3 (79.60) 0.031 ALB, g/L (n=551) 43.7 (4.69) 43.5 (4.17) 43.9 (5.29) 0.322 TBIL, μmol/L (n=551) 13.3 (6.89) 13.1 (6.92) 13.6 (6.86) 0.337 Scr, μmol/L (n=416) 63.4 (15.31) 61.2 (14.97) 66.0 (15.33) 0.001 UA, μmol/L (n=414) 364.0 (93.67) 345.7 (92.32) 384.9 (90.99) <0.001 HbA1c, % (n=303) 7.6 (1.80) 7.4 (1.70) 7.8 (1.91) 0.080 TC, mmol/L (n=499) 4.9 (1.27) 4.9 (1.25) 5.0 (1.29) 0.396 TG, mmol/L (n=499) 2.5 (2.54) 2.3 (2.21) 2.8 (2.88) 0.017 HDL-C, mmol/L (n=499) 1.4 (0.96) 1.5 (1.04) 1.3 (0.82) <0.001 LDL-C, mmol/L (n=499) 2.5 (1.09) 2.4 (1.08) 2.7 (1.09) 0.006 CAP, dB/m (n=370) 302.7 (42.64) 295.2 (42.88) 313.8 (39.92) <0.001 LSM, kPa (n=368) 10.2 (6.66) 9.7 (6.31) 11.0 (7.08) 0.067 Liver steatosis 0.073 S0 20 (3.6%) 15 (4.8%) 5 (2.0%) S1 175 (31.5%) 107 (34.5%) 68 (27.8%) S2 235 (42.3%) 124 (40.0%) 111 (45.3%) S3 125 (22.5%) 64 (20.6%) 61 (24.9%) Liver fibrosis 0.394 F0-F1 297 (53.4%) 173 (55.6%) 124 (50.6%) F2 133 (23.9%) 66 (21.2%) 67 (27.3%) F3 89 (16.0%) 50 (16.1%) 39 (15.9%) F4 37 (6.7%) 22 (7.1%) 15 (6.1%) Note: Data are presented as mean (SD) or n (%).
Abbreviation: ALB=albumin; ALT=alanine aminotransferase; AST=aspartate aminotransferase; BMI=body mass index; CAP=controlled attenuation parameter; GGT=gamma-glutamyltransferase; HbA1c=hemoglobin A1c; HDL-C=high-density lipoprotein cholesterol; LDL-C=low-density lipoprotein cholesterol; LSM=liver stiffness measurement; Scr=serum creatinine; SD=standard deviation; TBIL=total bilirubin; TC=total cholesterol; TG=triglyceride; UA=uric acid.Table 2. Baseline characteristics of patients with type 2 diabetes mellitus stratified by obesity status in the liver biopsy cohort.
In the VCTE cohort, the overall prevalence of MASLD, MASLD with clinically significant fibrosis, advanced fibrosis, and cirrhosis in T2DM patients was 59.7%, 13.0%, 6.8%, and 3.1%, respectively (Figure 1A). Obese patients with T2DM demonstrated significantly higher prevalence rates across all fibrosis stages compared to non-obese patients with T2DM, with MASLD with clinically significant fibrosis at 26.7% vs. 8.4% (P<0.001) (Figure 1B).
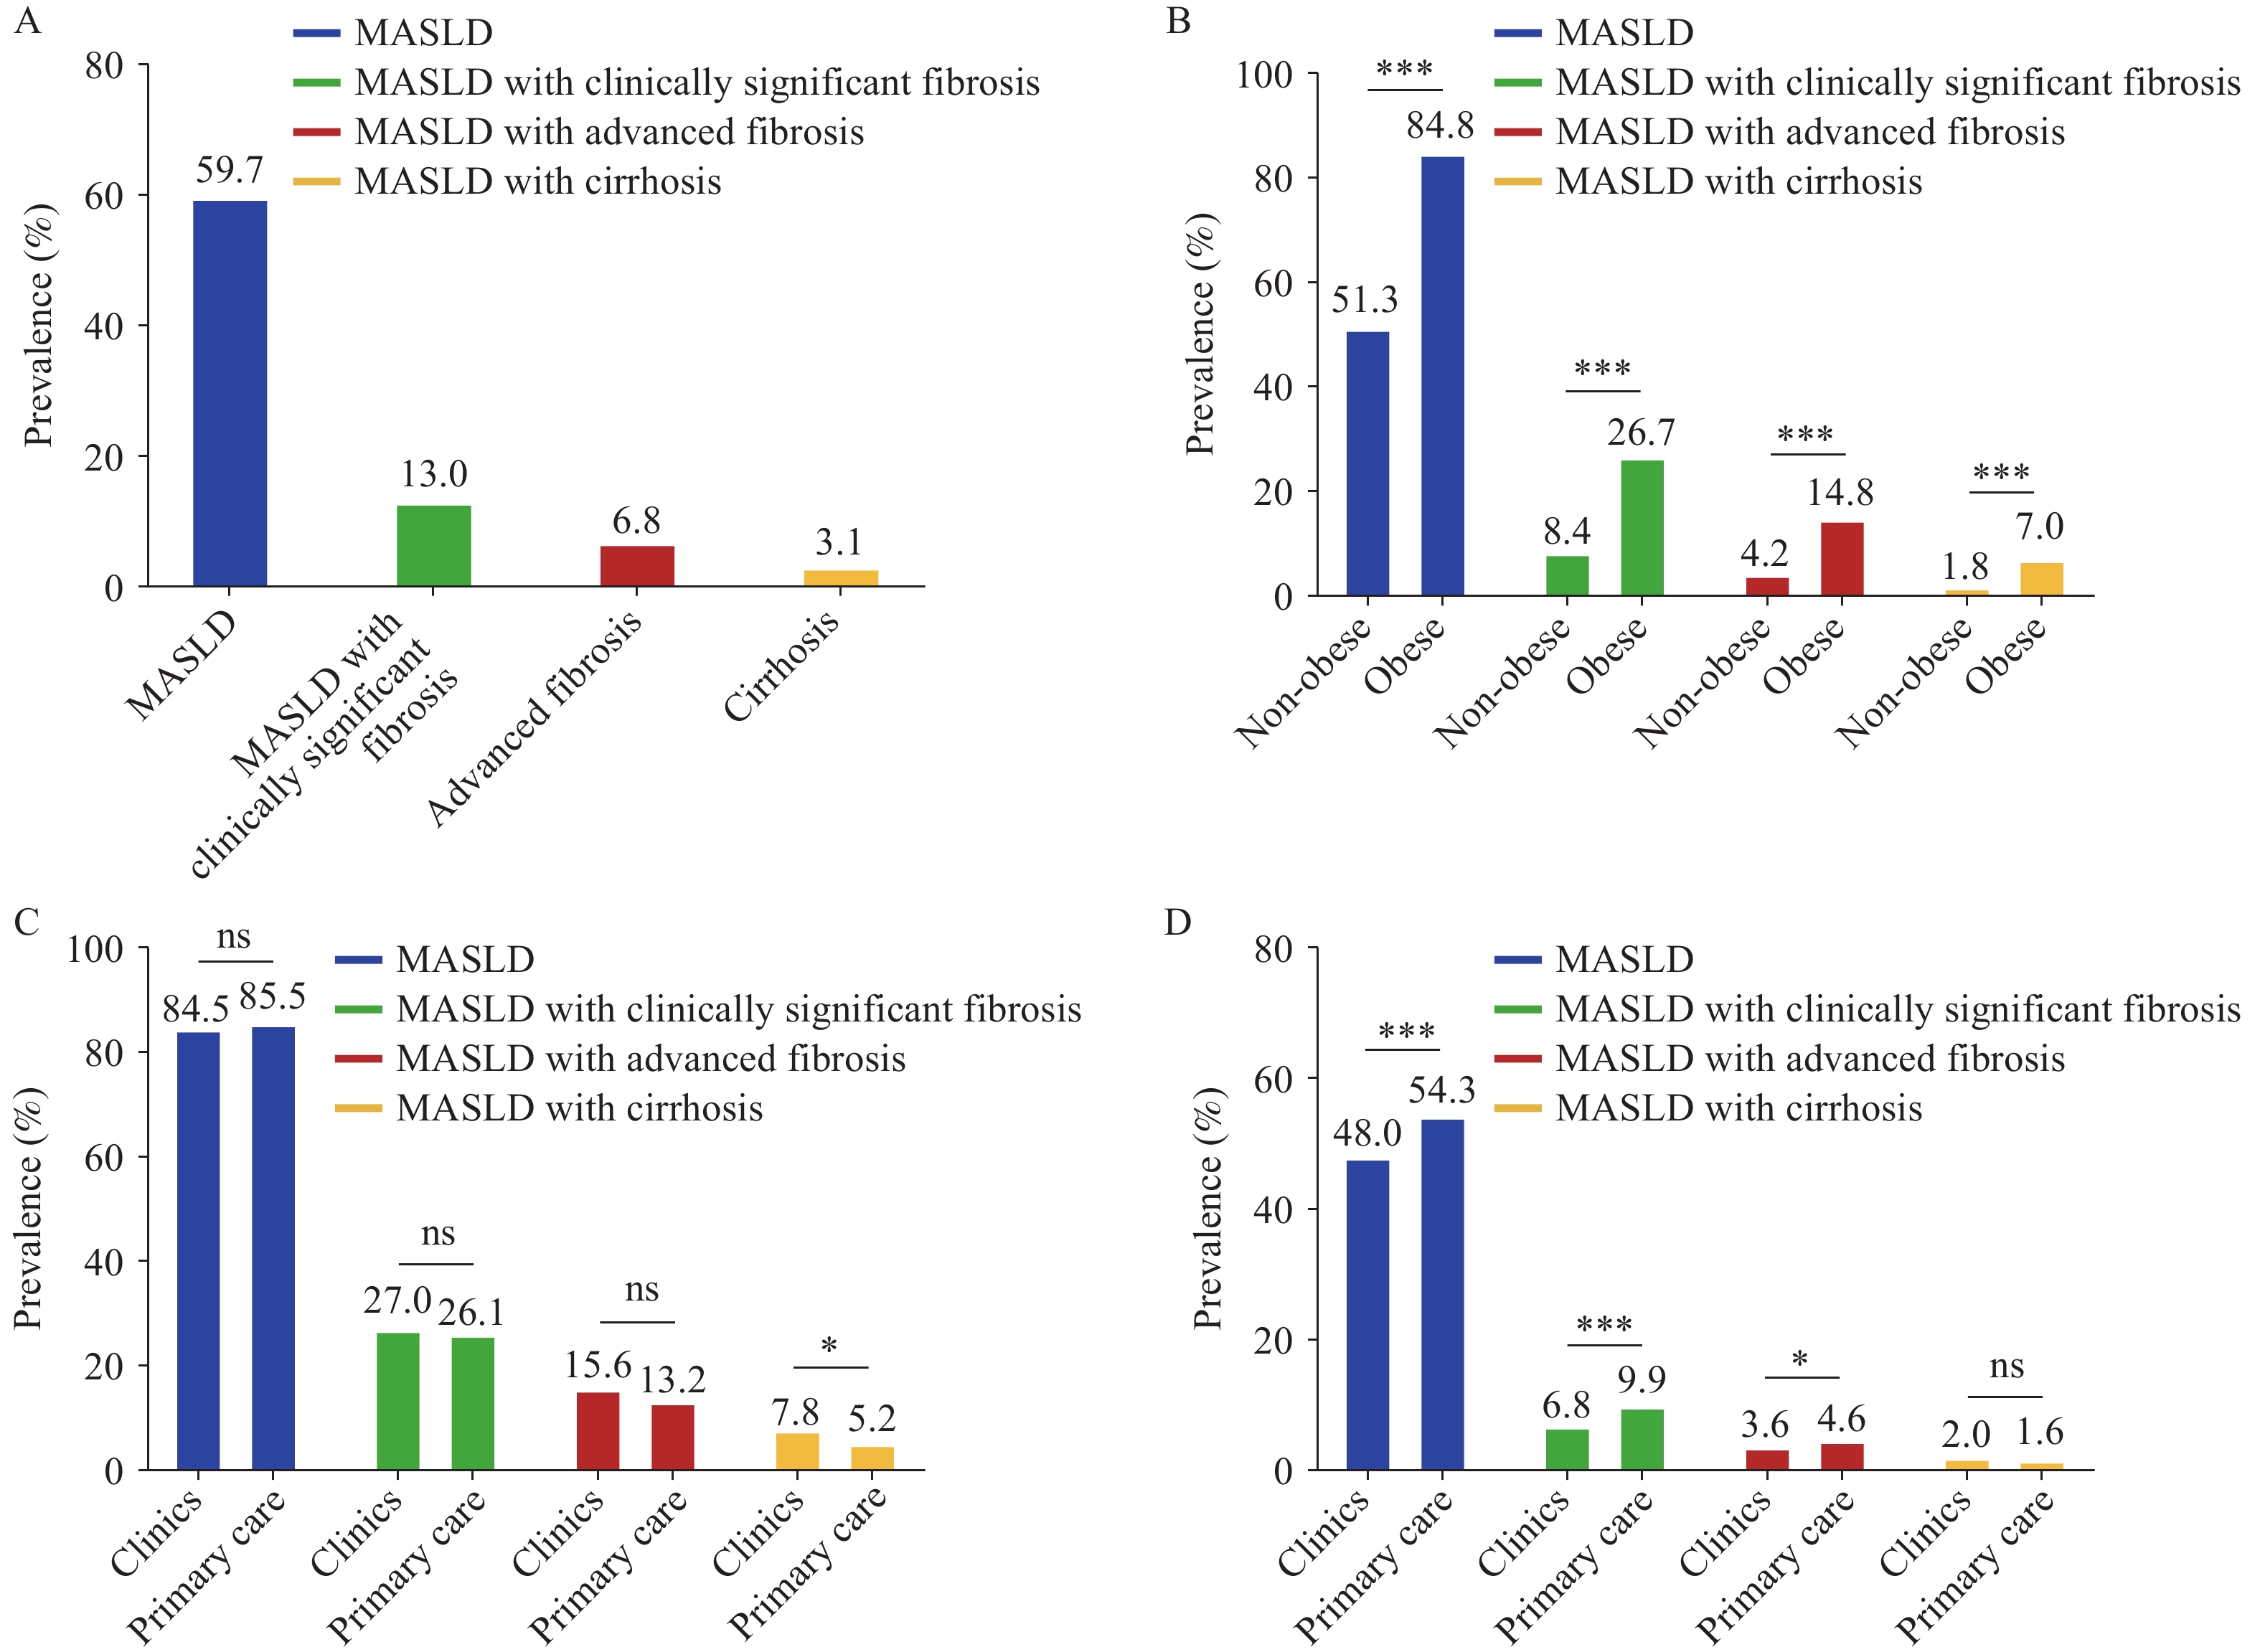 Figure 1.
Prevalence of MASLD and liver fibrosis stages among patients with type 2 diabetes mellitus. (A) Overall prevalence across all patients; (B) Comparison between obese and non-obese patient groups; (C) Comparison within obese patients: clinic-based versus primary care settings; (D) Comparison within non-obese patients: clinic-based versus primary care settings.
* P<0.05; *** P<0.001; ns, not significant.
Abbreviation: MASLD=metabolic dysfunction-associated steatotic liver disease.
The prevalence of MASLD with cirrhosis in obese T2DM patients was higher in clinics than in primary care (Figure 1C). Non-obese T2DM patients in clinics exhibited lower prevalence rates of MASLD, clinically significant fibrosis, and advanced fibrosis compared to those in primary care (Figure 1D). Notably, MASLD and fibrosis prevalence increased progressively with body mass index (BMI), reaching the highest levels in obese patients compared to underweight, normal weight, and overweight groups (
Supplementary Figure S2A ). Moreover, among obese patients, applying different BMI cutoff values to define obesity classes revealed generally similar trends (Supplementary Figure S2B ).Sensitivity analyses using alternative definitions of central obesity yielded results consistent with those based on BMI-defined obesity, confirming higher MASLD and fibrosis prevalence in obese patients with T2DM in the VCTE cohort (
Supplementary Figure S3A–I ). However, no significant difference in the prevalence of MASLD with clinically significant fibrosis was observed between obese and non-obese patients in the liver biopsy cohort (Supplementary Figure S3J–M ).As the number of CMRFs increased, the prevalence of MASLD with clinically significant fibrosis also rose, reaching its peak among patients with five CMRFs (including T2DM) (
Supplementary Figure S3N ). The prevalence in T2DM patients with additional CMRFs was higher than that in those with T2DM alone. In the VCTE cohort, the risk of MASLD with clinically significant fibrosis increased progressively as the number of CMRFs accumulated (Table 3). Among all combinations of T2DM with other CMRFs, T2DM combined with overweight/obesity conferred the highest risk. This association remained statistically significant after adjusting for age and sex.Characteristic VCTE cohort Liver biopsy cohort OR 95% CI P OR 95% CI P Number of CMRF(s) (unadjusted) 1 CMRF (only T2DM) Reference T2DM + Any 1 CMRF 1.87 1.15–3.05 0.012 3.54 1.49–8.44 0.004 T2DM + Any 2 CMRFs 2.46 1.54–3.93 <0.001 2.77 1.18–6.54 0.020 T2DM + Any 3 CMRFs 3.35 2.10–5.34 <0.001 2.67 1.14–6.24 0.023 T2DM + 4 CMRFs 4.19 2.52–6.96 <0.001 2.13 0.85–5.35 0.108 Number of CMRF(s) (age- and sex-adjusted) 1 CMRF (only T2DM) Reference T2DM + Any 1 CMRF 1.87 1.15–3.05 0.012 3.52 1.46–8.46 0.005 T2DM + Any 2 CMRFs 2.44 1.53–3.90 <0.001 2.78 1.17–6.63 0.021 T2DM + Any 3 CMRFs 3.31 2.07–5.27 <0.001 2.77 1.17–6.54 0.020 T2DM + 4 CMRFs 4.09 2.46–6.82 <0.001 2.22 0.87–5.69 0.095 Abbreviation: CI=confidence interval; CMRF=cardiometabolic risk factor; MASLD=metabolic dysfunction-associated steatotic liver disease; OR=odds ratio; T2DM=type 2 diabetes mellitus; VCTE=vibration-controlled transient elastography. Table 3. Logistic regression analyses evaluating associations between cardiometabolic risk factors and MASLD with clinically significant fibrosis in the VCTE and liver biopsy cohorts.
Multivariate logistic regression analysis identified five independent risk factors for MASLD with clinically significant fibrosis: age, waist circumference, alanine aminotransferase (ALT), total bilirubin (TBIL), and triglyceride (TG). Using these variables, we constructed a non-invasive predictive model for risk stratification of MASLD with clinically significant fibrosis in obese patients with T2DM, expressed by the following formula:
Model = −10.983 + 0.025 × Age (years) + 0.074 × waist circumference (cm) + 0.015 × ALT (IU/L) − 0.076 × TBIL (μmol/L) + 0.223 × TG (mmol/L)
The model demonstrated robust discriminatory performance, with an area under the receiver operating characteristic curve of 0.799 (95% CI: 0.767–0.832). A cutoff value of −2.197 achieved ≥95% sensitivity for excluding clinically significant fibrosis, whereas a cutoff of 0.405 achieved ≥95% specificity for confirming clinically significant fibrosis.
-
This large-scale, multicenter prospective study represents the first comprehensive assessment of MASLD with clinically significant fibrosis prevalence and associated risk factors among patients with T2DM in China. Our findings revealed that 59.7% of T2DM patients had MASLD, and 13.0% had clinically significant fibrosis, with the prevalence increasing progressively with rising BMI. Notably, obese patients with T2DM exhibited a substantially higher prevalence of MASLD with clinically significant fibrosis compared to their non-obese counterparts (26.7% vs. 8.4%, P<0.001). Furthermore, the prevalence escalated with accumulating CMRFs, with the combination of T2DM and overweight/obesity conferring the greatest risk. Additionally, our non-invasive predictive model incorporating age, waist circumference, ALT, TBIL, and TG demonstrated robust diagnostic performance for identifying clinically significant fibrosis.
Our previous research characterized the bidirectional relationship between T2DM and MASLD (5). Younossi et al. (6) reported pooled all-cause and liver-specific mortality rates of 16.79 and 2.15 per 1,000 person-years, respectively, among MASLD patients with T2DM. In comparison, our study identified a MASLD prevalence of 59.7% in T2DM patients, slightly lower than the 65.04% reported by a recent meta-analysis (7). These discrepancies likely reflect variations in diagnostic methodologies, population demographics, and study inclusion criteria. Specifically, differences in imaging modalities (ultrasound versus VCTE), ethnic composition, and metabolic disease severity across cohorts may contribute to the observed variations. Nevertheless, the prevalence remains substantial, underscoring the critical need for systematic liver disease screening in this high-risk population.
MASLD with clinically significant fibrosis represents a pivotal disease stage associated with elevated risks of cirrhosis, hepatocellular carcinoma, and liver-related mortality (2). The recent ADA consensus report recommended routine assessment for MASLD and liver fibrosis in T2DM patients with obesity (2). In our cohort, the prevalence of MASLD with clinically significant fibrosis was 13.0% among all T2DM patients and 26.7% among those with obesity, highlighting the strong association between adiposity and hepatic fibrosis progression. By comparison, Cho et al. (7) reported a higher prevalence of 35.54%. This discrepancy likely reflects the more severe disease spectrum in meta-analyses that predominantly included patients referred for specialist evaluation rather than population-based cohorts. Our findings emphasize that obesity, regardless of the anthropometric measurement used, substantially increases the burden of clinically significant fibrosis in T2DM patients.
Obesity serves as a critical driver of liver disease progression in patients with T2DM and MASLD (8). Our sensitivity analyses employing multiple obesity definitions, including BMI, waist circumference, waist-hip ratio, and waist-height ratio, revealed varying prevalence estimates of MASLD with clinically significant fibrosis, ranging from 14.4% to 26.7% in the VCTE cohort and from 29.6% to 49.4% in the liver biopsy cohort. These findings underscore the substantial liver disease burden associated with excess adiposity, regardless of the anthropometric measurement used. Moreover, they suggest that simple anthropometric indices beyond BMI may offer additional insights into metabolic risk and fibrosis burden in patients with T2DM and obesity (9).
CMRFs, such as hypertension, dyslipidemia, and obesity, demonstrated strong associations with MASLD with clinically significant fibrosis (3,10). The prevalence of clinically significant fibrosis increased progressively with the accumulation of CMRFs, even after adjusting for age and sex, suggesting additive or potentially synergistic effects. Notably, the combination of T2DM with overweight or obesity conferred the highest risk among all CMRF combinations, emphasizing the interconnected pathophysiology of metabolic dysfunction and liver disease. Furthermore, sex, waist circumference, AST, ALB, TBIL, and HbA1c emerged as independent risk factors for clinically significant fibrosis, with restricted cubic spline analyses revealing non-linear associations with liver fibrosis risk.
This study demonstrates several notable strengths. First, it represents one of the largest multicenter prospective investigations assessing the prevalence of MASLD with clinically significant fibrosis in Chinese patients with T2DM, thereby providing robust and generalizable estimates. Second, we employed both VCTE, a widely validated non-invasive assessment tool, and liver biopsy, the gold standard for fibrosis diagnosis, thereby minimizing diagnostic misclassification. Third, we conducted comprehensive sensitivity analyses using multiple obesity definitions to validate the consistency of our findings across different anthropometric measures. Finally, we developed a novel non-invasive model that may facilitate risk stratification for clinically significant fibrosis in this high-risk population.
However, several limitations warrant consideration. First, blood sample data were incomplete for some patients, and information on medication use (e.g., antidiabetic, lipid-lowering, or hepatoprotective agents) was unavailable, potentially introducing residual confounding. Additionally, incomplete laboratory data may have modestly reduced the accuracy and generalizability of our prediction model. Future studies incorporating more comprehensive data collection are needed to validate our findings. Second, VCTE accuracy may be compromised in patients with severe obesity, potentially introducing measurement bias in LSM values. Nevertheless, our subgroup analysis stratified by BMI demonstrated generally consistent results across obesity categories. Finally, the cross-sectional design precludes causal inference regarding the observed associations between metabolic variables and liver fibrosis. Longitudinal studies are warranted to establish temporal relationships and validate the proposed risk stratification model.
In conclusion, our study demonstrates a high prevalence of MASLD with clinically significant fibrosis among T2DM patients, particularly those with obesity and multiple CMRFs. These findings underscore the critical importance of routine liver fibrosis screening and integrated management of metabolic risk factors to mitigate liver-related complications in this high-risk population.
-
The authors gratefully acknowledge all participating patients, the Liver Health Consortium in China (CHESS), and the Co-Management of Diabetes and Liver Diseases Consortium for their invaluable contributions to data collection. We sincerely thank Drs. Yong-Yi Zeng, Xuefeng Li, Pengfei Pang, Wenjing Ni, Airong Hu, Yiling Li, Wei Gou, Qing-Lei Zeng, Huapeng Lin, Jiaojian Lv, Shanghao Liu, Yinqiu Zhang, Qingyi Tian, Mingxing Huang, Lan Liu, Qingge Zhang, Huafang Gao, Heng Wan, Yan Wang, Xiaomei, Yuehua Wang, Yusen Zhou, Lan Ma, Jing He, Jingbo Li, Taolong Zhou, Yan Wu, Huili Wu, Xingguo Xiao, Yanhong Liu, Yudong Zhang, Hongliang He, Hao Xie, Fanggang Wu, Hui Shi, Wenjing Liu, Xiantong Zou, Dengxiang Liu, Weimin Jiang, Fengmei Wang, Wenhua Zhang, Xiaoxiong Hu, Wei Yan, Ruiling He, Tong Dang, Jing Du, Huimin Ying, Yuwei Zhang, Jie Li, and Ling Li for their substantial contributions to this study.
-
Conducted in accordance with the ethical principles outlined in the Declaration of Helsinki. The Ethics Committee of Zhongda Hospital, Medical School, Southeast University, approved the study protocol (approval number: 2024ZDSYLL398-P01). All participants provided written informed consent prior to enrollment.
HTML
| Citation: |

|