
 Download:


-
Rabies remains a critical public health concern, with a near-100% fatality rate once the virus infects the central nervous system and clinical symptoms emerge (1). Globally, approximately 59,000 deaths attributable to rabies occur annually (2). During the 1970s–1980s, China experienced several thousand human rabies cases each year, representing a substantial public health burden (3). To combat this threat, China implemented comprehensive control measures in the 20th century, focusing primarily on canine population management. By the late 1990s (1995–1999), annual case counts had declined to approximately 230, nearing levels considered manageable for public health systems (4). However, the epidemic subsequently resurged rapidly, peaking at 3,300 cases in 2007 (3).
Since 2006, the Chinese government has implemented a series of comprehensive prevention and control measures against rabies. These measures include strengthening human rabies surveillance, conducting outbreak containment and source elimination campaigns, and enhancing the management and vaccination of domestic dogs (5). Additionally, China has issued several key technical guidelines, including the Guidelines for the Management of Rabies Exposure Prophylaxis (2006, 2009, and 2023 editions) and the Guidelines for the Diagnosis and Treatment of Rabies (2021 edition) (6). From 2008 to 2023, China achieved 16 consecutive years of declining human rabies incidence, reaching a historic low of 122 cases in 2023 (7) — the lowest level recorded since 1950. However, in 2024, the country reported 167 human rabies cases, representing a 36.9% increase compared to 2023. This resurgence may reflect changes in transmission dynamics, gaps in current control measures, or both.
A systematic analysis of the spatiotemporal heterogeneity of rabies transmission following these epidemiological changes is urgently needed to identify current gaps in rabies control. This study employs spatial autocorrelation analysis and spatiotemporal scan statistics on national rabies surveillance data (2005–2024) to: 1) characterize spatiotemporal evolution patterns over two decades; 2) identify high-risk space-time clusters; and 3) pinpoint vulnerable areas requiring strengthened interventions. These findings will provide critical evidence to support China’s goal of eliminating dog-mediated human rabies by 2030.
-
National rabies surveillance data for laboratory-confirmed and clinically diagnosed human cases from 2005 to 2024 were obtained from the China CDC Information System, encompassing 31 provincial-level administrative divisions (PLADs) in China. Each case record included the date of symptom onset and the patient’s residential address at the county level.
-
We employed descriptive epidemiological methods to systematically characterize the temporal, spatial, and demographic patterns of rabies cases in China. Temporal trends were visualized through annual incidence curves. Spatial analysis comprised three components: 1) Calculation of global and local Moran’s I indices to identify statistically significant (P<0.05) spatial clusters (hotspots and coldspots). 2) Retrospective space-time scan analysis using SaTScan v9.3, applying a discrete Poisson model to monthly case data (2005–2024). The circular scanning window was configured with a maximum spatial cluster radius of 500 km, and cluster significance was assessed through 999 Monte Carlo simulations (8). 3) Spatial frequency analysis, in which each county was assigned an occurrence score based on the number of years (out of 20 total study years) in which at least one case was reported, yielding scores ranging from 0 to 20. Counties with scores exceeding 10 (indicating case reports in more than half of the study period) were classified as high-frequency counties. All statistical analyses were performed using R software (version 4.3.2; R Foundation for Statistical Computing, Vienna, Austria), with a significance threshold of α=0.05.
-
Between 2005 and 2024, China reported 24,746 human rabies cases. The epidemic reached its peak in 2007 with 3,300 cases, followed by a rapid decline from 2008 through 2019. During 2020–2023, the rate of decline decelerated substantially, reaching a historic low of 122 cases in 2023 — the lowest annual incidence recorded since 1950. However, 2024 witnessed 167 reported cases, marking a 36.9% increase compared to the previous year. This represented the first resurgence following 16 consecutive years of decline, though case numbers remained considerably lower than those observed during 2005–2019 (Figure 1).
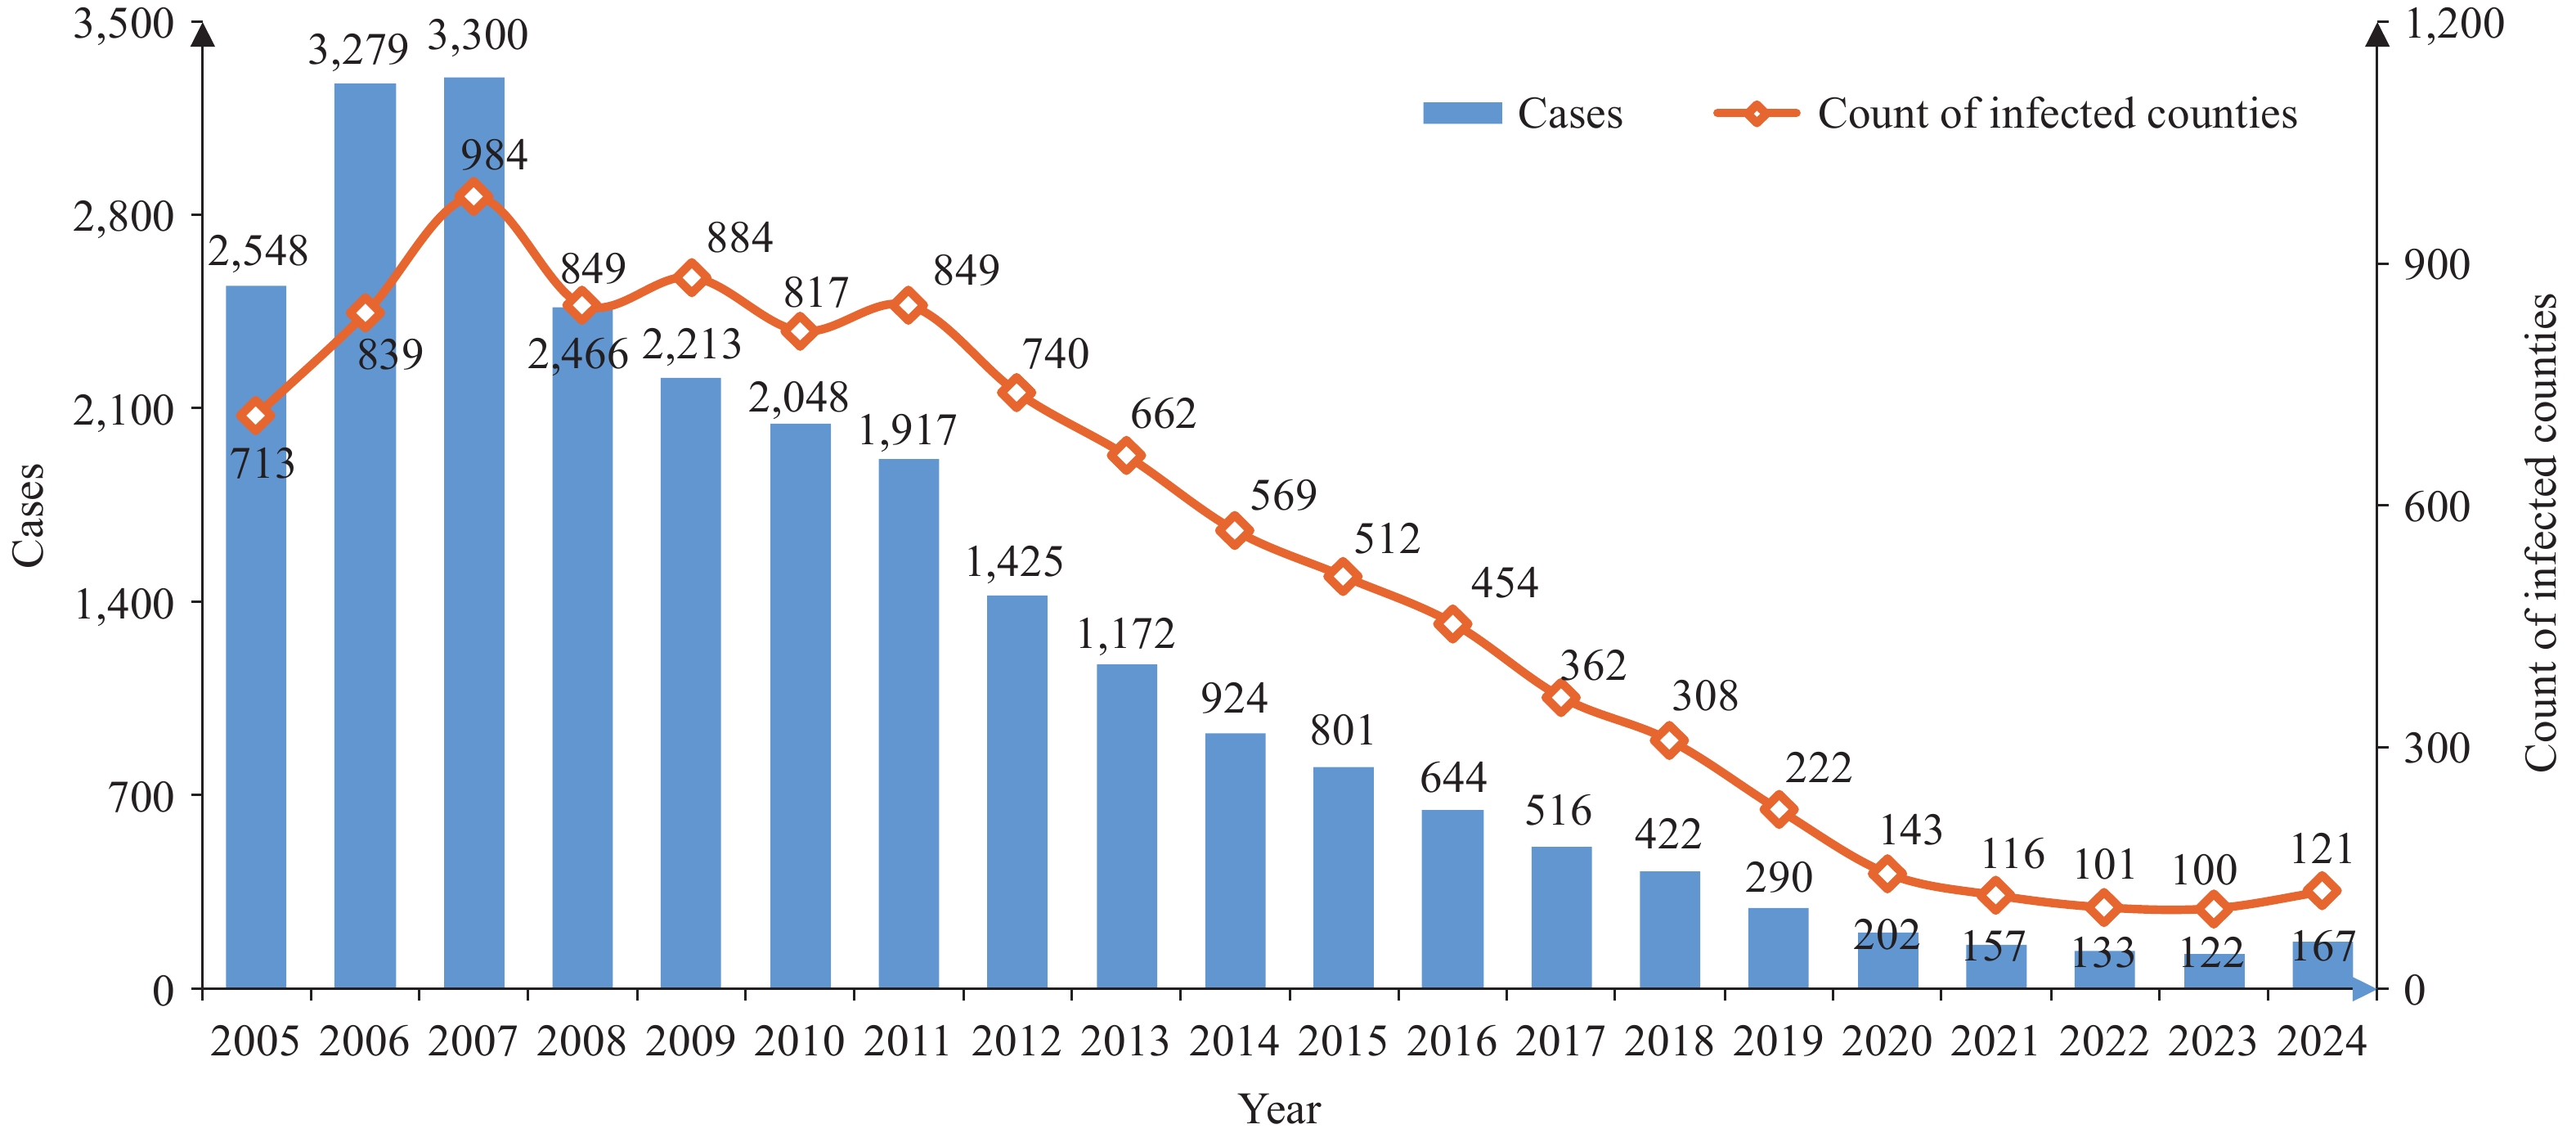 Figure 1.
Time-series analyses of human rabies in China, 2005–2024.
-
The 167 human rabies cases reported in 2024 were distributed across 122 counties in 20 PLADs. Six PLADs accounted for 76.0% of all cases: Henan (49 cases), Guangxi (22 cases), Hunan (19 cases), Hubei (13 cases), Anhui (12 cases), and Jiangsu (12 cases). At the county level, 91 counties (74.5%) reported a single case, while 23 counties (18.8%) reported 2 cases. Additionally, 4 counties reported 3 cases, 3 counties reported 4 cases, and 1 county reported 5 cases. These higher-incidence counties were primarily located in Henan (5 counties), Guangxi (2 counties), and Hubei (1 county).
-
Henan demonstrated the highest absolute increase (14 additional cases) and the greatest number of affected counties [27 total reporting counties, with 18 (66.7%) showing rising case numbers]. Other PLADs with notable increases included Guangxi (5 counties, +11 cases), Jiangsu (5 counties, +7 cases), Hubei (3 counties, +7 cases), and Guizhou (5 counties, +6 cases). Five counties reported their first cases since 2005: Shenzhou (Hebei), Siyang (Jiangsu), Cixi (Zhejiang), Shilong (Henan), and Baojing (Hunan) (Table 1).
PLADs Reported cases (n) Number of counties reporting cases (n) 2023 2024 Increased 2023 2024 Increased Henan 35 49 14 26 27 1 Guangxi 11 22 11 10 15 5 Jiangsu 5 12 7 5 10 5 Hubei 6 13 7 6 9 3 Guizhou 3 9 6 3 8 5 Hunan 16 19 3 13 16 3 Anhui 9 12 3 8 9 1 Shanxi 2 5 3 1 4 3 Hebei 1 3 2 1 3 2 Shanghai 0 1 1 0 1 1 Fujian 0 1 1 0 1 1 Hainan 0 1 1 0 1 1 Sichuan 4 4 0 4 4 0 Zhejiang 3 3 0 3 3 0 Shandong 3 3 0 3 2 −1 Yunnan 2 1 −1 2 1 −1 Jiangxi 7 5 −2 7 4 −3 Chongqing 4 1 −3 3 1 −2 Guangdong 6 2 −4 5 2 −3 Shaanxi 5 1 −4 2 1 −1 Total 122 167 45 102 122 20 Abbreviation: PLADs=provincial-level administrative divisions. Table 1. Distribution of human rabies cases in China, 2023–2024.
-
We conducted global and local spatial clustering analyses on five-year average incidence rates of human rabies in China from 2005 to 2024. Global spatial autocorrelation: Across all study periods (2005–2009, 2010–2014, 2015–2019, and 2020–2024), Moran’s I values exceeded zero with P<0.05, demonstrating statistically significant spatial clustering and positive spatial autocorrelation in disease distribution patterns.
-
During 2005–2009, we identified 130 high-high cluster counties, primarily concentrated in Guangxi, Guangdong, Guizhou, Hunan, Chongqing, and Sichuan. In 2010–2014, 111 high-high cluster counties were distributed across Guangxi, Guangdong, Hunan, Guizhou, Hainan, Jiangsu, Chongqing, and Yunnan. The 2015–2019 period revealed 59 high-high cluster counties spanning Hunan, Guangxi, Guangdong, Chongqing, Sichuan, Guizhou, Henan, Hubei, Jiangsu, Anhui, Shandong, and Yunnan. Most recently, during 2020–2024, 32 high-high cluster counties were concentrated in Hunan, Henan, Guangxi, Anhui, and Hubei. The number of high-high cluster counties declined progressively throughout the study period. Notably, while the absolute number of cluster counties decreased, the geographic distribution of affected PLADs initially broadened from 2005 through 2019, incorporating additional central and eastern PLADs, before subsequently contracting to a more focused regional pattern after 2019 (Table 2).
Time Global spatial autocorrelation Local spatial autocorrelation Moran’s I P High-high clusters High-low clusters Low-high clusters Low-low clusters 2005–2009 0.519 <0.05 130 0 31 27 2010–2014 0.431 <0.05 111 3 41 25 2015–2019 0.294 <0.05 59 4 28 52 2020–2024 0.331 <0.05 32 3 10 58 Table 2. Spatial autocorrelation analysis of rabies cases in China (County level), 2005–2024.
-
Retrospective spatiotemporal scan analysis identified seven statistically significant rabies transmission clusters: one primary cluster and six secondary clusters (Table 3). The primary cluster occurred from September to November 2006, spanning the border regions of Guangxi, Hunan, Guizhou, and Guangdong PLADs. Six secondary clusters emerged sequentially across different geographic areas and time periods: August–October 2006 (Henan, Anhui, Hubei, and adjacent PLADs); August–October 2007 (Sichuan-Chongqing-Shaanxi-Hubei border region); July–September 2007 (Hebei-Shandong-Tianjin); July–September 2010 (Yunnan Province exclusively); July–September 2011 (Shanxi-Shaanxi border); and December 2013–January 2014 (Shanxi-Inner Mongolia-Hebei-Shaanxi).
Cluster type n Location PLADs Time Observed/Expected Primary cluster 291 Guangxi (108), Hunan (74), Guizhou (69),
Guangdong (37), Chongqing (2), Yunnan (1)September 1, 2006 to November 30, 2006 477.0/37.6
(Ratio: 12.68)Secondary cluster-1 155 Sichuan (90), Chongqing (34), Shaanxi (24),
Hubei (4), Gansu (3)August 1, 2007 to October 31, 2007 182.0/27.7
(Ratio: 6.56)Secondary cluster-2 549 Henan (143), Anhui (93), Hubei (91),
Jiangsu (74), Jiangxi (54), Shandong (38),
Hunan (37), Zhejiang (16), Shanxi (3)August 1, 2006 to October 31, 2006 297.0/97.9
(Ratio: 3.03)Secondary cluster-3 41 Shanxi (23), Shaanxi (16), Hunan (2) July 1, 2011 to September 30, 2011 38.0/4.3
(Ratio: 8.74)Secondary cluster-4 102 Hebei (77), Shandong (16), Tianjin (9) July 1, 2007 to September 30, 2007 64.0/14.2
(Ratio: 4.50)Secondary cluster-5 67 Shanxi (61), Shaanxi (3), Inner Mongolia (2),
Hebei (1)December 1, 2013 to January 31, 2014 29.0/3.6
(Ratio: 8.06)Secondary cluster-6 81 Yunnan (81) July 1, 2010 to September 30, 2010 39.0/8.1
(Ratio: 4.83)Abbreviation: PLADs=provincial-level administrative divisions. Table 3. Retrospective space-time scan analysis of rabies cases in China, 2005–2024.
These clusters demonstrated distinct spatiotemporal aggregation patterns. Five of the seven clusters exhibited marked seasonal concentration during late summer and early autumn (July–October). Geographically, transmission showed a pronounced preference for interprovincial border zones, with the primary cluster and five secondary clusters positioned at multi-PLAD junctions. Temporally, outbreaks manifested across different years (2006, 2007, 2010, 2011, 2013–2014) without recurring annually in identical locations, indicating dynamically shifting epidemic foci. The analysis also revealed substantial variation in outbreak scale, exemplified by the geographically confined, single-province cluster in Yunnan (2010). Notably, the December 2013–January 2014 cluster represented an atypical winter occurrence, deviating from the predominant summer-autumn pattern.
In summary, rabies transmission exhibited spatiotemporal clustering characterized predominantly by summer-autumn peaks concentrated in interprovincial border regions. This pattern was accompanied by additional complexities, including interannual variation in outbreak timing and location, geographically localized transmission events, and occasional atypical seasonal occurrences.
-
We conducted spatial frequency analysis at the county level to identify areas with persistent rabies transmission throughout the study period. Between 2005 and 2024, we identified 352 high-frequency counties (defined as reporting cases in ≥10 years over the 20-year period) in China, predominantly concentrated in central and southern regions. The five PLADs with the greatest number of high-frequency counties were Guangxi (53 counties), Hunan (39 counties), Guizhou (35 counties), Guangdong (33 counties), and Henan (32 counties) (Table 4). Individual counties demonstrating the highest case frequencies included Sheqi County in Henan Province (20 cases), Dongxing City in Guangxi (19 cases), Zixing City in Hunan (19 cases), Dongkou County in Hunan (18 cases), and Shangcheng County in Henan (18 cases).
PLADs Number of high-frequency districts/counties (n) Guangxi 53 Hunan 39 Guizhou 35 Guangdong 33 Henan 32 Hubei 23 Jiangsu 22 Sichuan 19 Anhui 19 Shandong 14 Yunnan 12 Jiangxi 12 Chongqing 11 Zhejiang 9 Hebei 5 Shanxi 4 Hainan 3 Shaanxi 2 Inner Mongolia 2 Shanghai 1 Heilongjiang 1 Fujian 1 Total 352 Abbreviation: PLADs=provincial-level administrative divisions. Table 4. Occurrence frequency of human rabies in China, 2005–2024.
-
Between 2005 and 2024, reported human rabies cases in China ranged from neonates (less than 1 month old) to elderly individuals aged 96 years. Age distribution analysis demonstrated that the 41–70 year age group accounted for the highest proportion of cases (53.8%), followed by individuals aged 6–20 years (14.9%). Gender analysis revealed 17,317 male cases and 7,429 female cases, corresponding to a male-to-female ratio of 2.3∶1. Occupational stratification identified farmers as the most heavily affected group, representing 68.6% of all cases, while students and children constituted the second-largest demographic category (Table 5).
Group division Human rabies
cases (n)Proportion
(%)Gender Male 17,317 70.0 Female 7,429 30.0 Age (years) 0–5 1,503 6.1 6–20 3,684 14.9 21–40 3,426 13.8 41–70 13,302 53.8 71 and older 2,831 11.4 Occupation Farmer 16,983 68.6 Student 3,004 12.1 Children living at home 1,617 6.5 Unemployed 780 3.2 Other 2,362 9.6 Table 5. Demographic characteristics of human rabies cases in China, 2005–2024.
-
From 2005 to 2024, China’s rabies epidemic demonstrated a biphasic trajectory characterized by an initial peak in 2007, followed by 16 consecutive years of decline through 2023, and a subsequent resurgence in 2024. Despite this recent increase, 2024 case numbers remained substantially lower than those recorded during 2005–2019. This sustained reduction demonstrates the effectiveness of China’s comprehensive prevention and control strategy implemented since 2006, which prioritized strengthening human rabies surveillance, conducting epidemic containment and source elimination, and enhancing dog management and vaccination (5). Analysis of 2024 cases revealed that only 4.1% of affected counties (5 counties, 6 cases) reported their first cases in two decades, whereas 95.9% represented recurrences in historically endemic areas. This distribution pattern suggests that the recent increase represents localized resurgence within established hotspots rather than geographic expansion of transmission.
Spatial autocorrelation analysis demonstrated a distinct northward shift in China’s rabies high-risk core areas over the past two decades. The most recent five-year period (2020–2024) showed concentration primarily in interprovincial border regions of Henan, Hunan, Guangxi, Hubei, and Anhui. Although annual case counts in all high-incidence PLADs have decreased significantly from peak levels, and spatiotemporal scanning detected no new disease clusters emerging after 2014, this geographic transition of high-risk zones principally reflects regional variations in the pace of epidemic decline. The current high-risk core areas represent regions where case reduction has progressed more slowly during the recent five-year period.
Spatial occurrence frequency analysis identified persistent high-incidence counties with consistent case detection throughout the 20-year surveillance period. These endemic hotspots were predominantly concentrated in central and southern China, particularly in Guangxi, Hunan, Guizhou, Guangdong, Henan, Hubei, and Jiangsu — geographic distributions that aligned precisely with hotspot regions identified through spatial autocorrelation analysis. Notably, 50.8% of counties reporting more than one case in 2024 were these historically high-frequency zones. Despite China’s overall transition to low sporadic transmission, these areas continue to face substantial challenges, including: 1) inadequate canine rabies control, 2) sustained high transmission risks, and 3) particular difficulties for elimination efforts. These counties, therefore, represent priority targets for intensified, tailored interventions.
Scattered high-frequency counties were also identified in historically low-incidence PLADs including Hainan, Inner Mongolia, Shaanxi, Heilongjiang, Fujian, and Shanghai. This distribution suggests persistent viral circulation among reservoir animals in these regions. The low human case numbers in these areas may reflect effective post-exposure prophylaxis (PEP) coverage protecting exposed individuals, though further investigation is needed to confirm this hypothesis and identify other contributing factors.
Demographic analysis demonstrates that farmers continue to bear the greatest burden of human rabies in China, consistent with established research findings (9). This disproportionate vulnerability arises from interconnected challenges in rural settings, including inadequate canine population management with suboptimal vaccination coverage, limited community awareness of rabies prevention measures, and insufficient uptake of PEP services (10). Our investigation identified geographically concentrated hotspots that persistently report elevated case numbers and frequencies despite overall declining trends in surrounding rural areas. These persistent transmission zones appear to reflect multiple contributing factors, including sustained rabies virus circulation among local dog populations, culturally rooted practices that increase human-animal contact, and structural barriers that limit timely access to PEP services due to either geographic availability or financial constraints. The persistence of these well-defined hotspots underscores the critical need for comprehensive field studies to elucidate the complex interplay of biological, behavioral, and health system factors that sustain rabies transmission in these specific localities.
This study documents China’s epidemiological transition in human rabies from relatively widespread regional endemicity to a pattern of highly sporadic occurrence with localized clustering. The current risk profile demonstrates concentrated transmission within previously identified High-High clusters, particularly in persistent high-incidence counties showing notable case resurgence — these areas represent critical intervention targets. These findings support the implementation of refined prevention strategies focused on high-risk areas through: comprehensive investigation of the root causes of persistent transmission; implementation of geographically tailored control measures using a “one-county-one-policy” framework; and development of precision interventions that address distinct local risk factors. This approach recognizes the necessity of moving beyond uniform national strategies to address the evolving, heterogeneous nature of rabies distribution across China’s diverse epidemiological landscape.
This study was subject to some limitations: Our reliance on human rabies surveillance data alone represents a significant limitation, as this approach cannot fully capture actual transmission risks without incorporating data from the critical animal reservoir component. A more comprehensive risk assessment would require an integrated analysis combining human case data with systematic animal rabies monitoring to accurately evaluate regional control progress and transmission dynamics. Future investigations should integrate data on canine vaccination coverage with the spatial and temporal incidence of canine rabies to provide a complete epidemiological picture. This integrated approach is essential for developing robust transmission dynamics models that can accurately identify and characterize transmission hotspots, thereby informing more effective control strategies.
HTML
Data Sources
Statistical Methods
Epidemiological Overview
Human Rabies Distribution in 2024
Year-on-Year Comparison (2023–2024)
Spatial Autocorrelation Analysis
Local Spatial Autocorrelation
Spatiotemporal Clustering Analysis
Spatial Occurrence Frequency Analysis
Demographic Characteristics of Human Rabies Cases
| Citation: |

|