
 Download:


-
Introduction: Premature depletion of hyperopic reserve has been demonstrated to associate with subsequent myopia development. However, the relationship between screen use and insufficient hyperopic reserve (defined as spherical equivalent refraction below age-specific thresholds) remains unclear, and regional heterogeneity in this association warrants investigation.
Methods: This cross-sectional study (2020–2024) included 28,993 children from 9 provincial-level administrative divisions (PLADs). We assessed associations between screen exposure (time and habits) and hyperopic reserve status. Multivariable logistic regression analyses were conducted with stratified analyses based on regional gross domestic product (GDP) levels.
Results: Among screened children, 49.0% exhibited insufficient hyperopic reserve. High screen time [odds ratio (OR)=1.21, 95% confidence interval (95% CI): 1.14, 1.29] and poor screen habits (OR=1.19, 95% CI: 1.12, 1.27) were independently associated with insufficient hyperopic reserve. Low-GDP regions demonstrated significantly higher detection rates among children aged 6–9 years, whereas high-GDP regions showed accelerated increases in detection rates after age 11. Low-GDP regions exhibited heightened risks for both high screen time and poor screen habits, with this association most pronounced among girls in low-GDP areas.
Conclusions: Screen exposure associates with insufficient hyperopic reserve, exhibiting notable regional and gender differences. High screen time and poor screen habits represent key risk factors for insufficient hyperopic reserve, particularly among girls residing in low-GDP areas.
-
The high prevalence of myopia and its associated irreversible ocular complications underscore the urgent need for early prevention and control measures (1). As a core indicator of refractive development, premature depletion of hyperopic reserve has been demonstrated to associate with subsequent myopia development, highlighting its critical role in early refractive management (2). Epidemiological studies suggest that factors including prolonged electronic screen exposure and sustained near-work patterns may accelerate hyperopic reserve depletion through mechanisms such as light bio-regulation and retinal defocus (3). However, this association exhibits significant regional variation. Research indicates that these differences may relate to economic development levels (4). This study systematically analyzes regional heterogeneity in screen use and insufficient hyperopic reserve among school-aged children aged 6–12 years, using nationwide multi-center epidemiological data to provide evidence-based support for developing targeted myopia prevention and control strategies across different regions.
The National Disease Control and Prevention Administration of China coordinated a cross-sectional survey of nationwide hyperopic reserves across 10 provincial-level administrative divisions (PLADs) between November 2020 and July 2024. Students from senior kindergarten through high school were selected using multistage cluster sampling at each site. This study analyzed data from 9 PLADs (Liaoning, Beijing, Zhejiang, Guangdong, Henan, Hunan, Shanxi, Shaanxi, and Chongqing) after excluding Shandong Province due to insufficient sample size. The Beijing Center for Disease Control and Prevention developed a standardized questionnaire to collect demographic characteristics, genetic factors, environmental exposures, and visual behaviors. Of 67,260 questionnaires distributed to students from senior kindergarten through high school, 28,993 valid responses were obtained from primary school students aged 6–12 years. Professional institutions conducted comprehensive ophthalmic examinations including cycloplegic refraction, axial length, and corneal curvature measurements. All participants underwent slit-lamp examination to rule out contraindications before testing, and certified optometrists performed all subsequent measurements (5).
Hyperopic reserve was defined as spherical equivalent refraction relative to age-specific normative ranges, with values below the lower limit classified as insufficient hyperopic reserve (6). Daily screen time was calculated by summing average hours spent on computers, television, and mobile devices. Screen habits were assessed through questionnaire responses regarding use in direct sunlight, dim surroundings, lying or prone posture, and while walking or riding. A composite screen habits score was constructed by summing frequency ratings for these behaviors, with higher scores indicating more frequent high-risk screen use. Both screen time and screen habits scores were categorized into low, medium, and high tertiles based on sample distribution.
To compare groups with and without insufficient hyperopic reserve, we used the Wilcoxon rank-sum test for continuous variables and Pearson’s chi-squared test for categorical variables. We employed multivariable logistic regression models to assess associations between screen time and screen habits with insufficient hyperopic reserve, adjusting for key covariates including age, sex, ethnicity, body mass index (BMI), region, grade level, parental education level, and parental myopia status. Statistical significance was set at a two-sided P<0.05. All analyses were performed using R Statistical Software (version 4.3.1; R Core Team, R Foundation for Statistical Computing, Vienna, Austria).
This study analyzed data from 28,993 participants, of whom 14,507 exhibited insufficient hyperopic reserve. As demonstrated in Table 1, participants with insufficient hyperopic reserve were significantly more likely to display several key characteristics: enrollment in upper primary grades, female gender, obesity, residence in low-GDP regions, and parental myopia history.
Characteristic Overall (n=28,993) Insufficient hyperopic reserve No (n=14,458) Yes (n=14,535) P* Age [median (IQR)] 8.00 (7.00, 9.00) 7.00 (6.00, 9.00) 8.00 (7.00, 9.00) <0.001 Gender [n (%)] 0.005 Male 14,886 (51.34) 7,544 (52.18) 7,342 (50.51) Female 14,107 (48.66) 6,914 (47.82) 7,193 (49.49) Ethnicity [n (%)] 0.694 Han 27,466 (94.73) 13,704 (94.78) 13,762 (94.68) Other 1,527 (5.27) 754 (5.22) 773 (5.32) BMI [n (%)] <0.001 Normal 19,360 (66.77) 9,873 (68.29) 9,487 (65.27) Overweight 4,529 (15.62) 2,255 (15.60) 2,274 (15.64) Obesity 5,104 (17.60) 2,330 (16.12) 2,774 (19.08) Grade [n (%)] <0.001 Elementary school lower grades (1–3) 21,390 (73.78) 11,640 (80.51) 9,750 (67.08) Elementary school upper grades (4–6) 7,603 (26.22) 2,818 (19.49) 4,785 (32.92) GDP region [n (%)] <0.001 Low GDP 16,016 (55.24) 7,660 (52.98) 8,356 (57.49) High GDP 12,977 (44.76) 6,798 (47.02) 6,179 (42.51) Father’s education level [n (%)] 0.010 Junior high school and below 6,149 (21.21) 3,161 (21.86) 2,988 (20.56) High school or vocational school 9,217 (31.79) 4,508 (31.18) 4,709 (32.40) College and above 13,627 (47.00) 6,789 (46.96) 6,838 (47.05) Mother’s education level [n (%)] 0.036 Junior high school and below 5,824 (20.09) 2,983 (20.63) 2,841 (19.55) High school or vocational school 8,794 (30.33) 4,313 (29.83) 4,481 (30.83) College and above 14,375 (49.58) 7,162 (49.54) 7,213 (49.63) Parental myopia status [n (%)] <0.001 Neither parent myopic 12,982 (44.78) 7,240 (50.08) 5,742 (39.50) Only the father is myopic 4,288 (14.79) 2,079 (14.38) 2,209 (15.20) Only the mother is myopic 6,537 (22.55) 3,089 (21.37) 3,448 (23.72) Both parents are myopic 5,186 (17.89) 2,050 (14.18) 3,136 (21.58) Screen time [n (%)] <0.001 Low 9,240 (31.87) 4,907 (33.94) 4,333 (29.81) Medium 12,299 (42.42) 6,154 (42.56) 6,145 (42.28) High 7,454 (25.71) 3,397 (23.50) 4,057 (27.91) Screen habits score [n (%)] <0.001 Low 7,418 (25.59) 3,951 (27.33) 3,467 (23.85) Medium 11,973 (41.30) 6,090 (42.12) 5,883 (40.47) High 9,602 (33.12) 4,417 (30.55) 5,185 (35.67) Note: Screen time represents the sum of average daily hours spent on computers, television, and mobile devices; Screen habits score represents the sum of frequency ratings for use in direct sunlight, dim surroundings, lying/prone posture, and while walking or riding; higher scores indicate more frequent high-risk usage patterns; both variables were categorized into sample-based low/medium/high tertiles.
Abbreviation: BMI=body mass index; GDP=gross domestic product; IQR=interquartile range; n (%)=number (percentage).
* To compare groups with and without insufficient hyperopic reserve, the Wilcoxon rank-sum test was applied for continuous variables, and Pearson’s chi-squared test was used for categorical variables.Table 1. Characteristics of participants by insufficient hyperopic reserve status among schoolchildren aged 6–12 years, 2020–2024 (n=28,993).
The findings revealed that insufficient hyperopic reserve detection rates increased progressively with age, demonstrating a rapid escalation among students aged 6–8 years. Following a plateau phase between ages 8–11 years, the rates surged dramatically after age 11 (Figure 1A). Notably, substantial disparities in insufficient hyperopic reserve detection rates emerged across regions with varying levels of economic development. Using the 2023 national per capita GDP as the reference standard, participating regions were stratified into high-GDP and low-GDP categories. Specifically, before age 8 years, detection rates in low-GDP regions consistently exceeded those in high-GDP regions. This disparity gradually diminished with advancing age, achieving parity in prevalence by age 9 years. No significant GDP-based regional differences were observed during the 9–11 year period. However, after age 12 years, children in high-GDP regions demonstrated significantly higher prevalence of insufficient hyperopic reserve compared to their counterparts in low-GDP regions (Figure 1B).
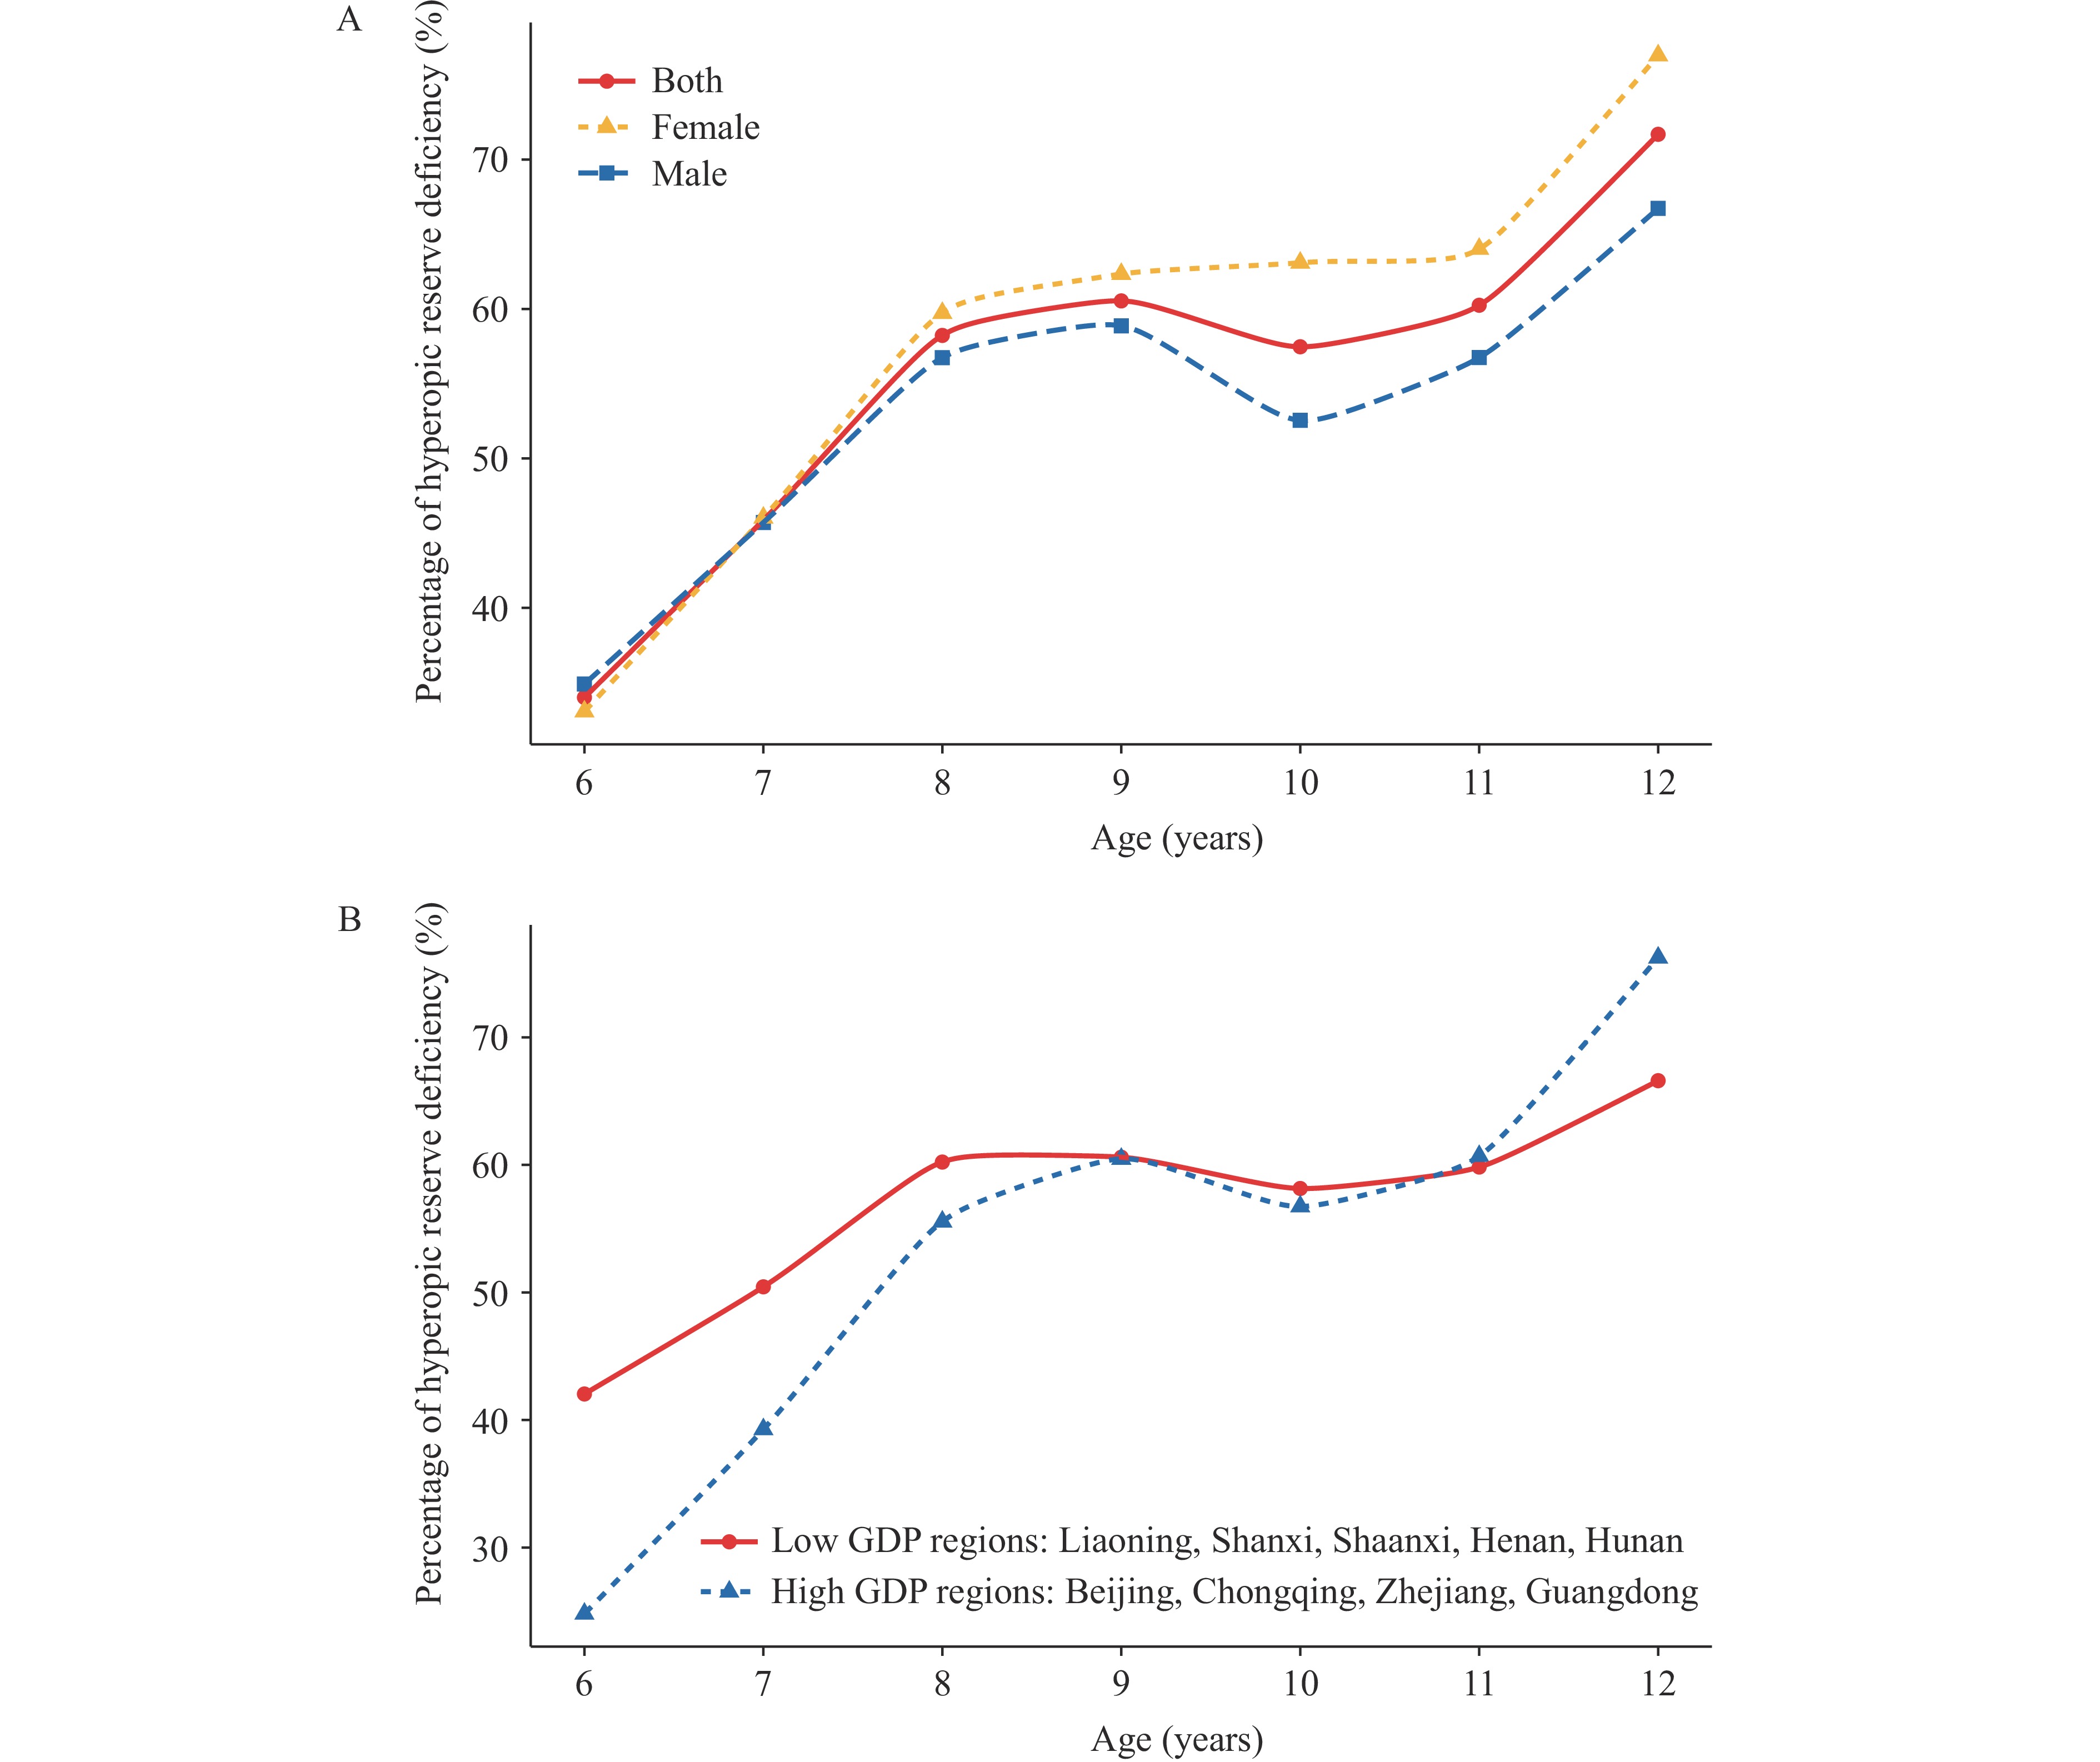 Figure 1.
Age-related patterns in insufficient hyperopic reserve prevalence. (A) Gender-stratified age trends in insufficient hyperopic reserve detection rates; (B) Regional GDP-based differences in age-related insufficient hyperopic reserve patterns.
Note: GDP regional classifications are based on national per capita GDP levels in 2023.
Abbreviation: GDP=gross domestic product.
After adjusting for all relevant confounding factors in Model 3, both medium screen time [odds ratio (OR)=1.09, 95% confidence interval (95% CI): 1.03, 1.15] and high screen time (OR=1.21, 95% CI: 1.14, 1.29) demonstrated significantly stronger associations with insufficient hyperopic reserve compared to the low screen time group. Similarly, for screen habits score, the medium screen habits score group (OR=1.07, 95% CI: 1.01, 1.13) and high screen habits score group (OR=1.19, 95% CI: 1.12, 1.27) showed increased odds of insufficient hyperopic reserve relative to the low screen habits score group (Figure 2A). GDP-stratified analysis revealed that the associations between both screen time and screen habits score with insufficient hyperopic reserve were markedly more pronounced in low-GDP regions (Figure 2B). Further subgroup analysis demonstrated distinct gender-based patterns: insufficient hyperopic reserve among girls in low-GDP regions exhibited stronger associations with both screen time and screen habits score, while the association with direct sunlight exposure was more pronounced among boys in low-GDP regions (Figure 2C).
 Figure 2.
Regional GDP and gender-stratified associations between screen exposure and insufficient hyperopic reserve. (A) Overall associations of screen time and screen habits with insufficient hyperopic reserve; (B) GDP-stratified regional variations in screen exposure associations; (C) Combined GDP-gender stratified differences in screen exposure relationships.
Note: Model 1 adjusts for age and gender; Model 2 additionally includes BMI, grade level, GDP region, and ethnicity; Model 3 further incorporates paternal education level, maternal education level, and parental myopia status.
Abbreviation: GDP=gross domestic product; BMI=body mass index; OR=odds ratio; CI=confidence interval.
* P<0.05; ** P<0.01; *** P<0.001.
-
This nationwide study of 28,993 students aged 6–12 years revealed that insufficient hyperopic reserve risk follows distinct age-related patterns, affecting approximately 70% of students by age 12. Our findings demonstrate significant positive associations between both screen time and poor screen habits with insufficient hyperopic reserve, with these relationships displaying marked heterogeneity across regions stratified by GDP levels. Even after controlling for potential confounders, both screen exposure duration and suboptimal viewing habits remained independently associated with insufficient hyperopic reserve.
Our results demonstrate that the relationship between screen exposure and insufficient hyperopic reserve exhibits pronounced regional heterogeneity, with low-GDP areas consistently showing stronger correlations. The elevated prevalence of insufficient hyperopic reserve among children aged 6–8 years in economically disadvantaged regions likely stems from multiple interconnected factors: limited family awareness regarding ocular health, premature and poorly regulated electronic device usage, and inadequate outdoor recreational spaces. These conditions create a problematic combination of excessive accommodative demands and insufficient hyperopic stimulation during critical visual development periods, thereby accelerating the depletion of hyperopic reserves. As technological advancement accompanies economic growth, intensifying educational pressures may drive students toward prolonged screen-based learning through online courses, supplemental tutoring, and practice sessions, consequently elevating myopia incidence (7). The competitive academic environment fuels increased reliance on electronic educational devices, while concurrent adolescent axial elongation means that sustained near-work demands frequently exceed the eye’s homeostatic regulatory capacity (8).
Our findings also revealed that girls from low-GDP regions demonstrate a stronger association between screen time, screen habits score, and insufficient hyperopic reserve. Research indicates that girls in low-income communities may experience greater screen exposure compared to their peers in high-income areas, primarily due to limited access to extracurricular activities and recreational facilities in these regions (9-10). Previous studies have also demonstrated that girls in low-socioeconomic-status regions exhibit significantly higher overall screen time and weekly hours spent watching television/movies than those in high-GDP regions — a gender-specific pattern not observed among boys (10). Excessive electronic screen use reduces outdoor activity time, while natural outdoor light stimulates retinal dopamine secretion, inhibits axial elongation, and prevents myopia development.
This study encompasses nine PLADs and municipalities across China, providing extensive geographic coverage, substantial sample size, and strong representativeness. However, several limitations warrant acknowledgment. The cross-sectional design precludes causal inference between screen use and insufficient hyperopic reserve. Although we adjusted for key confounders, residual confounding from unmeasured factors such as detailed outdoor activity patterns or other near-work tasks cannot be eliminated. Reliance on questionnaires for screen time assessment may introduce recall bias. Additionally, the study did not comprehensively examine other potential influences including dietary habits or detailed family history. Future longitudinal studies incorporating objective measures and broader risk factor assessments are warranted.
In summary, this study reveals a high prevalence of insufficient hyperopic reserve among Chinese primary school students. The findings demonstrate positive associations between screen time, screen habits score, and insufficient hyperopic reserve. These associations were particularly pronounced in low-GDP areas, especially among girls. The research suggests that parents should implement strict limitations on children’s screen time and correct poor screen habits. Government agencies should intensify educational outreach efforts in low-GDP areas.
-
Approval by the institutional review board of Beijing Centers for Disease Prevention and Control (2022 No.24).
-
All staff members who contributed to this comprehensive study, including personnel from the provincial centers for disease control and prevention in Beijing, Zhejiang, Chongqing, Shaanxi, Liaoning, Henan, Guangdong, Shandong, Hunan, and Shanxi.
HTML
| Citation: |

|