
 Download:


-
Nutrition knowledge (NK) is defined as an individual’s cognitive process related to food and nutrition-related information, a key modifiable factor in dietary behavior and nutritional status in children (1). Improved NK is associated with healthier eating patterns, including increased fruit and vegetable consumption, and reduced childhood overweight/obesity risk (2-3). Junior high school students are at a crucial stage of physical and cognitive development when lifelong dietary habits form. Although they gain independence in food choices, most children fail to meet dietary guidelines and lack healthy dietary habits (4). This highlights the need to strengthen nutritional education and improve NK to promote healthy dietary habits and improve long-term health.
Given the importance of NK, Healthy China 2030 aim to increase NK awareness by 10% from 2022 baseline levels by 2030 (5). However, baseline data on NK awareness among school-aged children are lacking. Previous studies were limited to regional populations and showed heterogeneity in populations, methods, and assessment tools (6). To address this gap, the China Nutrition and Health Knowledge Survey (CNHKS 2023–2024) was conducted in 2023 under the National Health Commission to assess NK in school-age children.
This study used data from junior high school students to assess NK levels and identify key target populations, priority regions, and core content areas for NK education.
HTML
-
The data were obtained from the CNHKS 2023–2024, a nationwide cross-sectional study using a multistage stratified random cluster sampling method to recruit children aged 6–17 years through schools from 195 survey sites (counties or districts) from 31 provincial-level administrative divisions in China. These sites were selected to ensure a nationally representative sample reflecting China’s geographic and socioeconomic diversity. The sampling framework involved selecting two primary schools, one junior high school, and one high school per site. Stratified sampling by grade level was performed within each school, followed by random cluster sampling of classes. At each site, 504 children aged 6–17 years were selected per age group, maintaining sex balance. Participants should be able to communicate normally and without any serious intellectual disabilities. In total, 28,629 junior high school students participated. The inclusion criteria comprised students who completed data on all survey components, including basic information and NK. Students with missing demographic variables (sex and age; n=91) or missing NK scores (n=172) were excluded. This study included 28,366 students. All participants volunteered after understanding the survey content.
-
Data were collected using the Chinese Nutrition Health Knowledge Questionnaire for school-aged children (CNHKQ-C), developed by the National Project Team for CNHKS 2023–2024. This questionnaire assessed NK levels in Chinese children aged 6–17 years, following a rigorous scientific process (7). Delphi expert consultation and pilot testing demonstrated good reliability (Cronbach’s α=0.79, split-half r=0.66) and validity (average scale-level content validity index =0.91, χ2/df=2.87, root mean square error of approximation =0.048, goodness-of-fit index =0.92).
The CNHKQ-C had four versions for grades 1–3 of primary school, grades 4 and above, junior high school, and senior high school. The junior high school version contains 26 items across five NK dimensions: dietary recommendations (seven items), nutrient content of foods (four items), food and health (four items), food choices (seven items), and food safety (four items). NK scores ranged from 0 to 100 based on correct responses. Scoring included: single-choice questions (seven items at two points each, plus one item with three sub-items at two points each, totaling 20 points), multiple-choice questions (16 items with one point per correct option and four points maximum per question, totaling 64 points), table-based questions (one item containing eight sub-items at one point each, totaling eight points), and matching questions (one item with four matching pairs at two points each, totaling eight points). Incorrect answers were scored 0. Students scoring 75 points or higher were considered to have NK. The 75-point cutoff was determined without receiver operating characteristic curve analysis due to a lack of a gold standard binary outcome. Therefore, the cutoff score primarily referred to the established cutoff score for Chinese adults aged 18–64 years and those used in previous studies on children and adolescents (8–10). The overall NK awareness rate represents participants achieving this threshold. Dimension-specific NK awareness rate indicates participants scoring above 75% of the maximum possible score for that dimension. For the knowledge-point analysis, each single-choice question was considered one knowledge point, while multiple-choice, table-based, and matching questions’ subitems or matching pairs were individual knowledge points. The questionnaire included 86 knowledge-based questions.
Sociodemographic information, including sex, grade, parental education, occupation, and home environment, was collected using a questionnaire. A composite socioeconomic status (SES) index was derived from these variables using factor analysis was categorized into low-, medium-, and high-level groups by tertiles.
-
All analyses incorporated post-stratification weighting. NK awareness rate was expressed using the weighted rate with 95% confidence intervals (CIs). The Rao–Scott chi-square test compared differences in NK awareness rates between subgroups. Post hoc pairwise comparisons were conducted using Tukey’s honest significant difference test. Multivariate logistic regression assessed subgroup differences after controlling for potential confounders, adjusting for sex, grade, SES, urban/rural area, and region. All analyses were conducted using SAS software (version 9.4; SAS Institute, Cary, NC, USA). Statistical significance was set at P<0.05.
Data Source
Data Collection
Statistical Analysis
-
The baseline characteristics of the participants are shown in Table 1. This study included 28,366 junior high school students, 14,214 males (50.1%), and 22,905 urban students (59.9%).
Characteristics Samples
N (%)*Total Dietary recommendations Nutrient content of foods Food and health Food choices Food safety Overall 28,366
(100.0)40.0
(36.5, 43.5)20.1
(17.9, 22.4)46.2
(43.7, 48.7)65.3
(62.8, 67.7)65.2
(62.6, 67.7)65.2
(62.9, 67.5)Sex Male 14,214
(50.1)38.2
(34.8, 41.7)18.7
(16.4, 21.0)45.9
(43.5, 48.4)61.9
(59.2, 64.5)62.8
(60.1, 65.5)61.2
(58.6, 63.8)Female 14,152
(49.9)42.0
(38.4, 45.7)21.6
(19.2, 23.9)46.5
(43.8, 49.1)69.2
(66.9, 71.6)68.0
(65.5, 70.1)69.9
(67.6, 72.2)P <0.001 <0.001 0.314 <0.001 <0.001 <0.001 Grade§ 7 9,793
(33.4)34.4
(30.7, 38.1)17.9
(15.4, 20.4) †40.4
(37.3, 43.5)61.6
(58.6, 64.5)60.9
(58.0, 63.8)61.6
(58.8, 64.4)8 9,232
(33.6)40.6
(36.6, 44.5)19.9
(17.0, 22.8)†46.8
(44.1, 49.6)65.9
(63.2, 68.6)66.7
(63.9, 69.5)†66.6
(63.9, 69.4)†9 9,341
(33.0)45.1
(40.9, 49.4)22.4
(19.5, 25.3)51.4
(48.5, 54.3)68.5
(65.7, 71.3)68.1
(64.9, 71.2)†67.5
(64.9, 70.1)†P <0.001 0.005 <0.001 <0.001 <0.001 <0.001 SES level§ Low 13,136
(52.1)33.2
(29.8, 36.5)16.5
(14.0, 19.1)40.2
(37.4, 43.0)60.3
(57.1, 63.5)60.5
(57.1, 63.9)61.4
(58.2, 64.6)Medium 6,547
(22.5)41.4
(38.5, 44.2)21.7
(19.2, 24.3)47.0
(44.6, 49.3)67.2
(65.1, 69.4)66.6
(64.1, 69.1)66.2
(63.9, 68.4)High 8,683
(25.5)52.8
(50.0, 55.6)25.8
(23.2, 28.4)57.7
(55.2, 60.1)73.8
(71.8, 75.8)73.6
(71.7, 75.6)72.3
(70.3, 74.2)P <0.001 <0.001 <0.001 <0.001 <0.001 <0.001 Area type Urban 22,905
(59.9)44.4
(41.3, 47.5)21.4
(19.2, 23.7)50.7
(48.5, 53.0)68.7
(66.8, 70.6)67.9
(66.0, 69.8)67.7
(65.9, 69.6)Rural 5,461
(40.1)33.4
(26.6, 40.2)18.0
(13.5, 22.5)39.4
(35.1, 43.7)60.2
(55.7, 64.8)61.2
(56.0, 66.4)61.5
(56.8, 66.2)P <0.001 0.185 <0.001 <0.001 0.009 0.008 Region Eastern 11,037
(37.0)49.9
(44.0, 55.9)27.5
(23.4, 31.5)54.1
(50.2, 58.1)69.9
(66.5, 73.2)72.0
(68.6, 75.3)69.5
(66.5, 72.6)Central 8,503
(32.9)37.1
(31.2, 43.1)†16.8
(12.9, 20.7)†43.1
(38.4, 47.7)†62.9
(57.7, 68.0)†64.8
(59.5, 70.1)63.6
(58.7, 68.4)†Western 8,826
(30.1)30.9
(26.2, 35.7)†14.5
(11.5, 17.5)†39.8
(36.1, 43.5)†62.3
(58.7, 65.8)†57.4
(53.4, 61.4)61.8
(57.9, 65.7)†P <0.001 <0.001 <0.001 0.010 <0.001 0.012 Abbreviation: SD=standard error; CI=confidence interval; SES=socioeconomic status.
* Percentages are weighted.
† Values sharing the same superscript letter do not differ significantly (P>0.05).
§ The Cochran-Armitage trend test showed P<0.05.Table 1. Demographic variations in nutrition knowledge level among junior high school students (%, 95% CI).
The overall NK awareness rate among junior high school students in 2023–2024 was 40.0% (95% CI: 36.5%–43.5%). Univariate analysis revealed significant variations among the demographic groups. Females (42.0%, 95% CI: 38.4%–45.7%) had a higher rate than males (38.2%, 95% CI: 34.8%–41.7%). The rate increased with grade and SES (P trend<0.001). With regard to area type, students with a higher awareness rate were from urban areas (44.4%, 95% CI: 41.3%–47.5%) or eastern regions (49.9%, 95% CI: 44.0%–55.9%) (P<0.001), as visually summarized in Figure 1. Post-hoc analyses revealed no statistically significant differences between the central and western regions (P>0.05). Multivariate logistic regression analysis confirmed that the disparities across subgroups remained statistically significant after the adjustment (Table 2).
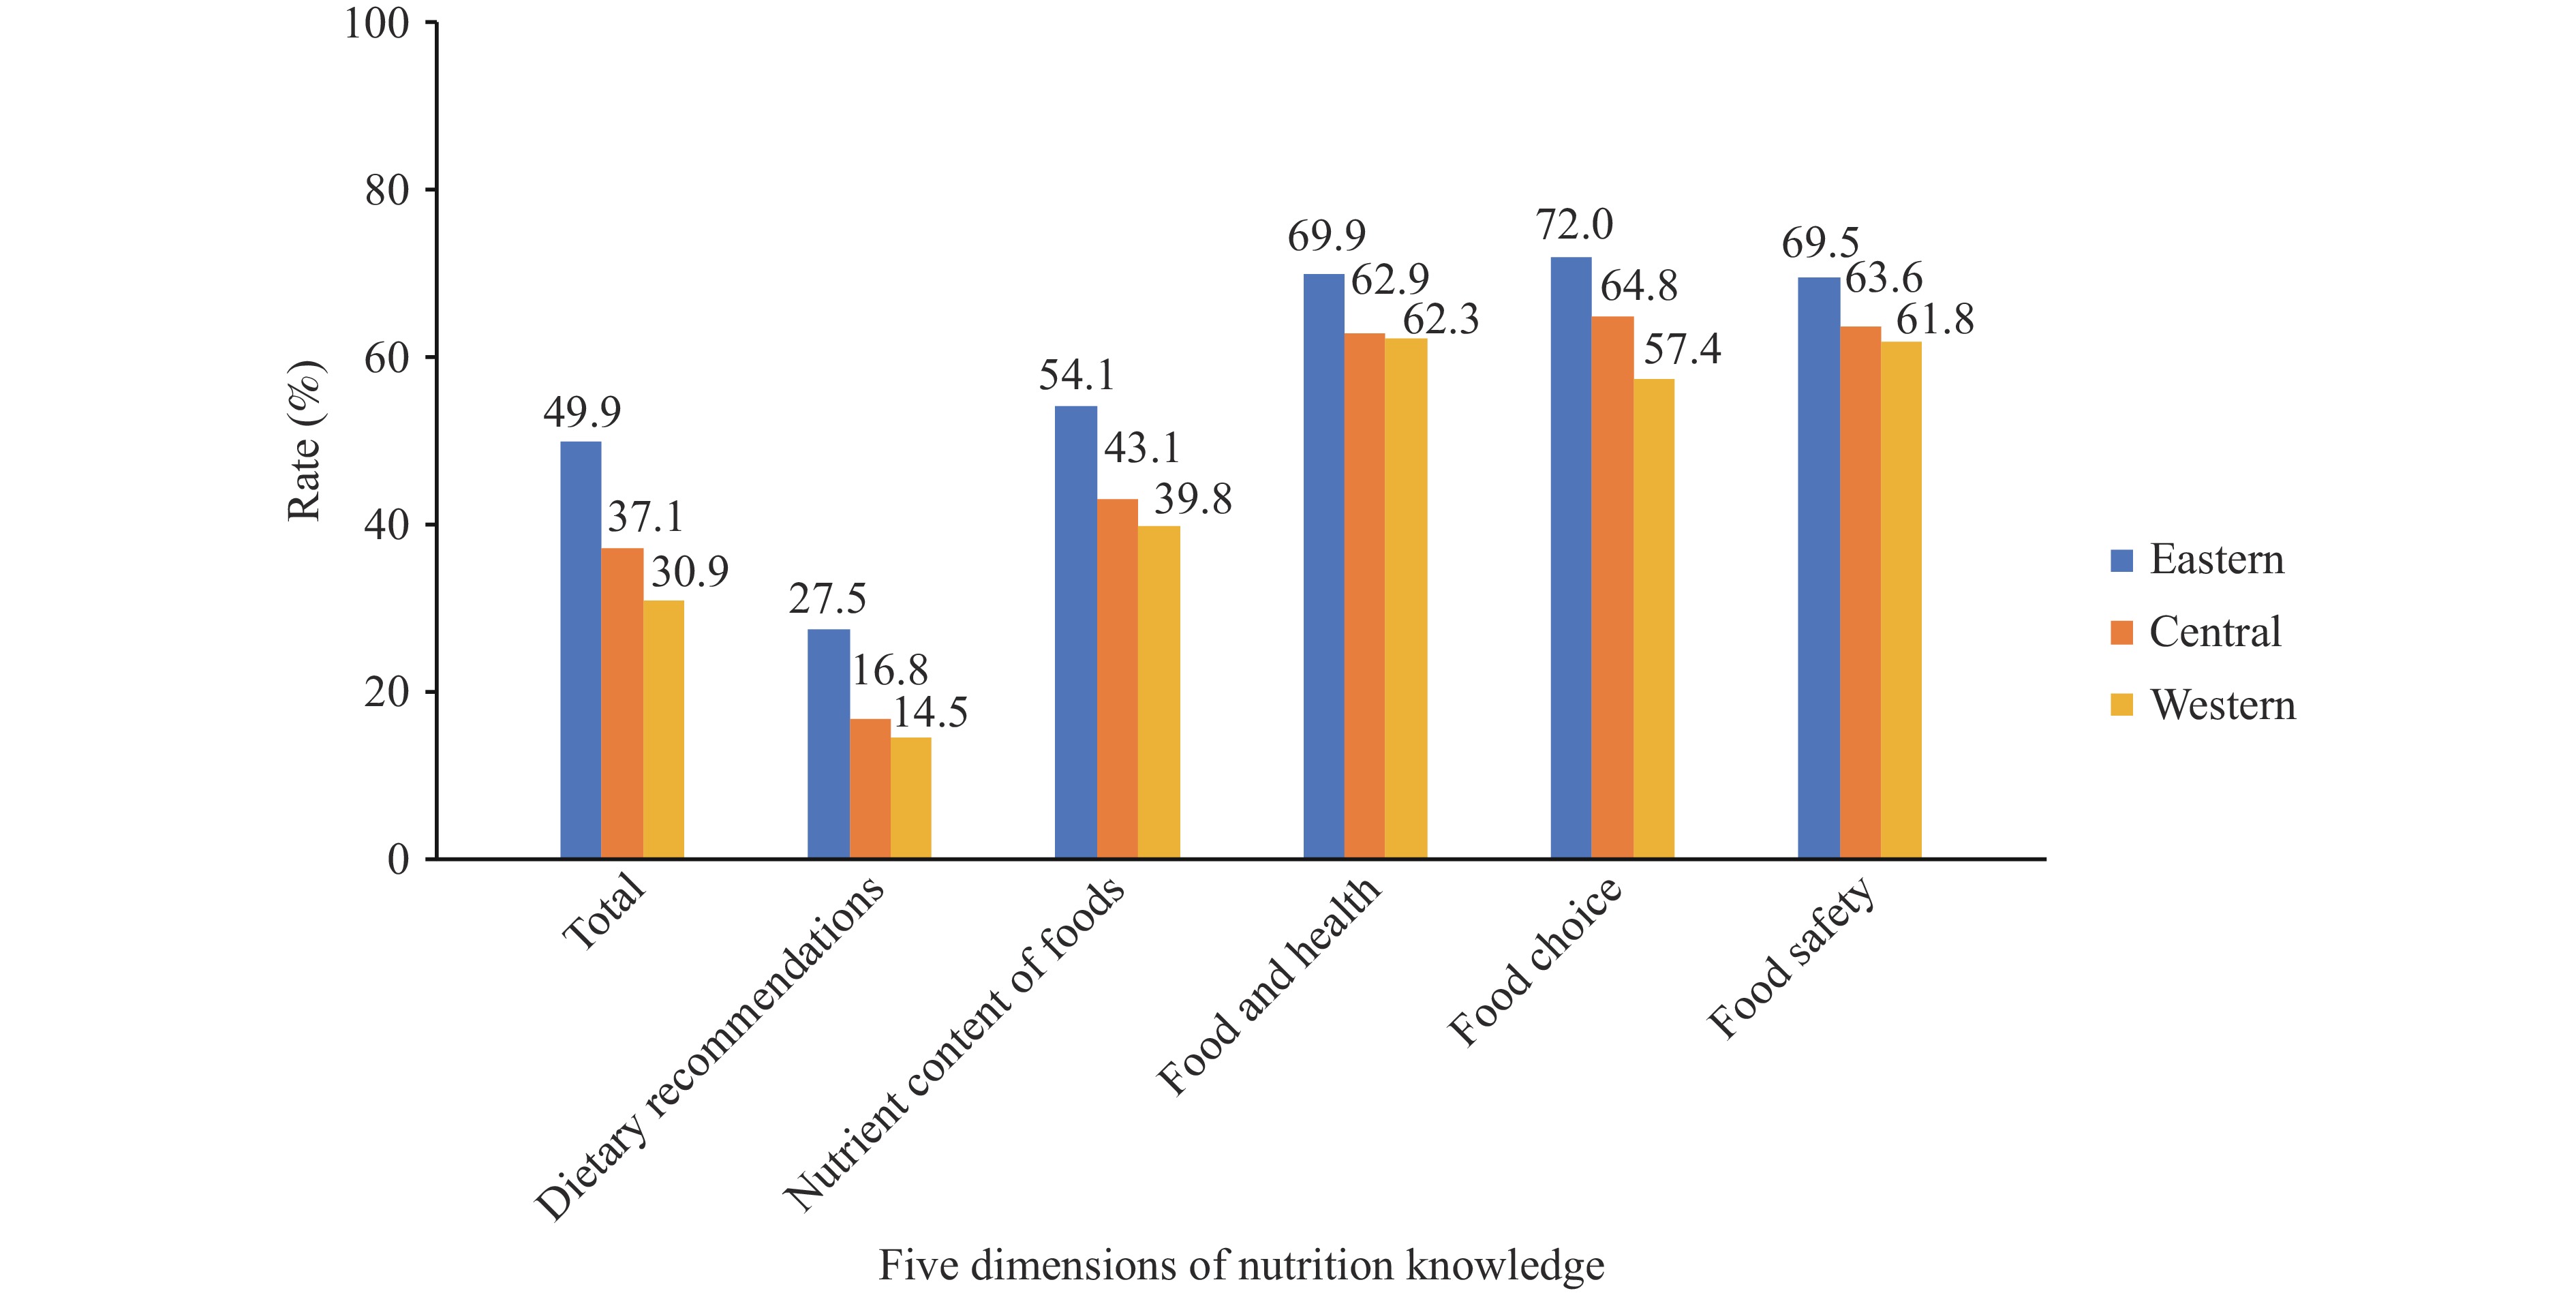 Figure 1.
Regional differences in nutrition knowledge awareness rates.
Variable Unawareness (N=16,332) Awareness (N=12,034) Univariate analysis Multivariate analysis OR (95% CI) P OR (95% CI) P Sex Male 8,479 5,735 Reference Reference Female 7,853 6,299 1.17 (1.12−1.23) <0.001 1.19 (1.13−1.25) <0.001 Grade 7 6,172 3,621 Reference Reference 8 5,170 4,062 1.30 (1.19−1.43) <0.001 1.33 (1.21−1.48) <0.001 9 4,990 4,351 1.57 (1.37−1.80) <0.001 1.57 (1.37−1.81) <0.001 SES level Low 8,492 4,644 Reference Reference Medium 3,784 2,763 1.42 (1.29−1.57) <0.001 1.31 (1.19−1.44) <0.001 High 4,056 4,627 2.25 (1.94−2.61) <0.001 1.87 (1.63−2.13) <0.001 Area type Urban 12,697 10,208 Reference Reference Rural 3,635 1,826 0.63 (0.49−0.81) <0.001 0.73 (0.59−0.91) <0.001 Region Eastern 5,392 5,645 Reference Reference Central 5,146 3,357 0.59 (0.44−0.80) <0.001 0.68 (0.51−0.90) <0.001 Western 5,794 3,032 0.45 (0.34−0.59) <0.001 0.49 (0.38−0.63) <0.001 Abbreviation: OR=odds ratio; CI=confidence interval. Table 2. Univariate and multivariate analysis of disparities in nutrition knowledge level.
The highest awareness rates were 65.3% for food and health, 65.2% for food choices and food safety, 46.2% for the nutrient content of foods, and 20.1% for dietary recommendations. Subgroup differences in the awareness rates for each dimension matched the overall awareness rate. No significant sex differences were observed in the nutrient content (P=0.314), and no urban-rural differences in the dietary recommendation (P=0.185).
Analysis of 86 individual knowledge points identified 10 with the lowest correct rates (18.4%–40.7%), shown in Table 3. “Shelf life and food safety” had the lowest correct rate (18.4%). Correct rates for the recommended daily intakes of cooking oil, salt, and added sugar were 22.9%, 33.8%, and 35.1%, respectively. Rates for the recommended intakes of soy products, dairy products, and meat were 33.3%, 38.3%, and 39.9%, respectively. Among these points, seven were from the dietary recommendations, two from the food safety, and one from food and health. These points exhibited subgroup variations. Detailed comparisons are presented in the
Supplementary Table S1 .Rank Knowledge points Correct rate (%) Dimension 1 Shelf life and food safety 18.4 Food safety 2 Recommended level of daily cooking oil intake 22.9 Dietary recommendations 3 Recommended level of soy product intake 33.3 Dietary recommendations 4 Recommended level of daily salt intake 33.8 Dietary recommendations 5 Recommended level of daily sugar intake 35.1 Dietary recommendations 6 Keeping raw and cooked food separately during storage 38.1 Food safety 7 Recommended level of dairy product intake 38.3 Dietary recommendations 8 Lactic acid bacterial drinks are beverages, not dairy products 38.4 Food and health 9 Recommended level meat intake 39.9 Dietary recommendations 10 Nutritionally balanced breakfast combinations 40.7 Dietary recommendations Table 3. Ten knowledge points with the lowest correct rates among junior high school students (ascending order).
-
Our study provides a baseline assessment for Healthy China 2030 by revealing a 40.0% NK awareness rate among Chinese junior high school students. This is lower than the rate reported for European adolescents (60%) (11) but higher than that of Italian adolescents (1.4%) (12). Although comparing CNHKS results with those of other studies is difficult due to different methodologies and evaluation criteria used, there remains room for improvement in the NK level of students in our country.
This study demonstrated significant variations in NK levels across demographic and socioeconomic groups, with higher rates observed among females, higher-grade students, and those from urban or eastern regions or with a higher SES. These results align with those of previous studies (9,11). Females show more interest in health and physical appearance than males. Students in higher grades better understand nutritional information through training and education (9,11). SES disparities in NK levels stem from three primary factors. First, parents with higher SES have greater NK, enabling better dietary guidance for their children (13). Second, they communicate nutritional information through daily interactions (“Drink milk to grow taller”). Third, knowledge transfers through observation of parental behaviors, including food choices. Children internalize knowledge by imitating their behavior (14). These create a favorable family food environment, fostering NK in children. Such SES-based disparities suggest NK dissemination should target parents and caregivers, particularly in disadvantaged families. Rural and Western students have lower NK awareness, possibly due to limited school-based nutrition education and community health resources (15). Therefore, more effort should focus on implementing targeted programs in these regions to address socioeconomic barriers and enhance intervention equity.
The current study revealed that junior high school students had limited knowledge of dietary recommendations, especially the Chinese Food Guide Pagoda, which presents intake levels of various foods graphically. Most students demonstrated limited awareness of the recommended intake of dairy, soy, and meat products. Monitoring data showed that actual consumption of these foods fell below the Chinese Dietary Guidelines 2022 standards, whereas oils and salt intake exceeded recommended limits (4). Furthermore, students’ knowledge of the recommended daily salt, oil, and sugar intake remains insufficient. This suggests that despite the national “Three reductions” (reduced salt, oil, and sugar) initiative launched in 2016, awareness among students remains limited. These findings highlight the urgent need for school-based nutrition education centered on Chinese Dietary Guidelines. Beyond knowledge dissemination, nutrition education should focus on effective interventions to develop practical skills, including food selection, menu planning, and label reading. It should foster students’ ability to translate NK into daily dietary practices, enabling healthy food choices while following dietary guidelines. This approach bridges the gap between knowledge and practical application, promoting healthy eating behaviors in the long term.
A key strength of this study is its use of nationally representative data, which provides a comprehensive overview of junior high school students’ NK levels. Additionally, this study used a scientifically validated assessment tool developed through a rigorous, multistage process, ensuring the reliability of the NK evaluation. However, this study had certain limitations. First, although the sampling design ensured nationally representative coverage of mainstream junior high schools, it excluded students from special education or vocational schools. Second, despite adjusting for sociodemographic variables, unmeasured factors such as school nutrition education quality or socioeconomic development could result in residual confounding.
-
This study provides baseline data on NK awareness levels among junior high school students for assessing Healthy China 2030 indicators. It identified key target populations, priority regions, and core content areas for NK dissemination among Chinese junior high school students. The findings may guide policymakers, researchers, and public health professionals in developing targeted NK dissemination strategies. These include (1) expanding NK dissemination coverage, particularly in rural and low-SES areas, and (2) enhancing nutrition education by integrating evidence-based behavioral science and practical dietary skills into school curricula. Such approaches are essential for enhancing students’ knowledge and skills, ultimately translating NK into sustained healthy eating behaviors.
-
Approved by the Medical Ethical Review Committee of the National Institute for Nutrition and Health, Chinese Center for Disease Control and Prevention (No. 2022-037).
| Citation: |

|